AVALONhas explosively broken out of a massive ascending triangle1. The Macro Perspective: The Institutional Staircase
I am taking a LONG bias on Avalon Technologies Limited (AVALON) on the weekly (1W) timeframe.
When analyzing pure market structure, the most powerful and sustainable breakouts occur in alignment with an established macro trend. Look at the massive structural development on this chart. The defining feature is the steep, unbroken ascending trendline (the lower solid black line). Every single time the stock experienced a pullback, institutional buyers aggressively stepped in exactly at this dynamic support line. They refused to let the secular bull trend break, consistently printing higher lows and indicating massive, systemic accumulation over the long term.
2. The Educational Setup: The Squeeze and The Ceiling
To understand the sheer strength of this current breakout, look at how the price systematically squeezed historical resistance to form a textbook "Ascending Triangle":
The Concrete Ceiling: The stock's recovery was heavily capped by a formidable horizontal resistance line at 1,264.45. Sellers repeatedly defended this extreme high, creating a clear supply ceiling.
The High-Level Squeeze: Notice how the pullbacks became shallower over time, riding the ascending trendline and the 20 SMA (the middle blue line of your Bollinger Bands). By pressing up against the flat horizontal ceiling while simultaneously forming higher lows, the stock acted like the ultimate pressure cooker. It gracefully transferred shares from impatient retail traders to strong-handed institutional buyers, storing immense kinetic energy as the structure tightened.
3. Current Price Action: Riding the Upper Band into Blue Sky
Look at the most recent weekly candles on the far right. The high-level pressure cooker has absolutely exploded. Buyers have effortlessly shattered the 1,264.45 macro ceiling with a massive, full-bodied green momentum thrust, pushing the price well past the 1,400 mark. Furthermore, notice how the price has violently pierced the upper Bollinger Band, forcing the bands to rapidly expand upward. By decisively clearing this extreme resistance zone, AVALON has officially entered "Blue Sky Territory" (pure price discovery). All historical overhead supply has been completely eliminated.
4. The Trade Plan: Entries, Targets, and Risk Management
Entry Strategy: Momentum is exceptionally strong right now near 1,464.40. Chasing a massive vertical expansion candle that is riding outside the weekly Bollinger Bands always carries a higher risk of an immediate intraday or daily mean-reversion pullback as the stock breathes. The highest-probability, lowest-risk entry involves stepping down to a daily timeframe and waiting for the dust to settle. Look to place limit orders to catch a potential structural pullback to perfectly retest the 1,260.00 to 1,300.00 breakout zone. Letting that heavy historical resistance prove itself as a new, indestructible support floor offers a phenomenal risk-to-reward ratio.
Take Profit (Targets): Because the stock is breaking out of a massive macro structure into pure price discovery, we use measured targets based on the depth of the pattern. By taking a conservative depth of the ascending triangle (roughly 600+ points from the ~646 mid-base up to the 1,264.45 ceiling) and projecting it upward from the breakout line, our primary structural macro target sits comfortably in the 1,850.00 to 1,900.00 zone. The immediate psychological milestone will be the 1,500.00 mark.
Invalidation (Stop Loss): A trade thesis is only valid if the new market structure holds. A hard stop loss should be placed safely below the breakout line and the rising 20 SMA, around the 1,100.00 to 1,150.00 level. A definitive weekly close completely back inside the triangle and breaking below the ascending trendline would invalidate the immediate continuation thesis and signal a severe macro bull trap.
5. Time Horizon:
Because this technical setup is built on a 1-Week chart capturing a massive structural phase transition and volatility expansion, this is a medium-to-longer-term position trade designed to capture the explosive new markup phase. Let the new trend run!  Long
Long
CEMPRO: Massive Rounding Bottom and Explosive Macro Breakout1. The Macro Perspective: The Deep Washout and Aggressive Recovery
I am taking a LONG bias on Cemindia Projects Ltd (CEMPRO) on the weekly (1W) timeframe.
When analyzing pure market structure, we want to look for areas where supply is completely exhausted and demand takes over with undeniable force. Look at the macro structure on this chart. After establishing a heavy historical ceiling directly at the 933.15 level, the stock suffered a deep, highly volatile markdown phase that dragged the price all the way down toward the 525 zone. This successfully washed out all the weak hands. However, instead of languishing in a secular bear market, the stock initiated a massive "Rounding Bottom" accumulation phase.
2. The Educational Setup: The Power of the Right Side
To understand the sheer strength of this current breakout, look at the price action on the right side of the curve:
The Momentum Shift: Notice how the recovery wasn't a slow, grinding chop. Once the stock found its absolute floor, institutional buyers stepped in aggressively. The right side of this rounding bottom is incredibly steep, characterized by large, full-bodied green weekly candles.
Ignoring the Mid-Line: Look at the dashed mid-level pivot at 795.45. In a weaker stock, this level would act as major resistance and force a deep pullback. Instead, CEMPRO simply gapped or pushed straight through it, using it merely as a brief resting stop before continuing its aggressive ascent. This shows that buyers were highly motivated and unwilling to wait for deep discounts.
3. Current Price Action: Blue Sky Territory
Look at the most recent weekly candle on the far right, accompanied by a massive surge in buying volume (bottom panel). The pressure cooker has exploded. Buyers have effortlessly shattered the 933.15 ultimate macro resistance, printing an enormous expansion candle. By clearing this final historical ceiling with such velocity, the stock has officially entered "Blue Sky Territory" (pure price discovery). There is absolutely zero historical overhead supply left to act as natural resistance.
4. The Trade Plan: Entries, Targets, and Risk Management
Entry Strategy: Momentum is exceptionally strong right now near 956.15. Chasing a massive, near-vertical weekly expansion candle always carries a higher risk of an immediate intraday or daily drawdown. The highest-probability, lowest-risk entry involves stepping down to a daily timeframe and placing limit orders to catch a potential structural pullback to retest the 930.00 to 940.00 breakout zone. Letting that old, heavy resistance prove itself as a new, indestructible support floor offers a phenomenal risk-to-reward ratio.
Take Profit (Targets): Because the stock is in pure price discovery, we use measured structural targets. By taking the depth of the massive macro rounding bottom (roughly 408 points from the ~525 base to the 933.15 neckline) and projecting it upward from the breakout line, our primary structural target sits comfortably in the 1,340.00 to 1,350.00 macro extension zone. Immediate psychological milestones are 1,100.00 and 1,200.00.
Invalidation (Stop Loss): A trade thesis is only valid if the new market structure holds. A hard stop loss should be placed safely below the breakout zone and within the body of the recent weekly momentum thrust, around the 850.00 to 870.00 level. A definitive weekly close completely back below the 933.15 line would act as an early warning sign of a failed macro breakout (a "bull trap").
5. Time Horizon:
Because this technical setup is built on a 1-Week chart capturing a massive structural completion and momentum thrust into fresh price discovery, this is a medium-to-longer-term position trade designed to play out over the coming weeks to months. Let the macro trend run!  Long
Long
RADICO: Daily Break & Retest1. The Macro Perspective: The Massive Accumulation Cup
I am taking a LONG bias on Radico Khaitan Limited (RADICO) on the daily (1D) timeframe.
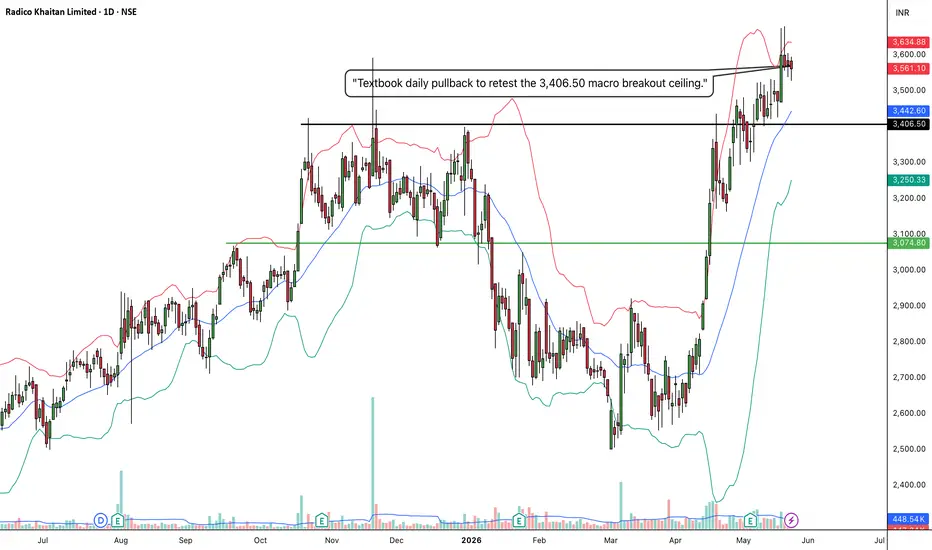
When analyzing pure market structure, sustainable long-term trends do not move in a straight line; they breathe through cycles of expansion and compression. Look at the extensive structural development displayed across Screenshot 2026-05-23 at 17.07.29.jpg. After a major markup phase that topped out in late 2025, the stock underwent an extensive corrective digestion phase, dropping down toward the 2,500–2,600 area. This deep correction washed out weak retail hands and allowed institutional buyers to absorb liquidity at a steep discount. Over the last few months, the stock has systematically carved out a massive rounding recovery, marching back up the right side of the base to challenge key historical supply.
2. The Educational Setup: Neckline Clearance and Volatility Squeeze
To understand the technical validity behind this massive breakout structure, we examine the clear horizontal parameters and dynamic indicators acting across the chart:
The Major Resistance Ceiling: The absolute horizontal line to watch is the solid black line drawn at 3,406.50. This level has historically acted as a major roadblock where sellers aggressively blocked further upward expansion, establishing a key macro neckline.
The Bollinger Band Springboard: Notice how the price action behaved leading up to the breakout. As the price climbed back to the 3,406.50 ceiling, the Bollinger Bands expanded and the price began riding the upper band. Following that initial vertical surge, the stock has entered a tight consolidation phase, allowing the rising daily 20 SMA (the middle blue line of your Bollinger Bands, currently near 3,442.60) to catch up and act as a dynamic cushion.
3. Current Price Action: The Ultimate Retest Confirmation
Look closely at the most recent daily candles on the far right of the chart. After an explosive momentum thrust that launched the price to local highs near 3,634.88, the stock is executing a highly controlled, shallow pullback. To amateur retail traders, these minor red candles look like a failed rally. To structural price action traders, this is a textbook "Break and Retest" pattern. The stock is pulling back to perfectly test the 3,406.50 breakout line and the daily 20 SMA from above. By holding its ground here, that old, heavy historical resistance is officially being flipped into a brand-new, indestructible structural launchpad.
4. The Trade Plan: Entries, Targets, and Risk Management
Entry Strategy: We are currently sitting directly inside the highest-probability "golden entry" zone. Chasing the initial vertical breakout candle is always dangerous due to mean-reversion risks, which is exactly why we wait for pullbacks like this. The lowest-risk entry involves scaling into long positions within the current 3,400.00 to 3,460.00 digestion range, looking for a strong daily reversal candle to confirm that buyers are aggressively defending this newly claimed support floor.
Take Profit (Targets): Because the stock is clearing a major macro base to target fresh multi-year highs, we use a measured move strategy. By taking the depth of the rounding base (roughly 850 points from the ~2,550 floor up to the 3,406 breakout neckline) and projecting it upward, our primary structural macro target sits comfortably in the 4,200.00 to 4,250.00 zone over the coming weeks. Near-term psychological targets rest at 3,800.00 and 4,000.00.
Invalidation (Stop Loss): A break-and-retest thesis is completely invalidated if the price fails to defend its new floor and slips back into the core of its older base. A hard stop loss should be placed safely below the recent swing low and the green structural line, specifically around the 3,040.00 to 3,080.00 zone. A definitive daily close completely back below 3,050 would act as a major warning sign of a failed macro breakout and a severe bull trap.
5. Time Horizon:
Because this technical setup is engineered on a 1-Day chart capturing a clean range breakout and an immediate structural retest, this is a high-alpha swing trade designed to capture a rapid momentum continuation over the coming days and weeks. Let the markup phase run!  Long
Long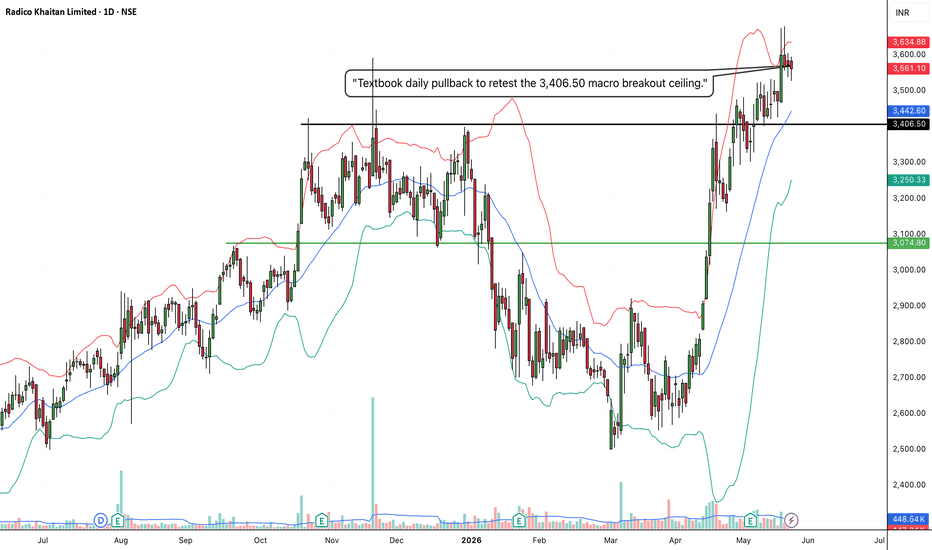
SHILPAMED: Monthly Macro Base Breakout1. The Macro Perspective: The Multi-Year Consolidation Base
I am taking a LONG bias on Shilpa Medicare Limited (SHILPAMED) on the absolute macro monthly (1M) timeframe.
When analyzing pure market structure on a monthly chart, we are looking at the footprint of long-term institutional accumulation. Look at the staggering structural development displayed across Screenshot 2026-05-26 at 14.44.51.jpg. After a major rally through mid-2024, the stock entered a broad, multi-year horizontal range. This corridor has been rigidly bounded by a rock-solid accumulation floor at 288.85 and a formidable overhead resistance ceiling at 471.55. This multi-year consolidation served as a massive liquidity vacuum, thoroughly exhausting weak retail hands while strong-handed institutional portfolios methodically absorbed all floating supply.
2. The Educational Setup: Dynamic Support and Volatility Compression
To understand the absolute technical validity behind this macro breakout, look closely at how perfectly the price structure interacted with its core boundaries right before launching:
The 20 SMA Cushion: Notice the deep corrective swing that occurred in late 2025 into early 2026. The downward pressure stopped dead in its tracks exactly at the rising monthly 20 SMA (the middle blue line of your Bollinger Bands, currently sitting at 381.28). Institutional capital heavily defended this moving average, refusing to let the primary bull trend break.
The High-Level Squeeze: Following that dynamic defense, buyers immediately pushed the price right back up to the 471.55 ceiling. Notice how the price action began coiling tightly against this horizontal resistance line. This high-level compression represents immense kinetic energy storing under the surface—a classic volatility squeeze before a massive structural expansion.
3. Current Price Action: Entering Pure Price Discovery
Look at the most recent monthly candle on the far right of the chart. The technical pressure cooker has officially exploded. Institutional buyers have stepped in with undeniable conviction, printing a massive, full-bodied green expansion candle that has surged up to 500.35 (+23.04%). This vertical thrust has decisively obliterated the 471.55 multi-year ceiling, pushing the price into clear price discovery territory. Furthermore, the price has pierced the upper Bollinger Band, confirming a textbook shift out of a low-volatility accumulation phase and into a highly explosive, high-volatility secular markup trend.
4. The Trade Plan: Entries, Targets, and Risk Management
Entry Strategy: Macro momentum is exceptionally strong right now with the stock trading near 500.35. Because the monthly candle is extended and pushing hard against the upper Bollinger Band, chasing the vertical move immediately carries a short-term mean-reversion risk on lower timeframes. The highest-probability, lowest-risk entry strategy involves stepping down to the weekly or daily timeframe and waiting for the initial vertical excitement to cool off. Look to scale into long positions or place limit orders to catch a potential structural pullback to perfectly retest the 460.00 to 475.00 broken resistance zone. Letting old macro resistance prove itself as a concrete new support floor offers a phenomenal risk-to-reward ratio.
Take Profit (Targets): Because the stock is clearing a major multi-year structure to launch into uncharted sky territory, we use a measured move strategy based on the depth of the base. By taking the core depth of this consolidation range (roughly 183 points from the 288.85 floor up to the 471.55 ceiling) and projecting it upward from the breakout point, our primary structural macro target sits comfortably in the 650.00 to 660.00 zone. Intermediate profit-taking milestones rest at the psychological round numbers of 550.00 and 600.00.
Invalidation (Stop Loss): An explosive macro breakout thesis is completely invalidated if the price fails to hold its newly claimed structural floor and collapses back inside the base boundaries. A hard stop loss should be placed safely below the monthly 20 SMA cushion, specifically around the 360.00 to 380.00 level. A definitive monthly close completely back below 370.00 would act as a severe warning sign of a failed macro breakout and a major bull trap.
5. Time Horizon:
Because this technical setup is built on a 1-Month chart capturing a massive structural phase transition and a multi-year base breakout, this is a longer-term position trade designed to capture a secular markup phase over the coming months and quarters. Let the macro trend run!  Long
Long
SANDHAR: Weekly Macro Breakout1. The Macro Perspective: The Broad Base and Deep Washout
I am taking a LONG bias on Sandhar Technologies Limited (SANDHAR) on the weekly (1W) timeframe.
When analyzing pure market structure, the most sustainable trends emerge from large, well-developed base structures that successfully absorb long-term selling pressure. Look at the comprehensive development displayed in Screenshot 2026-05-26 at 14.50.53.jpg. After a major high was established in mid-2024, the stock underwent an extensive corrective digestion cycle, cascading down into a deep washout zone near 350-375 in early 2025. This painful markdown completely flushed out weak retail participants. Instead of continuing lower, institutional accumulation stepped in to build a solid foundational floor, methodically guiding the stock back up the right side of the chart over several months to challenge major historical supply.
2. The Educational Setup: Dynamic Support and Resistance Clearance
To understand the technical validity behind this macro breakout, we look at the interaction between horizontal key levels and dynamic moving average structures:
The Critical Supply Barrier: The key level defining this macro base is the solid black horizontal resistance line drawn at 658.25. This boundary marks a major historical structural ceiling where intense selling pressure repeatedly capped upward expansion, making it the definitive line in the sand for a bullish trend reversal.
The 20 SMA Dynamic Cushion: Notice how cleanly the price action behaved during the recovery process. The stock established a clear series of higher lows, consistently utilizing the rising weekly 20 SMA (the middle blue line of your Bollinger Bands, currently sitting at 514.35) as a dynamic cushion. Defending this key moving average allowed the price to compress tightly against the 658.25 ceiling, building up immense kinetic energy before the eventual structural launch.
3. Current Price Action: Volatility Expansion and Markup Phase
Look at the most recent weekly candle on the far right of the chart. The structural pressure cooker has officially exploded. Institutional buyers have seized total control of the tape, printing a massive, full-bodied green expansion candle that has closed strong at 690.05 (+10.85%). This vertical thrust has decisively obliterated the 658.25 historical ceiling on an unmistakable institutional volume surge (visible in the towering cyan volume bars below). Furthermore, the price has violently pierced and is riding completely outside the upper Bollinger Band, confirming that the asset has officially transitioned out of low-volatility compression and into a high-volatility, explosive vertical markup phase.
4. The Trade Plan: Entries, Targets, and Risk Management
Entry Strategy: Macro momentum is exceptionally strong with the stock trading out in the open. Because the weekly candle is closing outside the upper Bollinger Band, chasing the price immediately carries a minor risk of a short-term, lower-timeframe mean-reversion pullback. The highest-probability, lowest-risk entry strategy involves waiting for a minor structural cooling-off period. Look to scale into long positions or place limit orders to catch a potential pullback to perfectly retest the broken 640.00 to 665.00 zone. Letting old historical resistance prove itself as concrete new support provides an unmatched risk-to-reward ratio.
Take Profit (Targets): We utilize classical structural measured moves based on the depth of the macro accumulation base. By taking the depth of the core structure (roughly 300 points from the ~350 dynamic floors up to the 658 breakout line) and projecting it upward, our primary structural macro target sits comfortably in the 940.00 to 960.00 zone. Near-term profit-taking milestones rest at the psychological round numbers of 750.00 and 850.00.
Invalidation (Stop Loss): An explosive breakout thesis is completely invalidated if the asset fails to hold its newly claimed support floor and collapses back inside the base boundaries. A hard stop loss should be placed safely below the weekly 20 SMA cushion and the mid-level structural pivot, specifically around the 490.00 to 520.00 level. A definitive weekly close completely back below 500.00 would act as a severe warning sign of a failed macro breakout and a major bull trap.
5. Time Horizon:
Because this technical setup is engineered on a 1-Week chart capturing a massive structural phase transition and an ultimate range breakout, this is a longer-term position trade designed to capture a secular markup trend over the coming months. Let the macro trend run!  Long
Long
XAUUSD 1H: Gold Recovers From SupportGold is trading around 4,327 on the 1-hour chart after showing a recovery from the lower price area.
The chart highlights two important levels:
- Support: 4,261.360
- Resistance: 4,403.030
Market Structure
Price has recently moved upward from the support region, creating a short-term recovery. However, the broader market remains between the marked support and resistance levels.
If buying interest continues, price may retest the resistance area. A rejection could lead to another pullback, while a sustained move above resistance would require confirmation from subsequent price action.
Key Points
Support: 4,261.360
Resistance: 4,403.030
Timeframe: 1H
This analysis is based on the displayed chart structure and is for educational purposes only. It is not financial advice. Market conditions can change, and no price movement is guaranteed.  Long
Long
SUDARSCHEM: Daily Inverse H&S Breakout1. The Macro Perspective: The Reversal Structure
I am taking a LONG bias on Sudarshan Chemical Industries Limited (SUDARSCHEM) on the daily (1D) timeframe.
When analyzing pure market structure, reversal patterns are critical to identifying shifts in major trends. Look at the structural development displayed on this chart. Following a painful and persistent markdown phase throughout late 2025 and early 2026, the stock carved out a deep structural bottom. Instead of a random V-shaped recovery, the stock systematically built out a textbook Inverse Head and Shoulders (H&S) pattern. This classic reversal structure visually maps the exact process of institutional accumulation, successfully transitioning the asset from a sequence of lower lows into a fresh structural uptrend.
2. The Educational Setup: The Inverse H&S and the Moving Averages
To understand the absolute technical validity behind this setup, look at the key components forming the reversal base:
The Pattern Construction: The chart perfectly defines the three foundational pillars of the reversal: a 'Left Shoulder', a deeper washout 'Head' marking the absolute floor near 741.15, and a higher-low 'Right Shoulder'. This higher low forming the right shoulder is the first major structural clue that selling pressure has completely exhausted and buyers are stepping in aggressively.
The Dynamic Cushion and Neckline: Notice how the price action behaved during the formation of the Right Shoulder. The stock decisively reclaimed the daily 20 SMA (the middle blue line of the Bollinger Bands, currently near 923.79), utilizing it as a dynamic launchpad. This rising support compressed the price action tightly against the solid black horizontal neckline at 978.60, which marks the absolute ceiling of the reversal pattern.
3. Current Price Action: Neckline Breakout and Volatility Expansion
Look at the most recent daily candles on the far right of the chart. The structural pressure cooker has exploded. Institutional buyers have stepped in with undeniable conviction, printing a massive, full-bodied green expansion candle that has surged out of the base, currently trading around 1,004.50. This vertical thrust has decisively obliterated the 978.60 neckline on an unmistakable volume surge (visible in the towering cyan volume bar below). Furthermore, the price has violently pierced the upper Bollinger Band, confirming a textbook shift out of accumulation and into a highly explosive, high-volatility markup trend.
4. The Trade Plan: Entries, Targets, and Risk Management
Entry Strategy: Momentum is exceptionally strong with the stock trading out in the open above the neckline. Chasing a vertical move immediately carries a short-term, lower-timeframe mean-reversion risk. The highest-probability, lowest-risk entry strategy involves waiting for a minor structural cooling-off period. Look to scale into long positions or place limit orders to catch a potential pullback to perfectly retest the broken 960.00 to 980.00 neckline zone. Letting old historical resistance prove itself as a concrete new support floor offers a phenomenal risk-to-reward ratio.
Take Profit (Targets): We use a classical measured move strategy based on the structural depth of the Inverse Head and Shoulders pattern. By taking the depth of the 'Head' (roughly 237 points from the 741.15 floor up to the 978.60 neckline) and projecting it upward from the breakout point, our primary structural target sits comfortably in the 1,200.00 to 1,220.00 zone. Intermediate profit-taking milestones rest near the psychological round numbers of 1,100.00 and 1,150.00.
Invalidation (Stop Loss): A structural reversal breakout thesis is completely invalidated if the price fails to hold its newly claimed neckline support and collapses back into the right shoulder. A hard stop loss should be placed safely below the daily 20 SMA and the mid-level of the Right Shoulder, specifically around the 880.00 to 900.00 level. A definitive daily close completely back below 860.00 would act as a severe warning sign of a failed reversal and a major bull trap.
5. Time Horizon:
Because this technical setup is built on a 1-Day chart capturing a classic structural reversal phase and a clear neckline breakout, this is a high-alpha swing trade designed to capture a rapid momentum markup phase over the coming weeks. Let the trend run!  Long
Long
SKYHYNXUSDT.P — 4H Long SetupBullish continuation setup from ascending trendline support.
📍 Entry: ~1,255
🎯 Target: ~1,625
🛑 Stop Loss: ~1,106
📈 Risk/Reward: ~2.5:1
Price is respecting the ascending trendline with multiple reactions. The setup targets the major resistance/supply zone around 1,620–1,640.
Key levels:
• 1,255 — Entry
• 1,625 — Target
• 1,106 — Stop Loss
• 1,140–1,160 — Key support zone
• 1,620–1,640 — Major resistance
⚠️ Technical setup only. Manage risk accordingly.  Long
Long
Nifty Intraday Outlook for 16-09-2026📊 **NIFTY 15-Min: Opening Recovery Inside a Broader Bearish Structure**
NIFTY opened higher near 23,203 and initially moved toward 23,281, but sellers appeared near the opening-range high.
Price is currently trading inside the 23,186–23,282 opening range, so confirmation is more important than predicting the next move.
---
📌 **Important Levels**
Resistance:
• 23,280
Upside Targets:
• 23,330
• 23,400
• 23,440
Support:
• 23,180
Downside Targets:
• 23,140
• 23,100
• 23,030
---
📉 **Bearish Plan**
If NIFTY rejects from 23,260–23,282:
• PE after bearish confirmation
• Prefer rejection + lower-high formation
• Targets: 23,225 / 23,185 / 23,125
Below 23,186:
• Stronger bearish continuation
• Prefer breakdown + failed reclaim
• Targets: 23,145 / 23,125 / 23,030
Do not chase PE after an extended candle directly into the first downside target.
---
📈 **Bullish Plan**
CE only after NIFTY breaks and sustains above 23,282.
Targets:
• 23,330
• 23,400
• 23,440
Above 23,330, the recovery structure improves, but the broader trend remains weak until the overhead moving-average supply is reclaimed.
A green opening alone is not enough — buyers need to break the opening-range high.
---
🌍 **Market Context**
Indian equities opened higher after NIFTY closed at a five-month low in the previous session.
Crude oil has eased slightly but remains extremely elevated near $108 amid continuing Middle East supply risks.
Global markets remain cautious ahead of today's Federal Reserve decision, with markets heavily pricing another US rate hike.
The rupee also remains under pressure from expensive crude and high global yields.
---
✅ **Final View**
Above 23,280 → short-covering continuation
Above 23,330 → recovery strengthens
Reject 23,260–23,280 → sellers retain the advantage
Below 23,185 → bearish continuation
Below 23,125 → downside momentum can accelerate
Inside 23,200–23,260 → WAIT
Educational analysis only. Trade with confirmation and disciplined risk management.
XAUUSD — 4,257 Hold or 4,214 Sweep?
Gold is trading around 4,273 after extending the M30 decline below yesterday’s reaction support.
Price remains under the descending trendline, while the latest recovery attempt failed to create a meaningful structure shift.
Macro pressure is also still heavy ahead of the Fed decision, with elevated yields, a firm dollar and higher oil prices keeping Gold under pressure.
But price is now moving closer to the lower reaction zones.
And this is where chasing the sell becomes less attractive.
The reaction is the signal.
The simple read
M30 structure remains bearish below the descending trendline.
The latest bounce reached the 4,31x area but failed below the major resistance zone around 4,319.
Price has now moved back below the 0.618 Fibonacci level near 4,277 and is approaching the 0.786 area around 4,267.
The first important support sits around 4,253–4,257.
This area combines the previous swing low, Fib completion and visible reaction demand.
A clean buyer response here could create a temporary recovery.
But support is not an automatic buy.
If 4,257 fails, the chart leaves room for a deeper liquidity sweep toward 4,214.
That lower zone aligns closely with the 1.618 Fibonacci extension and is the stronger downside reaction area on this M30 structure.
On the upside, 4,285 is the first small recovery test.
The bigger level is still 4,319.
This area combines resistance with the descending trendline and remains the key seller decision zone.
Key price zones
Current price area: 4,273
Immediate Fibonacci reaction: 4,267–4,277
Main support / buy reaction zone: 4,253–4,257
Deeper liquidity zone: around 4,214
First recovery resistance: around 4,285
Main resistance + trendline: around 4,319
Major upper supply: around 4,398
Trading plan
Buy reaction scenario
If Gold reaches 4,253–4,257:
I will watch for sellers to lose momentum and buyers to show a clear reaction.
A confirmed recovery can first reopen 4,277–4,285.
If price then breaks the descending trendline, 4,319 becomes the next important test.
But I will not buy simply because price touches support.
Sell reaction scenario
If Gold recovers toward 4,285 or especially 4,319 and rejects:
The bearish M30 structure can remain intact.
A failed recovery may send price back toward 4,257.
Breakout scenario
If Gold breaks the trendline and can hold above 4,319:
The short-term structure changes significantly.
That would improve the recovery case and shift attention toward the higher resistance zones.
Breakdown scenario
If 4,257 cannot hold:
I would watch for the deeper liquidity move rather than chase the breakdown.
The next major reaction zone becomes 4,214.
A sweep into that area followed by a strong reclaim could create a much cleaner recovery structure.
The trend is still bearish.
But price is getting closer to support.
4,257 is the first buyer test.
4,214 is the deeper liquidity test.
4,319 is the real recovery confirmation level. Long 
XAUUSD 4H: Wyckoff — Spring Test & Phase D PathAnalysis Type: Technical Analysis / Wyckoff Method
Timeframe: 4-Hour (4H)
Market Context & Structure
Following an aggressive markdown from the 4,700 high, XAUUSD has halted its downtrend and transitioned into a well-defined Wyckoff Trading Range (TR). The lower boundary is established at the 4,281 – 4,293 zone, with horizontal resistance capped at the Automatic Rally (AR) peak of 4,513.
Wyckoff Phase Breakdown
Phase A (Trend Halting): Initial stopping action occurred via a climactic sell-off (SC) down to 4,281, met by an immediate Automatic Rally (AR) to 4,513. The Secondary Test (ST) on Sep 04 confirmed supply absorption and established our TR boundaries.
Phase B (Cause Building): From Sep 07 to Sep 14, price traded horizontally within the range, absorbing remaining institutional floating supply (Law of Cause & Effect).
Phase C (The Spring): Price executed a terminal liquidity sweep below range support, tagging an extreme wick low at 4,253.63. The rapid recovery back above 4,293 marks this structure as a classic Type 2/3 Spring.
Phase D Transition (In Progress): A successful reclaim above 4,335 sets up the sign of strength (SOS) thrust into the interior of the range.
Key Price Levels to Track
Range Support (Spring Baseline): 4,281.48 – 4,293.88
Structural Invalidation (Stop/Failure): 4,253.63 (4H candle close below confirms redistribution)
Immediate Target (Mid-Range SOS): 4,400.00 – 4,420.00
Major Resistance (Range High / Creek): 4,513.72
Macro Expansion Target: 4,697.10
Execution & Invalidation Plan
Phase D Confirmation: Look for expanding tick volume as price drives through 4,350 toward 4,400.
LPS Entry Opportunity: If an SOS develops toward 4,400, wait for a low-volume, shallow retracement (Last Point of Support / LPS) holding above 4,300 before joining the leg toward the creek at 4,513.
Risk Management: Any high-volume 4-hour close below 4,253.63 completely invalidates the accumulation premise and shifts bias to downward continuation.
Disclaimer: This analysis is for educational purposes only and does not constitute financial advice. Always execute using proper risk-to-reward ratios and position sizing Long 
Long 
#NIFTY Intraday Support and Resistance Levels - 16/09/2026Nifty 50 is expected to open flat near the 23250 level. The index is currently trading below the important 23200–23,250 support zone, after witnessing selling pressure in the previous session. The opening around this zone makes it an important area to watch for the next directional move.
On the bullish side, if Nifty sustains above 23250, a recovery toward 23350, 23400 and 23450 can be seen. A sustained move above 23500 would indicate stronger buying momentum and could further improve the short-term structure.
On the bearish side, if the index fails to reclaim 23200 and sustains below this level, selling pressure may increase toward 23100, 23050 and 23000. The 23000 region is the next major support visible on the chart.
With a flat opening near 23250, traders should closely monitor the 23200–23250 zone. A clear breakout above resistance or breakdown below support can provide better confirmation for directional trades, while movement within this range may remain volatile and range-bound. Gold Pre-FOMC: Buy 4,275 or Short 4,380?
Market Overview
• Macro Driver: Spot Gold hovers near $4,312 on Tuesday, September 15, 2026, finding localized support following Monday's sharp liquidation down to the $4,265 floor. Global markets enter the pivotal two-day Federal Open Market Committee (FOMC) meeting starting today, alongside US economic catalysts including the Empire State Manufacturing Index. With institutional desks locked in pre-decision rebalancing, smart money is positioning for tomorrow's headline interest rate announcement (consensus: steady at 3.50%–3.75%) and updated Summary of Economic Projections (SEP).
• Market Condition: Institutional order flow shows an active re-accumulation delivery within a descending structure. Following the sweep of sell-side liquidity into the 4,250 – 4,265 Demand Zone, price executed a strong buy-side rejection, preparing for a corrective relief expansion toward overhead trendline supply.
Technical Context
• Structure: Descending Channel Compression & Demand Absorption. On the 1H timeframe, Gold remains contained beneath the Bearish Descending Channel trendline originating from the 4,511.089 Strong High. After testing the 4,250–4,265 Demand Zone, price confirmed local absorption and printed an initial displacement back above 4,300.
• Liquidity & Imbalance: Price is currently hovering at 4,312.38. The institutional projection indicates an intraday corrective dip toward the 4,270 – 4,285 demand mitigation pivot to build fuel, followed by an aggressive expansion leg breaking through local hurdles to test the Intermediate Supply Block (4,375.00 – 4,390.00) and challenge the Bearish Descending Channel ceiling.
Key Zones
• Macro Structural Ceiling (Strong High): 4,511.08
• Upper Supply Block: 4,430.00 – 4,445.00
• Intermediate Supply Target (Blue Box): 4,375.00 – 4,390.00
• Current Market Price: 4,312.38
• Demand Zone Base (Grey Box): 4,250.00 – 4,265.00
Trading Plan (IF–THEN)
• IF price delivers a minor corrective pullback into the 4,275 – 4,285 area AND validates lower-timeframe (M5/M15) bullish displacement/CHoCH -> THEN look to execute Long positions, targeting 4,330 and expanding toward the 4,375.00 – 4,390.000 Intermediate Supply / trendline resistance.
• IF price invalidates the demand base by printing a decisive 1H candle close below 4,250 -> THEN the pre-FOMC relief expansion is postponed, exposing the 4,220 macro liquidity shelf.
MMFLOW View
• Bias: Demand Absorption / Corrective Bullish Expansion. Selling the bottom of the descending channel ahead of the FOMC meeting carries poor risk-to-reward; the mathematical edge favors trading the confirmed demand bounce into premium supply arrays.
Are you buying the demand zone bounce toward 4,380 ahead of FOMC, or waiting to short the channel trendline? Long 
 Long
Long
H4 Recovery From Lower Structural Support
XAUUSD is trading around 4,297 after extending the bearish H4 sequence into the lower part of the current structure. Price remains below the descending resistance trendline, so the broader bias is still defensive, but the market is approaching an area where a corrective recovery may develop.
The macro environment remains difficult for gold. The Fed begins its September meeting today, with a 25 bp hike widely expected after hotter inflation data. Gold has fallen to a fresh one-month low, while Brent has surged above $108 and the U.S. 10-year Treasury yield has traded around 5%, reinforcing inflation and higher-rate pressure on non-yielding gold.
Technical View
The H4 structure remains bearish after consecutive BOS signals and continued rejection beneath the descending resistance trendline.
Price is now trading close to the lower structural area around 4,225–4,260. Although the chart labels this lower box differently, technically it is the main reaction/support area for the projected recovery path.
A liquidity sweep into this region followed by bullish rejection, H4 reclaim or MSS confirmation could trigger a corrective rebound.
The first meaningful upside objective is the 4,405–4,440 Recovery Resistance zone.
If buyers regain acceptance above this structure, the next recovery target sits at 4,525–4,560 OB / Key Resistance.
The higher 4,640–4,665 area remains a larger HTF objective, but it should not be assumed reachable while the broader descending structure remains intact.
Key Zones
Current Price: 4,297
Lower Structural Support: 4,225–4,260
Recovery Resistance: 4,405–4,440
OB / Key Resistance: 4,525–4,560
Upper HTF Zone: 4,640–4,665
Major Swing High: 4,699.106
Trading Plan
Buy Priority: 4,225–4,260
Condition: wait for an H4 liquidity sweep followed by bullish rejection, reclaim, MSS or clear higher-low confirmation.
TP1: 4,405–4,440
TP2: 4,525–4,560
Invalidation: sustained H4 acceptance below 4,225 would weaken the recovery setup.
Buy/Sell View
This is a counter-trend recovery plan, not confirmation that the H4 downtrend has ended.
With the Fed decision approaching and rate-hike expectations extremely elevated, buying blindly around current price offers poor confirmation. The cleaner setup is to let price test lower structural support and show that sellers are losing control first.
If 4,225–4,260 fails, the bullish recovery thesis should be reassessed rather than forcing a long position.
Final View
Gold remains under strong macro and technical pressure ahead of the Fed, but H4 is approaching an important lower reaction area after an extended decline.
The main scenario is a liquidity sweep into 4,225–4,260 followed by confirmed recovery, targeting 4,405–4,440 first and 4,525–4,560 if momentum strengthens.
The Fed decision and guidance will likely determine whether this lower H4 structure can produce a genuine recovery or simply another temporary bounce. Long 
Nifty50 analysis(16/9/2026).HOPE YOU HAVE A GREAT DAY.
CPR: lower value cpr : sideways to bearish
FII: -2,977.86 sold
DII: 2,686.05 bought.
Highest OI: Too soon to tell.
CALL OI:
PUT OI:
Resistance: - 23300
Support : - 23000
conclusion:.
My pov
1.Almost neutral around 23200 , today expected to be sideways to bearish due to cpr , so market expected to trade between 23300 to 23000.
2. MA line seems slope down, we are in bearish market ,price breakout 23300 but this breakout can be a fake out so wait for confirmation and trade.
3.it can consolidate and close above 23300 or if breakout was confirmed then we can except 23000.
Psychology:
“Patience is bitter, but its fruit is sweet.”
― Aristotle
note:
My point of view is fully towards technical not news driven , if global news affects the market my pov can be totally wrong.
8moving average ling is blue colour.
20moving average line is green colour
50moving average line is red colour.
200moving average line is black colour.
cpr is for trend analysis.
MA line is for support and resistance.
Disclaimer:
Iam not Sebi registered so i started this as a hobby, please do your own analysis, any profit/loss you gained is not my concern. I can be wrong please do not take it seriously thank you.+
XAUUSD — Mitigation Sell Before FOMC
Market Context
Gold is trading near $4,293 after extending deeper into the lower half of the H1 descending channel. Price continues to print lower highs beneath HTF dynamic supply, keeping short-term order flow bearish despite the latest corrective rebounds.
Macro conditions remain restrictive for Gold ahead of the September 15–16 FOMC meeting. Markets are heavily positioned for a 25 bp Fed hike, while the U.S. dollar is near a two-week high and the 10-year Treasury yield has moved above 5%. At the same time, renewed Middle East tensions have pushed Brent crude above $106, reinforcing inflation concerns and supporting higher-rate expectations.
SMC View
H1 structure remains bearish inside the descending delivery channel. Price has repeatedly failed to sustain recovery above the internal structure, while the latest MSS keeps lower sell-side liquidity exposed.
The immediate $4,308–$4,325 Mitigation POI is the most important decision area. A corrective retracement into this zone could rebalance the latest downside displacement before sellers attempt another continuation lower.
The current price is already close to discount, so chasing shorts near $4,290 offers weaker positioning. The cleaner setup is a mitigation rally followed by fresh bearish confirmation.
Main Trading Scenario
Sell Priority: $4,308–$4,325
Condition: Wait for price to retrace into the Mitigation POI and show bearish rejection, failed acceptance above the zone, or a lower-timeframe bearish MSS/CHOCH.
Entry: $4,308–$4,325 after confirmation
SL: Above $4,340 and the rejection structure
TP1: $4,270–$4,280
TP2: $4,250–$4,260
TP3: $4,220–$4,235
Key Zones to Watch
$4,400.899 — Premium Bearish OB
$4,308–$4,325 — Main Mitigation POI
$4,255–$4,270 — Discount POI
$4,220–$4,235 — Deep SSL Objective
$4,280 area — Nearby sell-side liquidity
Above $4,340 — Immediate bearish setup weakens
Prime Gold View
The sell bias remains favored while XAUUSD stays beneath the Mitigation POI and continues respecting the H1 descending channel.
A confirmed rejection from $4,308–$4,325 could reopen delivery toward the Discount POI and eventually the $4,220–$4,235 Deep SSL Objective. With the Fed decision approaching and rate-hike expectations already elevated, volatility may increase sharply, so confirmation remains more important than anticipating the move.
No confirmation, no trade. Short 
XAUUSD: Don’t Mistake This Rebound for a ReversalXAUUSD is still trading in a clear bearish trend , with both the macro backdrop and technical structure continuing to favor sellers.
From a macro perspective, gold remains under pressure as persistent U.S. inflation has strengthened expectations of tighter Fed policy , while elevated Treasury yields and a firm U.S. dollar continue to work against the metal. With the Fed decision approaching, the market remains sensitive to any signal that interest rates could stay higher for longer — an environment that remains challenging for non-yielding assets like gold.
Technically, XAUUSD continues to trade inside a descending channel on the H1 timeframe . The pattern of lower highs and lower lows remains intact, while price is still below the Ichimoku Cloud. This tells me that the recent bounce is a correction within the downtrend, not yet a reversal of it .
The 4,305–4,330 area is the key zone to watch. If price rebounds into this region but fails to break through the descending structure, sellers could regain control and push XAUUSD toward 4,205 . Until the channel is decisively broken, I remain focused on SELL opportunities during rebounds rather than trying to catch the bottom. Short 
XAU/USD - Defends the Floor, Breakout Away From 4.500OANDA:XAUUSD is sitting inside the 4,280–4,350 buy zone, where buyers have already defended the lower boundary several times. Price is also compressing between the rising support line and the descending trendline, creating a clear decision area.
The bullish setup only becomes convincing if Gold can hold above 4,280 and break the descending trendline around 4,350–4,370. If that happens, the recovery could extend toward:
🎯 Target: 4,500
A sustained break below 4,280 would invalidate the recovery setup.
AURICVERSE View: support is holding, but macro still favors caution. I want to see 4,280 hold + a clean trendline breakout before treating 4,500 as the next serious upside target. Long 
BTCUSDT: Buy Zone Holding Firm, Path to 80.5K Remains OpenBTCUSDT is trading around 77,065 USDT following a pullback from a rally that neared 79,200. The price is currently entering the 76,300–76,800 "Buy Zone," an area that also serves as support near the lows of the short-term structure.
From a technical standpoint, this is the zone where I would like to see a reaction from buyers. If BTC holds the 76,300–76,800 level and subsequently reclaims the EMA cluster around 77,700–77,900, the likelihood of a return to the 79,000–79,300 range increases. A decisive breakout above this area could pave the way toward the primary target of around 80,500 USDT.
The bullish scenario would weaken if BTC breaks decisively below 76,300.
Will BTC hold the Buy Zone and rally back to 80.5K?  Long
Long