Professional BTC/USD Technical AnalysisMarket Structure Overview
The BTC/USD 45-minute chart shows a strong bullish expansion from the $75,500–$76,200 demand zone. After forming a base and producing a market-structure break, Bitcoin developed a sequence of higher highs and higher lows, eventually accelerating above the $78,000 area.
The strongest move occurred around the $78,000 level, where price broke sharply higher and advanced toward the $81,500–$82,000 resistance region. This confirms strong short-term buying momentum, although the latest price action suggests that the market is becoming vulnerable to a pullback after the extended rally.
Key Resistance Zone
The immediate resistance is around $81,800–$82,200. Price is approaching this area after a strong impulsive advance, and the chart already shows signs of hesitation near the upper boundary.
A rejection from this zone could trigger profit-taking and a short-term corrective move toward lower intraday support.
Support and Demand
The most important structural demand zone is located around $75,500–$76,200. This area previously acted as an accumulation/base zone and was followed by the latest major bullish expansion.
For the current trend, the nearer support levels around $80,800–$81,200 should be monitored first. Holding above these levels would keep the short-term bullish structure intact, while a deeper retracement could bring price back toward the $78,000 breakout region.
Potential Price Scenario
If BTC continues to hold above the recent breakout structure, another test of $82,000 is possible. However, a clear rejection around $81,800–$82,200 could lead to a corrective pullback as traders lock in profits.
The chart's projected path suggests a potential final push toward the $82,000 area followed by a take-profit/pullback phase.
Confirmation
Bullish continuation would be supported by a clean 45-minute close above $82,000 followed by successful support confirmation.
A bearish short-term scenario would become more relevant after a strong rejection from resistance combined with a break below the latest higher-low structure.
Overall Structure
BTC/USD remains structurally bullish on the 45-minute timeframe, with strong momentum following the breakout from the $75,500–$76,200 demand area. At the same time, price is now extended near major resistance, making rejection and profit-taking risks increasingly important.
Key levels:
* Resistance: $81,800–$82,200
* Near-term support: $80,800–$81,200
* Breakout support: around $78,000
* Major demand: $75,500–$76,200  Short
Short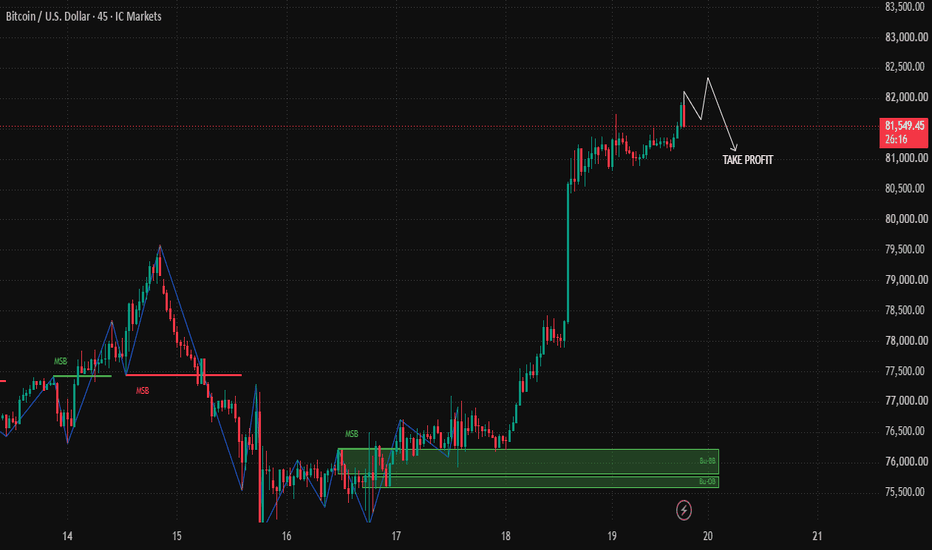
 Long
Long
XAUUSD: 4,238 Holds the Bigger Recovery Map XAUUSD: 4,238 Holds the Bigger Recovery Map
Market Context
Gold is trying to build a larger recovery after reacting from the strong liquidity base near 3,941.
The daily chart is no longer showing only one-way bearish pressure. Price has formed a clear recovery leg, reclaimed important structure, and is now holding above the previous accumulation zone. However, the market is still not fully bullish until buyers clear the next liquidity barrier above.
The current price around 4,378 is sitting between recovery support and the next premium resistance area. This means gold may need one more pullback before the next strong upside attempt.
Technical Structure
The main story is simple: gold has shifted from deep discount recovery into a potential bullish continuation structure.
The first important support is 4,238. This is the nearest liquidity and reaction level. If price pulls back and holds this area, buyers may use it as the base for the next push higher.
Below that, 4,163 is another key support and FVG liquidity zone. Losing 4,163 would weaken the recovery structure and may bring price back toward the OB Buy Zone around 4,050 - 4,100.
Above current price, 4,511 is the first major buy-side liquidity target. A clean break above this level would confirm that buyers are regaining control.
The next upside levels are 4,698, then 4,889. If gold continues to expand strongly, the higher OB zone around 5,100 - 5,200 becomes the larger premium target.
Key Levels
Current Price: 4,378
Nearest Support: 4,238
FVG / Strong Liquidity Support: 4,163
OB Buy Zone: 4,050 - 4,100
Buy-Side Liquidity: 4,511
Month High: 4,698
Strong Liquidity Target: 4,889
Higher Premium OB: 5,100 - 5,200
Major Liquidity Reference: 5,600
Trading Plan
Primary Buy Scenario
Entry: 4,238 - 4,163 after bullish confirmation
SL: Below 4,100
TP: 4,511 / 4,698 / 4,889
Condition: Gold pulls back into the support zone, holds structure, and forms a clear bullish reaction. This would suggest buyers are defending the recovery base.
Breakout Buy Scenario
Entry: Above 4,511 after breakout and retest
SL: Below 4,380
TP: 4,698 / 4,889 / 5,100
Condition: Price breaks above the buy-side liquidity zone and holds above it. This would confirm stronger bullish continuation.
Alternative Sell Scenario
Entry: Below 4,163 after breakdown and retest
SL: Above 4,238
TP: 4,100 / 4,050 / 3,941
Condition: Gold loses the FVG support and fails to reclaim it. This would show that buyers are losing the recovery structure.
Overall Bias
Gold is recovering, but the next move depends on how price reacts around 4,238 - 4,163.
As long as this zone holds, the bigger recovery map remains valid, with upside targets at 4,511, 4,698, and 4,889.
If price breaks below 4,163, the recovery weakens and gold may return to the deeper OB Buy Zone.
Best approach: wait for confirmation around support. Do not chase the middle. The cleanest setup comes from either a pullback into 4,238 - 4,163 or a breakout above 4,511.
Will gold defend the recovery base and continue higher, or will sellers drag price back into deeper demand?
Long 
 Long
Long
 Education

XAUUSD — Bullish Pullback Toward H1 SupportMarket Pulse
Gold ended the week on firmer footing, helped by easing oil prices that reduced some inflation pressure. The metal posted its first weekly gain in four weeks. However, the U.S. dollar remains firm and markets still see roughly a 55% chance of another Fed hike in October, so the macro picture is supportive but not fully bullish.
What the Chart Says
XAUUSD still shows a constructive H1 recovery after the strong rebound from the lower demand area.
Price reached the 4,390–4,400 region, then started to pull back. This is normal after the recent bullish expansion.
The main area I am watching is 4,325–4,345. This zone combines previous structure, Fibonacci support and the rising trend area.
If buyers defend this zone, Gold could build another higher low and recover toward the recent highs.
The first upside test remains around 4,390–4,400. A clean breakout above this resistance could open the way for a stronger continuation.
Levels That Matter
4,398–4,410 — Main resistance
4,370–4,380 — Current structure
4,325–4,345 — Main pullback / support zone
4,235–4,245 — Major demand zone
My Main Plan
The main plan remains bullish.
I prefer waiting for a controlled pullback toward 4,325–4,345 instead of chasing price near the highs.
If buyers return with clear confirmation, Gold could recover toward 4,390–4,400 again.
What I Need to See
I want the pullback to hold above the main support zone and form another higher low.
A sustained H1 break below 4,325 would weaken the immediate bullish continuation setup.
Final Read
The H1 recovery remains constructive, but Gold is still trading below an important resistance area.
For now, I prefer waiting for the pullback and bullish confirmation before following the next move higher. Long 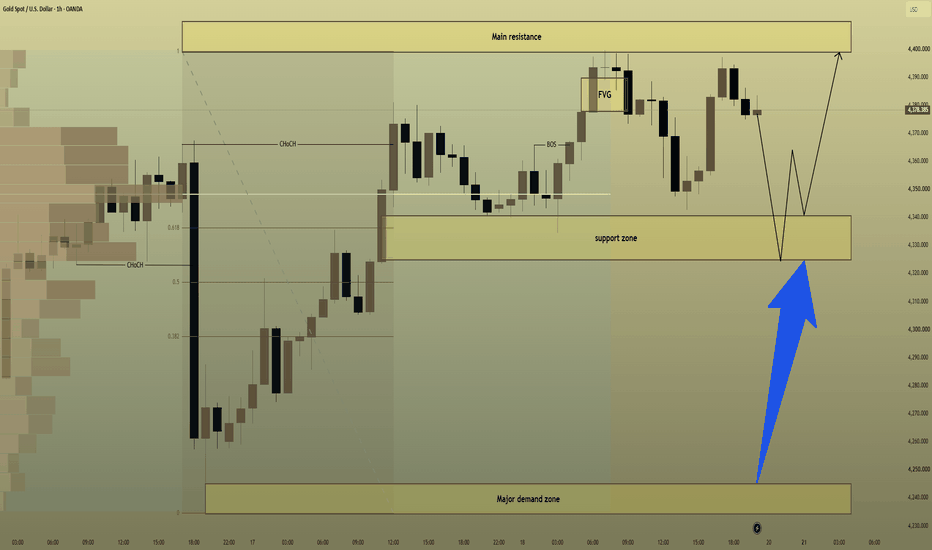
XAUUSD — Trendline Breakout, Buy the RetestMarket Context
Gold is trading around $4,394 after extending the post-FOMC recovery and breaking above the descending H1 trendline. The latest expansion has already produced a bullish BOS, showing that short-term order flow is shifting away from the previous bearish delivery structure.
The macro backdrop has also improved for Gold in the near term. Gold rebounded more than 2% on Thursday as the U.S. dollar and Treasury yields retreated from their post-Fed highs, while easing oil prices reduced some immediate inflation pressure. The U.S. 10-year yield has since stabilized near 4.94%, and Brent has eased toward $103–104. However, the Fed’s recent 25 bp hike and its signal that further tightening remains possible still limit the strength of the broader bullish case.
SMC View
The key technical development is the breakout above the descending trendline, followed by bullish BOS around the $4,390 area.
Buy-side liquidity around the previous internal highs has already been taken, confirming displacement through the former resistance structure. The cleaner continuation setup is therefore not to chase the current expansion, but to wait for price to retrace into the broken trendline and rebalance before looking for another bullish leg.
The $4,320–$4,340 Retest Trendline zone is the main bullish POI. If this area holds and produces a bullish MSS or CHOCH, the next liquidity draw sits above current price.
Main Trading Scenario
Buy Priority: $4,320–$4,340
Condition: Wait for Gold to retrace into the broken trendline / retest zone and show clear bullish rejection. A lower-timeframe bullish MSS or CHOCH should confirm that buyers are defending the new structure.
Entry: $4,320–$4,340 after confirmation
SL: Below $4,305 and the retest structure
TP1: $4,425–$4,440
TP2: $4,478–$4,495
Key Zones to Watch
$4,390–$4,400 — Bullish BOS / current resistance
$4,425–$4,440 — External BSL / secondary target
$4,478–$4,495 — Premium BSL / major upside draw
$4,320–$4,340 — Main trendline retest POI
Below $4,305 — Immediate bullish setup weakens
Prime Gold View
The H1 structure has improved materially after the trendline breakout and bullish BOS, but price is already trading close to short-term resistance.
The higher-quality buy remains a controlled retracement into $4,320–$4,340, followed by bullish confirmation. If buyers protect that structure, Gold could continue toward $4,425–$4,440 first, with the larger $4,478–$4,495 Premium BSL remaining the main upside liquidity objective.
No confirmation, no trade. Long 
 Education



Global Financial MarketsGlobal financial markets are systems where people, companies, and governments buy and sell financial assets across the world. They help move money from those who have extra funds to those who need funds.
Main Types of Global Financial Markets:
Stock Markets – Buying and selling shares of companies (e.g., NYSE, NSE).
Bond Markets – Governments and companies borrow money by issuing bonds.
Foreign Exchange (Forex) Markets – Trading currencies like USD, EUR, INR.
Commodity Markets – Trading gold, oil, wheat, etc.
Money Markets – Short-term borrowing and lending.
Derivatives Markets – Contracts based on assets like stocks or currencies.
Importance:
Provide funds for business growth
Support international trade
Create investment opportunities
Help manage financial risks
Affect global economies
Example:
If the US stock market falls sharply, markets in Asia and Europe may also be affected because markets are connected globally.
 Education

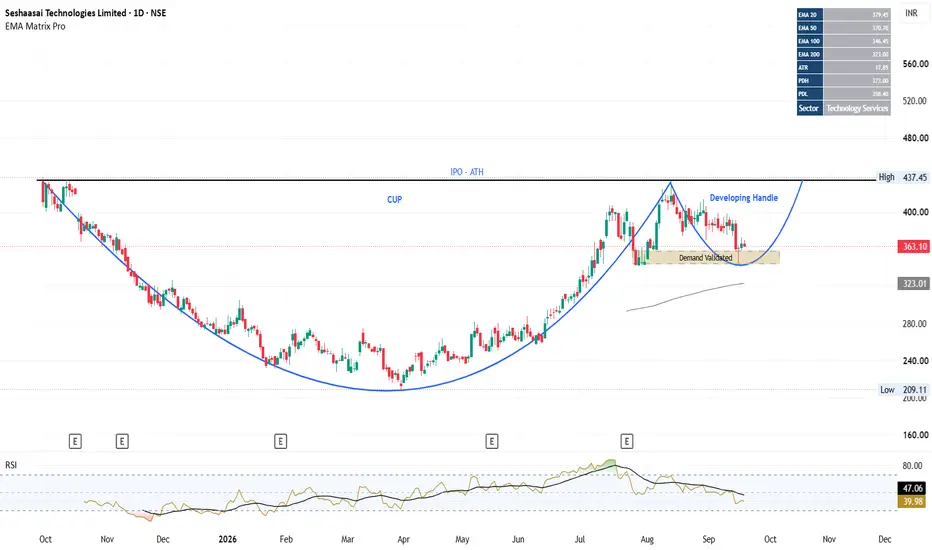
STYL : Cup & Handle Taking Shape — Demand Zone HoldsSeshaasai Technologies Ltd. NSE:STYL is developing an interesting Cup & Handle structure on the daily chart, with the handle currently testing an important demand/confluence area.
Key Observations :
1. Cup formation: After the post-listing decline, price formed a broad base and recovered toward the IPO/major high zone around ₹433–437, completing the larger cup structure.
2. Supply reaction: The first attempt near the previous high was rejected, followed by another pullback. This indicates that the ₹433–437 area remains the major supply/resistance zone.
3. Handle development: The subsequent decline has so far held the ₹343–358 demand zone, which is close to the lower portion of the developing handle.
4. EMA confluence: The demand area is supported by the 100 EMA around ₹346.5, while the 50 EMA around ₹370.8 is currently acting as an intermediate dynamic level.
5. Momentum: RSI has cooled from the previous overbought region and is now around the neutral zone. This gives the handle room to develop without the stock remaining excessively extended.
Trade Plan:
Trigger:
A sustained move above ₹394 and RSI above 50 can be treated as a confirmation of the developing handle breakout / short-term structure reversal.
Upside levels:
₹437–438: Major resistance / previous high
Above ₹437–438: price discovery becomes possible, subject to breakout strength and volume.
Invalidation:
A decisive breakdown below the ₹343–358 demand zone, particularly a daily close below the lower boundary, would weaken the current Cup & Handle thesis.
Risk management:
Rather than entering solely because price is inside the demand zone, the cleaner setup is to wait for price confirmation above ₹394, preferably accompanied by expanding volume. Position size should be calculated according to the predefined risk per trade.
Important technical distinction:
₹394 does not validate the demand zone itself. It validates the handle/recovery structure. The demand-zone thesis is already supported by the reaction from ₹343–358; ₹394 is the potential confirmation trigger.
------------------------------------------------------------------------------------------------------------
Disclaimer: This is a personal technical-market observation for educational/informational purposes and is not investment advice. I am not a SEBI-registered investment adviser/research analyst. Please conduct your own research and manage risk according to your individual circumstances.  Long
Long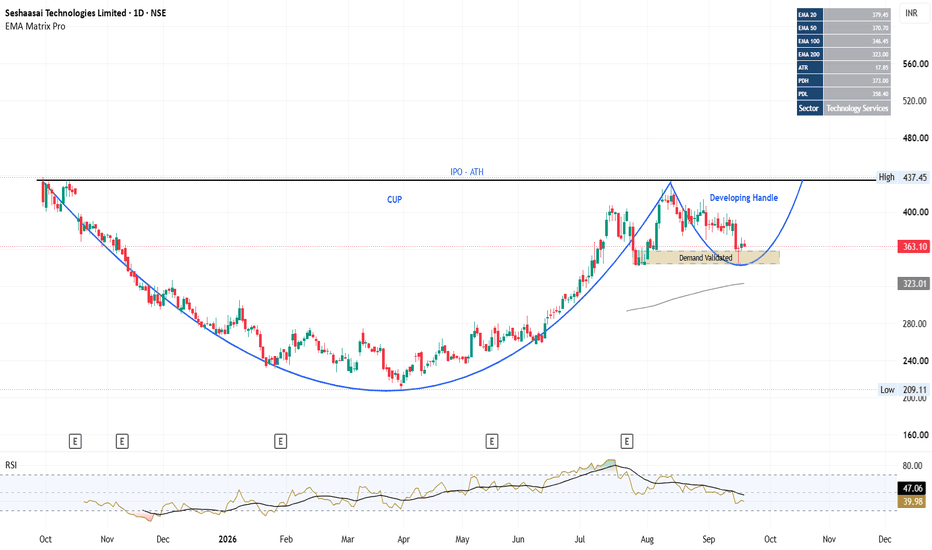
H1 Major Supply Rejection Toward Lower Liquidity
XAUUSD is trading around 4,378 after extending its recovery from the lower H1 structure. Price has returned directly into the 4,385–4,405 Major Supply Zone, where the broader bearish trendline also remains relevant.
Gold reached a one-week high on Friday as easing crude oil prices reduced part of the inflation pressure that had dominated markets earlier in the week. Spot gold climbed about 1.2%, while softer energy prices helped Treasury yields retreat from their recent highs.
However, the broader macro backdrop remains restrictive. The Fed has raised rates to 3.75%–4.00% and still expects further tightening, while markets currently price roughly a 55% probability of another hike in October. The dollar also remains near a seven-week high, and the U.S. 10-year yield has recently traded above 5%, limiting the strength of gold’s recovery.
Technical View
The H1 recovery has improved after the recent MSS and rebound from lower demand, but price is now entering the main decision area.
The 4,385–4,405 Major Supply Zone aligns with the previous bearish trendline and recent swing structure. This makes the current area less attractive for chasing longs.
A rejection or failed acceptance above this supply could trigger a corrective move back toward the 4,335–4,350 Demand Zone.
If that demand fails to absorb selling pressure, the larger downside objective sits around 4,270–4,290, where the marked downside target and previous liquidity structure align.
Below that, the 4,235–4,250 Major Demand / SSL Zone remains the deeper structural support.
Key Zones
Current Price: 4,378.385
Major Supply / Sell Area: 4,385–4,405
Demand Zone: 4,335–4,350
Downside Target: 4,270–4,290
Major Demand / SSL: 4,235–4,250
Bearish invalidation: sustained H1 acceptance above 4,410–4,420
Trading Plan
Sell Priority: 4,385–4,405
Condition: wait for price to retest Major Supply and show bearish rejection, liquidity sweep, failed acceptance or lower-high confirmation.
TP1: 4,335–4,350
TP2: 4,270–4,290
TP3: 4,235–4,250
Invalidation: sustained H1 acceptance above 4,420.
Sell View
The cleaner approach is to avoid selling aggressively below current price after the recent recovery.
I prefer to let gold test 4,385–4,405 first. If sellers clearly defend the zone, the risk/reward improves for a rotation back toward demand.
A clean H1 breakout and acceptance above 4,420 would weaken the immediate bearish scenario and require reassessment.
Important Note
Lower oil prices are helping gold recover in the short term, but the Fed’s renewed tightening cycle, a strong dollar and elevated Treasury yields remain important headwinds. This creates a two-sided environment where liquidity sweeps around resistance may be aggressive.
Final View
Gold has recovered strongly, but H1 is now testing a key supply area rather than trading from clean demand.
The main scenario is a retest and rejection from 4,385–4,405, followed by a move toward 4,335–4,350 first and potentially 4,270–4,290 if bearish momentum expands.
Will H1 Major Supply stop the recovery before gold rotates back toward lower liquidity? Short 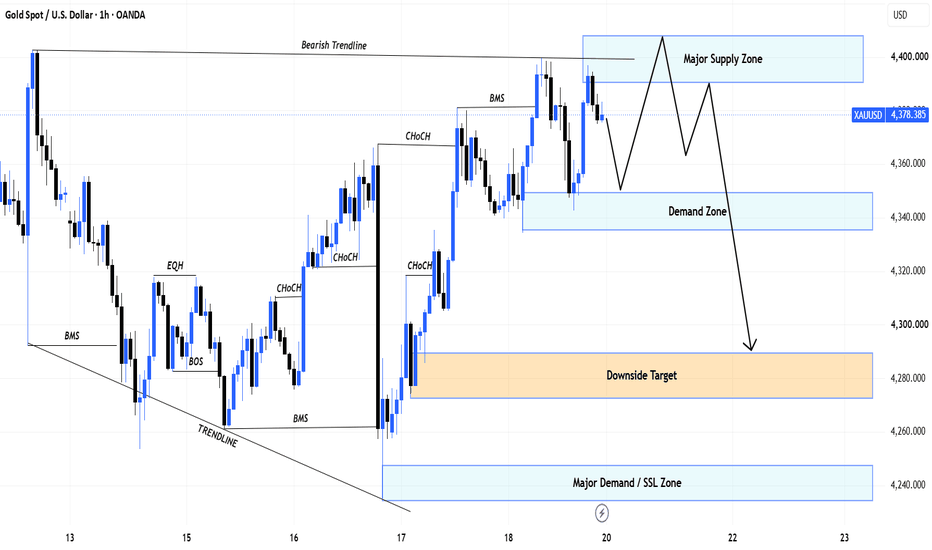
BSL Rejection Opens Corrective Move
Fundamental Analysis
Gold remains supported by softer oil prices and easing Treasury yields after the Fed’s latest rate hike. However, the Fed has signaled that further tightening is still possible, so Gold may remain sensitive to changes in yields, the dollar and energy prices.
Technical Analysis
On H1, Gold confirmed a bullish BOS and pushed into the 4,390–4,405 BSL, where price is now showing rejection.
This makes a short-term correction more likely. The first support sits around 4,350–4,367 OB + Fibo. If sellers break this zone, price could extend toward the 4,300–4,318 POC.
Important Key Levels
4,390–4,405 — BSL / Major Resistance
4,350–4,367 — OB + Fibo
4,300–4,318 — POC
4,235–4,250 — SSL / Major Support
Trading Scenario
Sell priority remains after rejection from 4,390–4,405.
Target: 4,350–4,367 first, then 4,300–4,318 if support fails.
Invalidation: H1 acceptance above 4,405.
Overall View
Gold has reached major upper liquidity after a strong recovery. The cleaner setup now is to watch for a corrective move toward lower support rather than chase buys near resistance.
Will Gold hold the OB + Fibo, or correct deeper toward the POC? Short 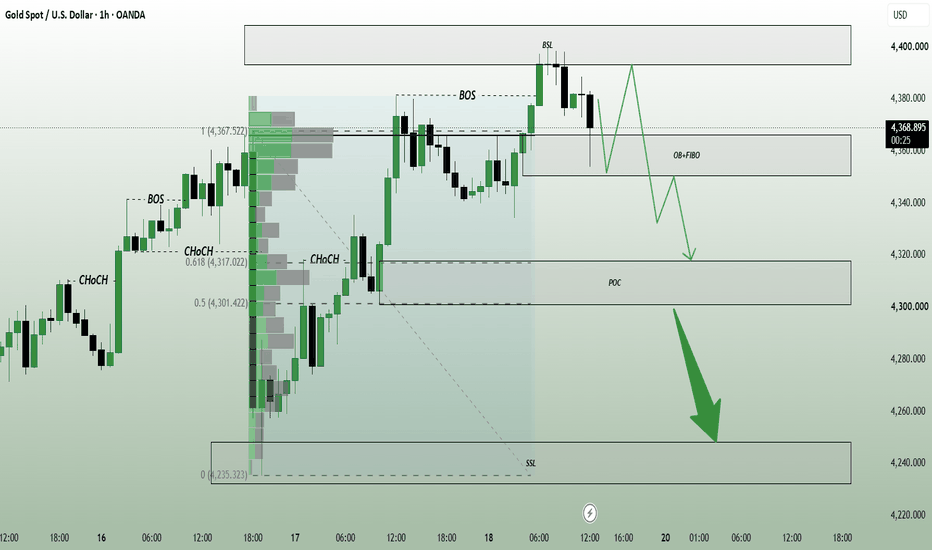
Long 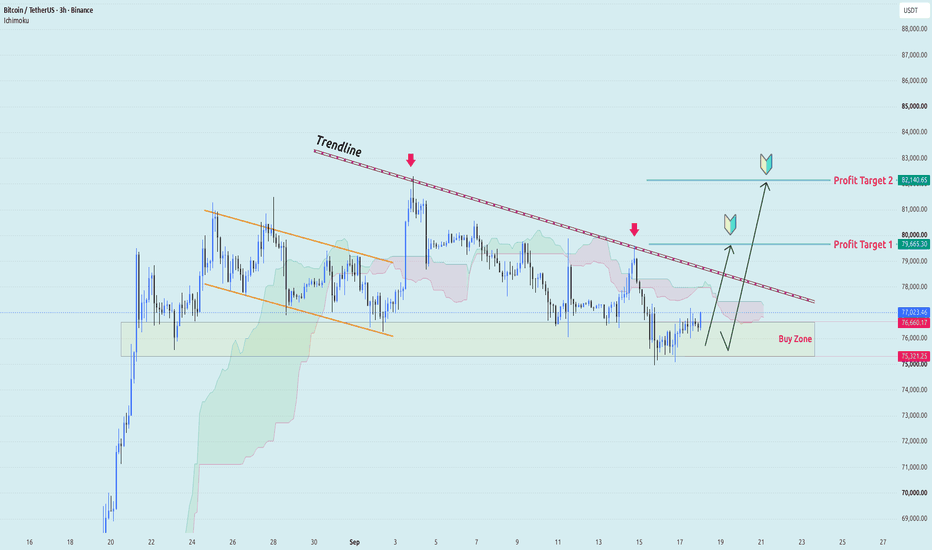
BTCUSDT: Breaking Out Wave Price ChannelBTCUSDT is trading around 77,830 USDT following a positive reaction from the 75,000–76,500 zone. The price has reclaimed the EMA34 (near 77,300) and is holding above the EMA89 (near 75,940), signaling a gradual return of buying pressure on the H8 timeframe.
The 78,500–79,500 zone represents a critical test, as it converges with the upper boundary of the descending channel. If BTC breaks out and sustains its position above this area, I lean towards a scenario where the price extends to 81,000–82,000 before targeting the key level around 84,400 USDT.
Macroeconomic factors today also provide mild support for a recovery scenario. Brent crude has fallen by approximately 2% and the 10-year Treasury yield has retreated to around 4.94%, while Asian stock markets have rallied strongly; these factors are helping to improve risk-on sentiment following a period of volatility driven by monetary policy concerns and Middle East tensions.
The bullish scenario would weaken if BTC falls back below the 75,000–75,500 level and closes the H8 candle below this "Buy Zone."
Will BTC break the descending channel to pave the way to 84.4K? Long 
ETHUSDT 4H | Bullish Fair Value Gap Retest Setup
ETH has broken out of a descending trendline and is showing signs of bullish market structure on the 4H timeframe. After a strong impulsive move, price is approaching a key Fair Value Gap (FVG) that could act as support on a retracement.
The plan is to wait for a pullback into the FVG around the 2,525-2,550 region and look for bullish confirmation before entering. This area aligns with the breakout structure and could provide a favorable risk-to-reward opportunity.
If buyers defend the imbalance, the next upside objective is the higher-timeframe FVG near 2,720-2,750. A break and close below the FVG would invalidate the setup and increase the likelihood of a deeper retracement toward range support.
Trade Idea ✅ Bias: Bullish
✅ Entry: FVG Retest (2,525-2,550)
✅ Target: 2,720-2,750
✅ Risk Management: Stop below FVG support
✅ R:R: Approximately 1:3+
This analysis is based on price action, market structure, liquidity, and Fair Value Gap concepts. Always wait for confirmation and manage risk accordingly.
#ETH #ETHUSDT #Ethereum #Crypto #TradingView #PriceAction #FairValueGap #FVG #SMC #SmartMoney #MarketStructure #Bullish #Breakout #SwingTrading #TechnicalAnalysis #Binance #CryptoTrading #LongSetup #Liquidity #Altcoins  Long
Long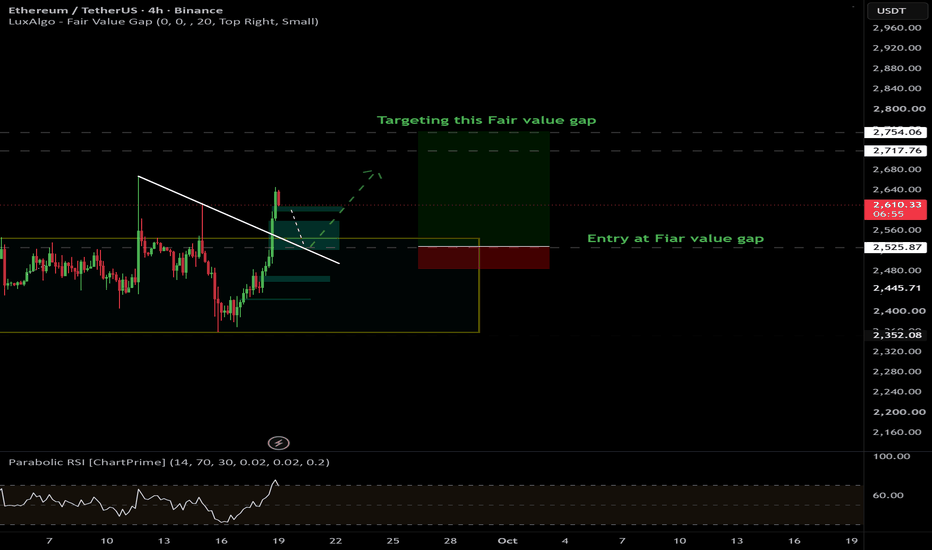
Education

Short