Long
Long
Long 
VAL: The High-Level Washing Machine and Explosive Box Breakout1. The Macro Perspective: The Thrust and The Digestion
I am taking a LONG bias on Valaris Limited (VAL) on the daily (1D) timeframe.
When analyzing pure market structure, massive momentum runs require massive digestion phases. Look at the structural development on the left side of this chart. After establishing a foundational floor, the stock experienced a violent, gap-up momentum thrust, surging vertically from the 70s all the way past 100. Naturally, that kind of parabolic move causes extreme exhaustion. However, look at what happened next. Instead of suffering a catastrophic, deep correction that wiped out the gains, institutional buyers aggressively defended the structure. They established a massive, high-level horizontal consolidation zone (the shaded Box). For months, the price chopped violently between the ~88.00 floor and the ~104.00 ceiling. This sideways action acts as a "washing machine"—it frustrates impatient retail traders into selling, allowing heavy capital to quietly absorb shares at a high level.
2. The Educational Setup: The Volatility Squeeze
To understand the sheer strength of this current breakout, look at the mechanics inside the box leading up to the launch:
The High-Level Base: By holding the gains of the initial thrust and refusing to break below the 88.00 floor, the stock formed a massive "Bull Flag" or "High-Level Base." This proves that institutional demand was far greater than retail profit-taking.
The Bollinger Band Squeeze: Look at the blue Bollinger Bands. As the price chopped sideways in the box, the upper and lower bands pinched tightly together. In technical analysis, volatility is cyclical; a massive contraction (a squeeze) is almost always followed by a violent expansion. The box acted like the ultimate pressure cooker, storing immense kinetic energy.
3. Current Price Action: The Lid Blows Off
Look at the most recent daily candles on the far right. The pressure cooker has absolutely exploded. Buyers have effortlessly shattered the 104.00 box ceiling with consecutive green momentum expansion candles, pushing the price past 111.00. Furthermore, notice how the price has violently pierced the upper Bollinger Band, forcing the bands to rapidly expand upward. By decisively clearing this massive multi-month accumulation zone, VAL has officially completed its digestion phase and entered a powerful new markup phase.
4. The Trade Plan: Entries, Targets, and Risk Management
Entry Strategy: Momentum is exceptionally strong right now near 111.00. Chasing a massive vertical expansion candle riding outside the daily Bollinger Bands carries a high risk of an agonizing intraday or daily mean-reversion pullback. The highest-probability, lowest-risk entry involves stepping down to an hourly timeframe and placing limit orders to catch a potential structural pullback to perfectly retest the top of the box in the 104.00 to 106.00 zone. Letting that old, heavy box resistance prove itself as a new, indestructible support floor offers a phenomenal risk-to-reward ratio.
Take Profit (Targets): We use measured structural targets based on the depth of the consolidation box. By taking the depth of the box (roughly 16 points from the 88.00 floor to the 104.00 ceiling) and projecting it upward from the breakout line, our primary structural swing target sits perfectly in the 120.00 zone.
Invalidation (Stop Loss): A box breakout thesis is only valid if the stock refuses to fall back deep into the trap. A hard stop loss should be placed safely below the top quarter of the box and the rising 20 SMA (middle Bollinger Band), around the 98.00 to 100.00 level. A definitive daily close completely back inside the middle of the box would act as a massive warning sign of a failed breakout and a severe bull trap.
5. Time Horizon:
Because this technical setup is built on a 1-Day chart capturing an explosive breakout from a massive high-level consolidation box, this is a short-to-medium-term swing trade designed to capture the violent momentum continuation. Let the new trend run!  Long
Long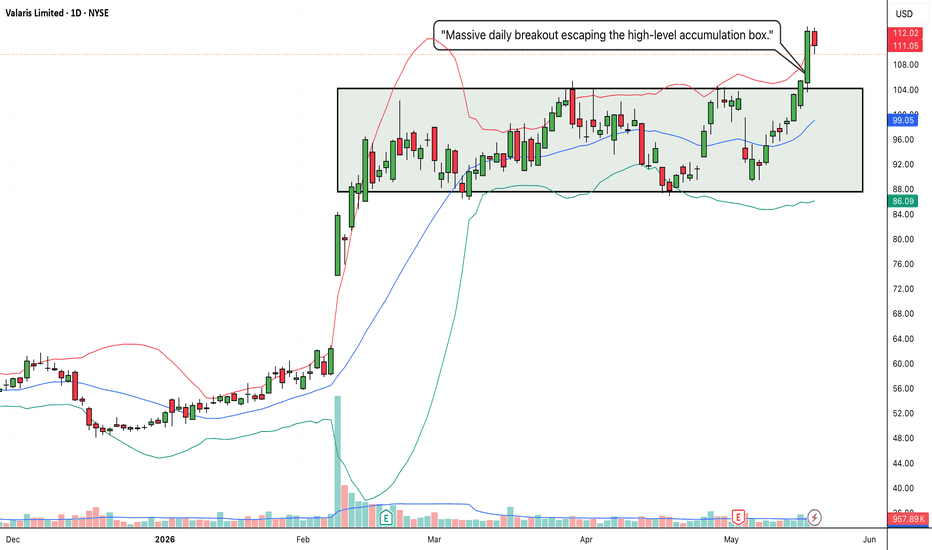
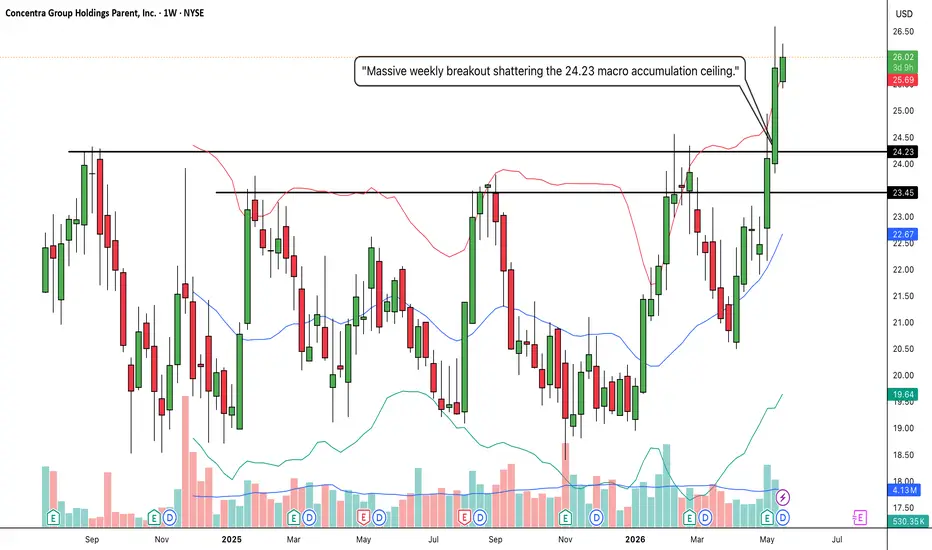
CON: Massive W-Bottom Macro Base and Explosive Breakout1. The Macro Perspective: The Multi-Month Washout
I am taking a LONG bias on Concentra Group Holdings Parent, Inc. (CON) on the weekly (1W) timeframe.
When analyzing pure market structure, the most lucrative macro trends are born from deep, exhausting accumulation phases. Look at the massive structural development spanning this chart. After establishing a historical resistance zone between the solid black 23.45 and 24.23 lines, the stock suffered a prolonged markdown phase. It washed out all the way down into the 19.50 zone, completely decimating weak hands and forcing retail capitulation. However, heavy institutional capital stepped in at those lows to establish an absolute concrete floor, initiating the left side of a massive "W" or Double Bottom accumulation structure.
2. The Educational Setup: The Higher-Low Springboard
To understand the sheer strength of this current breakout, look at how the right side of the "W" pattern was formed:
The Rejection and the Trap: The stock rallied back to the 24.23 ceiling and faced a brutal rejection. To an amateur trader, this looked like a massive double-top failure, triggering short sellers and panic selling.
The 20 SMA Defense: Notice what happened next. The stock pulled back, but it refused to make a new low. Instead, institutional buyers aggressively defended the rising 20 SMA (the middle blue line of your Bollinger Bands) right around the 20.00 to 21.00 level. By carving out a massive "Higher Low" directly on the moving average, they trapped the short sellers and created a powerful structural springboard for the next leg up.
3. Current Price Action: Blue Sky and Volatility Expansion
Look at the most recent weekly candles on the far right. The springboard has absolutely exploded. Buyers have effortlessly shattered the entire resistance block (23.11 dashed, 23.45 solid, and 24.23 solid) with consecutive, massive green momentum expansion candles. Furthermore, notice how the price has violently pierced the upper Bollinger Band, forcing the bands to rapidly expand upward alongside a noticeable surge in buying volume. By decisively clearing this massive multi-month accumulation zone, CON has officially entered "Blue Sky Territory" (pure price discovery).
4. The Trade Plan: Entries, Targets, and Risk Management
Entry Strategy: Momentum is exceptionally strong right now near 26.00. Chasing a massive vertical expansion candle riding outside the weekly Bollinger Bands always carries a higher risk of an agonizing intraday or daily mean-reversion pullback. The highest-probability, lowest-risk entry involves stepping down to a daily timeframe and placing limit orders to catch a potential structural pullback to perfectly retest the 24.00 to 24.50 breakout zone. Letting that heavy historical resistance prove itself as a new, indestructible support floor offers a phenomenal risk-to-reward ratio.
Take Profit (Targets): We use measured structural targets based on the depth of the massive macro base. By taking the depth of the W-Bottom (roughly 4.75 points from the ~19.50 floor up to the 24.23 ceiling) and projecting it upward from the breakout line, our primary structural swing target sits comfortably in the 28.75 to 29.00 zone. The psychological 30.00 mark will act as a secondary macro magnet.
Invalidation (Stop Loss): A macro breakout thesis is only valid if the new market structure holds. A hard stop loss should be placed safely below the breakout zone and the recent daily consolidation, around the 22.00 to 22.50 level. A definitive weekly close completely back inside the old accumulation base and breaking below the 20 SMA would act as a massive warning sign of a failed macro breakout and a severe bull trap.
5. Time Horizon:
Because this technical setup is built on a 1-Week chart capturing a massive structural W-Bottom completion and volatility expansion, this is a medium-to-longer-term position trade designed to capture the explosive new markup phase. Let the macro trend run!  Long
Long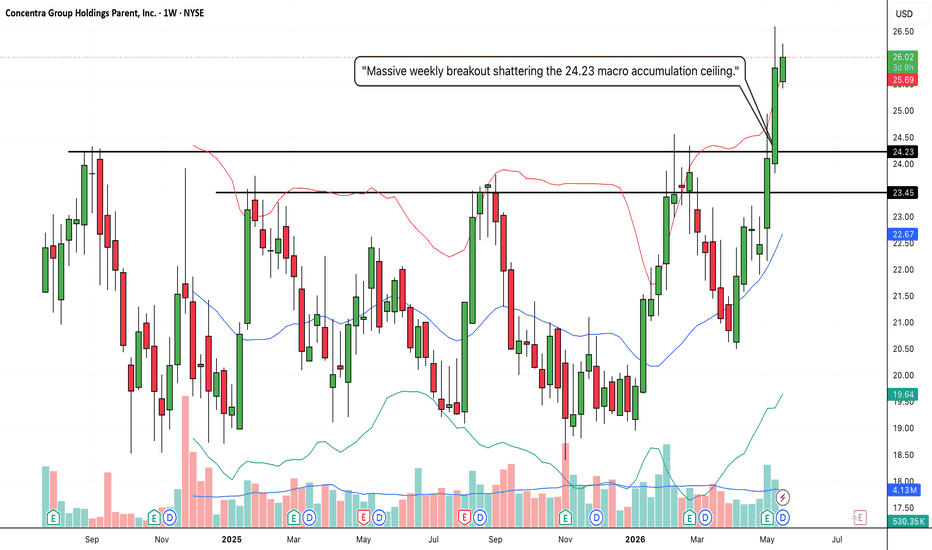
COST:The Macro Cup & Handle and Explosive All-Time High Breakout1. The Macro Perspective: The Digestion Bowl
I am taking a LONG bias on Costco Wholesale Corporation (COST) on the weekly (1W) timeframe.
When analyzing pure market structure, the healthiest and most sustainable secular trends require proportional digestion phases. Look at the massive structural development spanning the center of this chart. After establishing a historical peak at the solid black 1,066.96 line, the stock was technically exhausted. However, instead of collapsing into a bear market, institutional capital facilitated a highly controlled, multi-month markdown phase. The stock washed out down toward the 800 level, shaking out weak hands, before finding a concrete floor. Over the ensuing months, it carved out a massive "Cup" or rounding bottom, systematically marching right back up to challenge the scene of the crime.
2. The Educational Setup: The 20 SMA Pressure Cooker Handle
To understand the sheer strength of this current breakout, look at how the price systematically transitioned from accumulation back into a markup phase right at the ceiling:
The High-Level Squeeze: When the price reached the ultimate macro neckline at 1,066.96, amateur traders expected a brutal double-top rejection. Instead, institutional buyers aggressively defended the structure. They absorbed supply and forced the price to chop sideways in a tight range just below the resistance, establishing a structural "Handle."
The Dynamic Trampoline: Look closely at the handle formation. Every minor dip was perfectly bought right at the rising 20 SMA (the middle blue line of your Bollinger Bands). Consolidating tightly between a flat resistance ceiling and a rising moving average creates the ultimate pressure cooker. It gracefully transfers shares from impatient retail traders taking profits to strong-handed institutional buyers, allowing the bands to squeeze and storing immense kinetic energy.
3. Current Price Action: Blue Sky Territory
Look at the most recent weekly candle on the far right. The pressure cooker has absolutely exploded. Buyers have effortlessly shattered the 1,066.96 macro ceiling with a massive green momentum expansion candle, pushing the price well into the 1,070s. Furthermore, the price is now aggressively pushing against the upper Bollinger Band, forcing a volatility expansion. By decisively clearing this massive accumulation zone, COST has officially entered "Blue Sky Territory" (pure price discovery). All historical overhead supply has been completely eliminated.
4. The Trade Plan: Entries, Targets, and Risk Management
Entry Strategy: Momentum is exceptionally strong right now near 1,076.47. Chasing a massive vertical expansion candle breaking into new highs carries the risk of an agonizing intraday or daily drawdown as the stock naturally breathes. The highest-probability, lowest-risk entry involves stepping down to a daily timeframe and placing limit orders to catch a potential minor structural pullback to perfectly retest the 1,060.00 to 1,070.00 breakout zone. Letting that old, heavy historical resistance prove itself as a new, indestructible support floor offers a phenomenal risk-to-reward ratio.
Take Profit (Targets): We use measured structural targets based on the depth of the macro base. By taking the depth of the massive Cup (roughly 260+ points from the ~800 floor up to the 1,066.96 ceiling) and projecting it upward from the breakout line, our primary structural macro target sits comfortably in the 1,325.00 to 1,350.00 zone.
Invalidation (Stop Loss): A macro breakout thesis is only valid if the new market structure holds. A hard stop loss should be placed safely below the 20 SMA and inside the recent handle consolidation, around the 980.00 to 1,000.00 level. A definitive weekly close completely back inside the old accumulation base and breaking below the moving average would act as a massive warning sign of a failed macro breakout and a severe bull trap.
5. Time Horizon:
Because this technical setup is built on a 1-Week chart capturing a massive structural phase transition and Cup & Handle completion, this is a medium-to-longer-term position trade designed to capture a secular markup phase. Let the macro trend run!  Long
Long
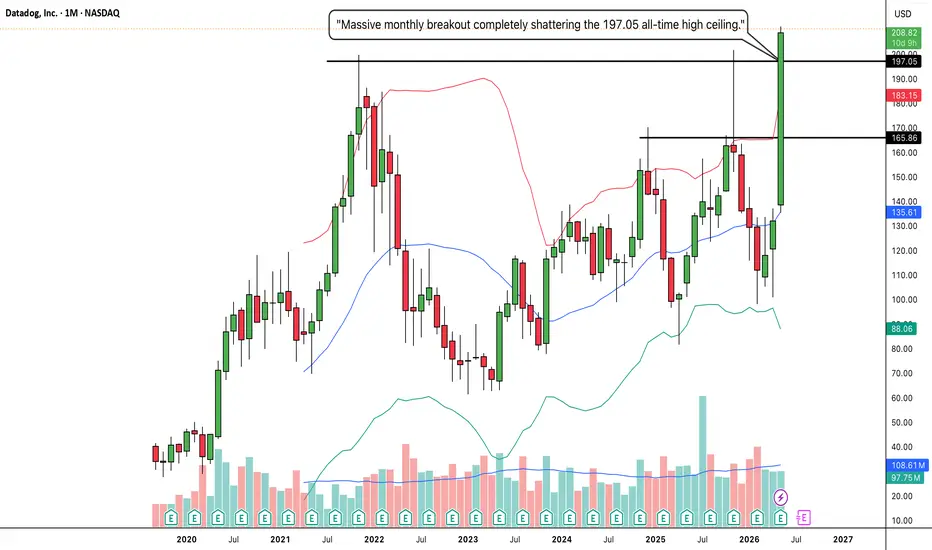
DDOG:Multi-Year Rounding Bottom and ExplosiveAll-TimeHighBrekout1. The Macro Perspective: The Brutal Washout and Recovery
I am taking a LONG bias on Datadog, Inc. (DDOG) on the absolute macro monthly (1M) timeframe.
When analyzing pure market structure on a monthly chart, we are looking at cycles that take years to play out. Look at the massive structural development spanning this entire chart. After establishing a historical peak at the solid black 197.05 line, the stock suffered a brutal, agonizing markdown phase. This deep correction successfully washed out weak hands and forced mass retail capitulation, dragging the price all the way down into the 60s. However, instead of bleeding into a permanent bear market, heavy institutional capital stepped in to establish a concrete floor. Over the last two years, the stock has been quietly carving out an enormous "Rounding Bottom" accumulation phase, systematically riding the 20 SMA (the middle Bollinger Band) to march right back up the chart.
2. The Educational Setup: Conquering the Stepping Stones
To understand the sheer strength of this current breakout, look at how the price systematically transitioned from accumulation back into a markup phase:
The Mid-Level Digestion: The stock's recovery initially faced heavy resistance at the solid black 165.86 line. Instead of suffering a massive rejection, it paused, digested the supply, and formed a high-level consolidation right at the moving average.
The Institutional Urgency: When institutional capital decides it is time to move, they don't wait. Buyers used that mid-level digestion as a launchpad, creating an aggressive, near-vertical surge that refused to give sellers a chance to breathe.
3. Current Price Action: Blue Sky and Volatility Expansion
Look at the most recent monthly candle on the far right. The momentum is absolutely explosive. Buyers have effortlessly shattered both the 165.86 stepping stone and the 197.05 ultimate macro ceiling in a single, massive momentum expansion candle. Furthermore, notice how the price has violently pierced the upper Bollinger Band, forcing the bands to rapidly expand. By decisively clearing this multi-year accumulation zone, DDOG has officially entered "Blue Sky Territory" (pure price discovery). All historical overhead supply has been completely eliminated.
4. The Trade Plan: Entries, Targets, and Risk Management
Entry Strategy: Momentum is exceptionally strong right now near 208.82. Chasing a massive vertical expansion candle riding completely outside the monthly Bollinger Bands carries a severe risk of an agonizing drawdown as the stock naturally breathes. The highest-probability, lowest-risk entry involves stepping down to a weekly or daily timeframe and waiting for the dust to settle. Look to place limit orders to catch a potential minor structural pullback to perfectly retest the 195.00 to 200.00 breakout zone. Letting that old all-time high resistance prove itself as a new, indestructible support floor offers a phenomenal risk-to-reward ratio.
Take Profit (Targets): We use measured structural targets based on the depth of the macro base. By taking the depth of the massive Rounding Bottom (roughly 130 points from the ~65 floor up to the 197.05 ceiling) and projecting it upward from the breakout line, our primary structural macro target sits comfortably in the 325.00 to 330.00 zone. Immediate psychological milestones are 250.00 and 300.00.
Invalidation (Stop Loss): A macro breakout thesis is only valid if the new market structure holds. A hard stop loss should be placed safely below the 197.05 breakout line and the 165.86 mid-level pivot, around the 150.00 to 155.00 level. A definitive monthly close completely back inside the old accumulation base would act as a massive warning sign of a failed macro breakout and a severe bull trap.
5. Time Horizon:
Because this technical setup is built on a 1-Month chart capturing a massive structural phase transition and All-Time High breakout, this is a long-term position trade designed to capture a secular markup phase over the coming months. Let the macro trend run!  Long
Long
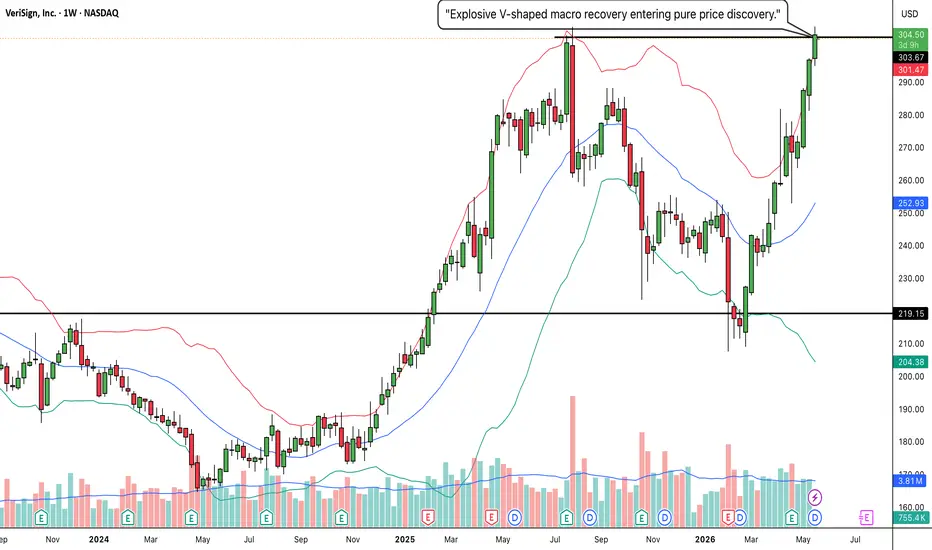
VRSN:Textbook Macro Break & Retest and ExplosiveV-ShapedBreakout1. The Macro Perspective: The Perfect Break and Retest
I am taking a LONG bias on VeriSign, Inc. (VRSN) on the weekly (1W) timeframe.
When analyzing pure market structure, the most lucrative macro trends are built on indestructible foundations. Look at the massive structural development spanning this entire chart. Previously, the stock was capped by the solid black resistance line at 219.15. When it finally broke out, it initiated a massive, parabolic run all the way up to the 305 zone. Naturally, that kind of momentum causes severe exhaustion. The stock suffered a brutal, highly volatile washout phase. But look exactly where the bleeding stopped. The price crashed straight down to the 219.15 line, found a concrete floor, and bounced. It perfectly retested its previous macro resistance, officially flipping it into indestructible support.
2. The Educational Setup: The Aggressive V-Shaped Right Side
To understand the sheer strength of this current breakout, look at how the price behaved after that massive 219.15 retest:
Institutional Urgency: After a deep washout, stocks usually chop sideways for months to build a rounded base. VRSN completely ignored that playbook.
The V-Shape: Institutional capital stepped in with extreme aggression, creating a V-shaped recovery. Buyers forced the price straight back up the right side of the chart, completely bypassing mid-level resistance and marching directly back to the ultimate macro ceiling at the solid black 304.50 line.
3. Current Price Action: Riding the Upper Band into Blue Sky
Look at the most recent weekly candles on the far right. The recovery has successfully converted into an explosive breakout. Buyers have effortlessly shattered the 304.50 macro ceiling with a strong green momentum expansion candle. Furthermore, notice how the price has violently pierced the upper Bollinger Band, forcing the bands to rapidly expand upward. By decisively clearing this massive multi-month ceiling, VRSN has initiated a powerful volatility expansion and officially entered "Blue Sky Territory" (pure price discovery).
4. The Trade Plan: Entries, Targets, and Risk Management
Entry Strategy: Momentum is exceptionally strong right now near 305.31. Chasing a massive vertical expansion candle riding outside the weekly Bollinger Bands always carries a higher risk of an agonizing intraday or daily mean-reversion pullback. The highest-probability, lowest-risk entry involves stepping down to a daily timeframe and placing limit orders to catch a potential structural pullback to perfectly retest the 300.00 to 305.00 breakout zone. Letting that heavy historical resistance prove itself as a new support floor offers a phenomenal risk-to-reward ratio.
Take Profit (Targets): We use measured structural targets based on the depth of the massive macro base. By taking the depth of the washout (roughly 85 points from the 219.15 floor up to the 304.50 ceiling) and projecting it upward from the breakout line, our primary structural swing target sits comfortably in the 385.00 to 390.00 zone. The massive 350.00 mark will act as the immediate psychological magnet.
Invalidation (Stop Loss): A V-shaped macro breakout thesis is only valid if the new market structure holds. A hard stop loss should be placed safely below the breakout line and the rising 20 SMA (middle Bollinger Band), around the 260.00 to 270.00 level. A definitive weekly close completely back inside the old base and breaking below 250.00 would act as a massive warning sign of a failed macro breakout and a severe bull trap.
5. Time Horizon:
Because this technical setup is built on a 1-Week chart capturing a massive structural break-and-retest followed by a V-shaped recovery, this is a medium-to-longer-term position trade designed to capture the explosive new markup phase. Let the macro trend run!  Long
Long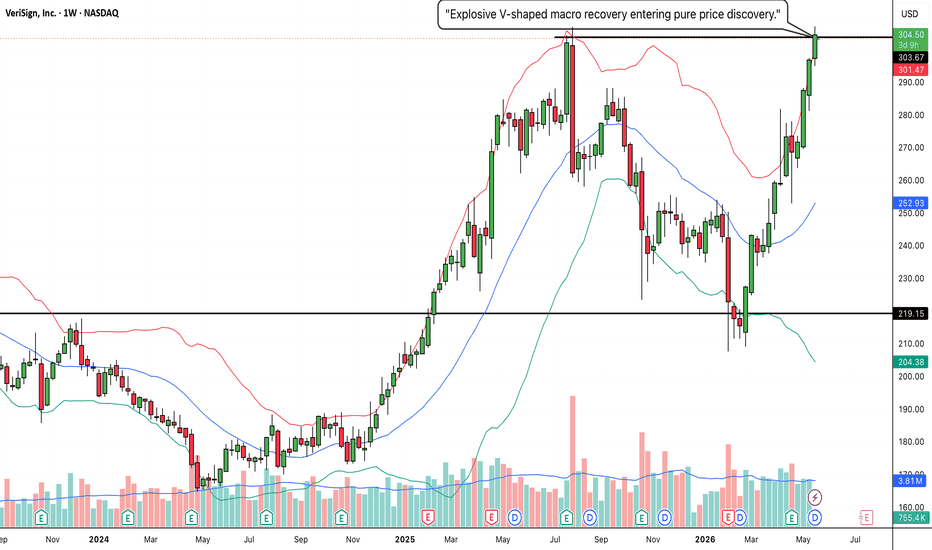
RRIL: The Momentum Pole, High-Level Flag, and Explosive Breakout1. The Macro Perspective: The Massive Momentum Thrust
I am taking a LONG bias on RRIL Limited (RRIL) on the daily (1D) timeframe.
When analyzing pure market structure, massive structural shifts are often announced by undeniable volume and momentum anomalies. Look at the defining feature in the middle of this chart. After establishing a foundational floor near the dashed 16.71 line, the stock experienced a violent, singular momentum thrust—a massive green daily expansion candle that surged vertically to establish the solid black ceiling at 20.36. That is the undeniable footprint of heavy institutional capital aggressively entering the market. In structural trading, this massive candle forms the "Pole" of a flag pattern.
2. The Educational Setup: The High-Level Pressure Cooker
To understand the sheer strength of this current breakout, look at how the price behaved after it smashed into the 20.36 resistance ceiling:
No Capitulation: After a near-vertical, massive daily run, amateur retail traders rush to take profits, which usually causes a deep, violent pullback. Notice what happened here instead. The stock refused to give back its gains.
The Tight Handle: The stock absorbed the profit-taking by chopping tightly in a very narrow range directly underneath the 20.36 resistance line. Consolidating sideways in the upper quarter of a massive expansion candle forms a textbook "High-Level Base," "Bull Flag," or "Handle." This acts like a pressure cooker. It gracefully transfers shares from impatient retail traders to strong-handed institutional buyers, storing immense kinetic energy without sacrificing structural ground.
3. Current Price Action: The Lid Blows Off
Look at the most recent daily candle on the far right. The high-level pressure cooker has absolutely exploded. Buyers have effortlessly shattered the 20.36 macro ceiling with a strong continuation thrust, backed by a noticeable uptick in buying volume. By decisively clearing this tight accumulation zone, RRIL has officially completed its digestion phase and initiated a powerful structural continuation.
4. The Trade Plan: Entries, Targets, and Risk Management
Entry Strategy: Momentum is exceptionally strong right now near 20.72. Chasing a breakout always carries a risk of an immediate intraday drawdown as the stock naturally breathes. The highest-probability, lowest-risk entry involves placing limit orders to catch a potential minor structural pullback to perfectly retest the 20.00 to 20.40 breakout zone. Letting that old, heavy resistance prove itself as a new, indestructible support floor offers a phenomenal risk-to-reward ratio.
Take Profit (Targets): We use measured structural targets based on the "Flag Pole." By taking the depth of the initial momentum thrust (roughly 4.5 points from the ~15.80 launchpad up to the 20.36 ceiling) and projecting it upward from the recent breakout line, our primary structural swing target sits comfortably in the 24.50 to 25.00 zone.
Invalidation (Stop Loss): A flag continuation thesis is only valid if the high-level base holds. A hard stop loss should be placed safely below the recent tight consolidation structure, around the 18.50 to 19.00 level. A definitive daily close completely back below 18.00 would act as a massive warning sign of a failed structural breakout and a severe bull trap.
5. Time Horizon:
Because this technical setup is built on a 1-Day chart capturing an explosive Bull Flag / High-Level Base completion, this is a short-to-medium-term swing trade designed to capture the violent momentum continuation. Let the new trend run!  Long
Long
Nifty 50: Master Trend Line intact amid key liquidity testThe broader structural trend on NIFTY remains intact when viewed from the foundational 20,267.90 level (My Nifty50 Viewing Level), but current price action at 23,336.40 reflects a testing phase within a tightening triangular consolidation. Trend Line 1 (TL1) continues to serve as the dominant master trendline guiding the primary upward trajectory, while Trend Line 2 (TL2) represents a critical structural boundary. Price action fluctuating between TL1 and TL2 exhibits characteristics of a liquidity sweep, and with the spread between both trendlines steadily widening, navigating this range requires precision. Alignment between Nifty 50 and RSI (14) has historically emerged from the 24,061.60 area, and the path of least resistance over the higher timeframes hinges on key technical confirmations rather than premature positioning.
Reversal confirmation criteria: A technical bounce gains higher probability only when daily RSI (14) crosses decisively above the 30 oversold mark, backed by expanding daily volume and a firm green closing candle above immediate support.
Critical structural risk at TL2: Trend Line 2 marks the defensive line for the broader setup; a sustained breakdown below TL2 dramatically elevates the probability of a deep mean-reversion move toward the unfilled daily gap near the 20,000 to 20,267.90 demand base.
Liquidity sweep zone between TL1 and TL2: Action between the master Trend Line 1 and Trend Line 2 should be approached with extreme caution, as choppy swings in this widening corridor are prone to shaking out short-term traders.
Overhead supply hurdles: For the broader bullish structure to expand toward higher resistance boundaries (24,989.35 and the 26,373.20 all-time high), price must first reclaim and hold above the 24,000 to 24,061.60 sync pivot.
Disclaimer: This information is only for knowledge sharing and no investment advise and I am not a SEBI Reg. Advisor.  Long
Long
STYLAMIND: The Weekly 20 SMA Squeeze and Explosive Cup & Handle 1. The Macro Perspective: The Weekly Cup
I am taking a LONG bias on Stylam Industries Limited (STYLAMIND) on the weekly (1W) timeframe.
When analyzing pure market structure, the most reliable setups occur when a stock methodically absorbs historical supply. Look at the massive structural development on this chart. After establishing a major peak at the solid black 2,655.80 line, the stock suffered a healthy, multi-month corrective phase. However, instead of collapsing, institutional buyers aggressively defended the structure, carving out a massive "Cup" accumulation phase. They systematically digested overhead supply and marched the price right back up to challenge the historical ceiling.
2. The Educational Setup: The 20 SMA Pressure Cooker Handle
To understand the sheer strength of this current breakout, look closely at how the "Handle" was formed on the right side of the chart using the Bollinger Bands:
The Dynamic Floor: When the price reached the 2,655.80 ceiling, it didn't suffer a brutal rejection. Instead, it pulled back and found perfect dynamic support on the rising 20 SMA (the middle blue line of the Bollinger Bands).
The Squeeze: Institutional capital used that 20 SMA as a trampoline, steadily pushing the price higher and squeezing it directly against the horizontal resistance. Consolidating tightly between a rising moving average and a flat resistance line creates the ultimate pressure cooker. It transfers shares from impatient retail traders to strong-handed buyers while allowing kinetic energy to build.
3. Current Price Action: Riding the Upper Band into Blue Sky
Look at the most recent weekly candle on the far right. The pressure cooker has absolutely exploded. Buyers have effortlessly shattered the 2,655.80 macro ceiling with a massive green momentum expansion candle, pushing the price well into the 2,770 zone. Furthermore, notice how the price has violently pierced the upper Bollinger Band, forcing the bands to rapidly expand. By decisively clearing this accumulation zone, STYLAMIND has initiated a powerful volatility expansion and officially entered "Blue Sky Territory" (pure price discovery).
4. The Trade Plan: Entries, Targets, and Risk Management
Entry Strategy: Momentum is exceptionally strong right now near 2,773.00. Chasing a massive vertical expansion candle riding outside the weekly Bollinger Bands carries a high risk of an agonizing intraday or daily drawdown as the stock naturally breathes. The highest-probability, lowest-risk entry involves stepping down to a daily timeframe and waiting for the dust to settle. Look to place limit orders to catch a potential minor structural pullback to perfectly retest the 2,650.00 to 2,700.00 breakout zone. Letting that heavy historical resistance prove itself as a new, indestructible support floor offers a phenomenal risk-to-reward ratio.
Take Profit (Targets): We use measured structural targets based on the depth of the macro base. By taking the depth of the massive Cup (roughly 800+ points from the ~1,850 mid-level support up to the 2,655.80 ceiling) and projecting it upward from the breakout line, our primary structural swing target sits comfortably in the 3,450.00 to 3,500.00 zone. Immediate psychological milestones are 3,000.00 and 3,200.00.
Invalidation (Stop Loss): A trade thesis is only valid if the new market structure holds. A hard stop loss should be placed safely below the 20 SMA and the recent handle consolidation, around the 2,250.00 to 2,300.00 level. A definitive weekly close completely back inside the old accumulation base and breaking below the moving average would act as a massive warning sign of a failed structural breakout and a severe bull trap.
5. Time Horizon:
Because this technical setup is built on a 1-Week chart capturing a massive structural Cup & Handle completion and volatility expansion, this is a medium-term swing/position trade designed to capture the explosive new markup phase. Let the new trend run!  Long
Long
PFC: The Ultimate Bear Trap, Box Breakout, and Textbook Retest1. The Macro Perspective: The Digestion Box
I am taking a LONG bias on Power Finance Corporation Limited (PFC) on the weekly (1W) timeframe.
When analyzing pure market structure, massive momentum runs require massive digestion phases. Look at the structural development on the left side of this chart. After a historical parabolic run-up, the stock naturally exhausted itself. But instead of entering a multi-year bear market, institutional buyers established a massive horizontal consolidation zone (a Box) to digest the gains. For months, the price chopped violently between the solid black floor at 348.40 and the solid black ceiling at 423.55. This sideways action acts as a "washing machine," frustrating impatient retail traders and allowing heavy capital to quietly absorb shares.
2. The Educational Setup: The Bear Trap (Spring)
To understand the sheer strength of this current setup, look closely at what happened at the bottom of the box before the breakout:
The Shakeout: Notice how the price broke below the 348.40 floor? To an amateur, this looked like a catastrophic breakdown, triggering mass panic selling and stop-losses.
The Reversal: However, institutional capital used that exact liquidity to buy aggressively at a discount, forming a V-shaped recovery right back into the box. In structural trading, this is called a "Bear Trap" or a Wyckoff "Spring." It is the ultimate confirmation of heavy institutional demand. Once the weak hands were flushed out, the stock marched relentlessly straight to the top of the box.
3. Current Price Action: The Confluence Retest
Look at the right side of the chart. The stock successfully shattered the 423.55 box ceiling, tested the mid-level dashed pivot at 472.91, and is now experiencing a healthy corrective pullback. Look at the current weekly candle. It is pulling back to perfectly retest the 423.55 breakout line from above. Furthermore, notice the middle blue line of your Bollinger Bands (the 20 SMA) sitting right at 413.41. The price is perfectly wedged between major horizontal support and dynamic moving average support. This is a textbook "Break and Retest"—flipping a massive historical ceiling into a brand-new, indestructible launchpad.
4. The Trade Plan: Entries, Targets, and Risk Management
Entry Strategy: We are currently sitting directly in the "golden entry" confluence zone. The highest-probability, lowest-risk entry involves stepping down to a daily timeframe and waiting for bullish reversal candles to form exactly in this 415.00 to 425.00 area. Letting that newly broken box ceiling and the rising 20 SMA prove themselves as a concrete floor offers a phenomenal risk-to-reward ratio before the next momentum expansion.
Take Profit (Targets): Our structural targets are crystal clear. The immediate hurdle is reclaiming the recent swing high at the dashed 472.91 line. Once that stepping stone is cleared, the ultimate macro target is a full retest of the massive red historical all-time high ceiling sitting way up at 543.35.
Invalidation (Stop Loss): A break-and-retest thesis is only valid if the new floor holds. A hard stop loss should be placed safely below the 20 SMA and back inside the top half of the box, around the 385.00 to 395.00 level. A definitive weekly close completely back inside the middle of the old accumulation box would invalidate the immediate continuation thesis and signal a failed breakout.
5. Time Horizon:
Because this technical setup is built on a 1-Week chart capturing a massive box breakout, a confirmed bear trap, and a structural retest, this is a medium-to-longer-term position trade designed to capture a major markup phase back toward all-time highs. Let the macro trend run!  Long
Long
ATALREAL: Massive Macro Cup and Handle Breakout1. The Macro Perspective: The Deep Washout and the Cup
I am taking a LONG bias on Atal Realtech Limited (ATALREAL) on the weekly (1W) timeframe.
When analyzing pure market structure, the most lucrative macro trends are born from the ashes of severe corrections. Look at the massive structural development on the left side of this chart. After establishing a historical peak near the 28.00 zone, the stock suffered an agonizing, highly volatile markdown phase that dragged the price all the way down into the single digits (near the 6.00 to 8.00 floor). This brutal correction successfully washed out weak hands and forced mass retail capitulation. However, instead of bleeding into bankruptcy, heavy institutional capital stepped in to establish an absolute concrete floor. Over the last year, the stock has been quietly carving out a massive "Cup" or rounding bottom accumulation phase, systematically marching right back to the scene of the crime.
2. The Educational Setup: The Pressure Cooker Handle
To understand the sheer strength of this current breakout, look at how the price systematically transitioned from accumulation back into a markup phase at the ceiling:
The Neckline: The stock's recovery was heavily capped by the formidable resistance zone marked by the dashed 27.39 and solid black 27.80 lines.
The High-Level Squeeze: When the price reached this ultimate macro neckline, amateur traders expected a brutal double-top rejection. Instead, institutional buyers aggressively defended the structure, absorbing supply and forcing the price to chop sideways to slightly lower, forming a massive structural "Handle." Consolidating right below major historical resistance acts like a pressure cooker, gracefully transferring millions of shares from impatient retail traders to strong-handed institutional buyers and storing immense kinetic energy.
3. Current Price Action: Blue Sky and Healthy Indicators
Look at the most recent weekly candles on the far right. The pressure cooker has absolutely exploded. Buyers have effortlessly shattered the 27.80 macro ceiling with a massive green momentum expansion candle, pushing the price past 29.00. Furthermore, look at the RSI indicator on the bottom panel. It is currently sitting at a very healthy 66.71 and pointing upward. It successfully cooled off during the handle formation and is now expanding with plenty of room to run before becoming dangerously overbought. By decisively clearing this massive multi-month accumulation zone, ATALREAL has officially entered "Blue Sky Territory" (pure price discovery).
4. The Trade Plan: Entries, Targets, and Risk Management
Entry Strategy: Momentum is exceptionally strong right now near 29.15. Chasing a massive vertical expansion candle on the weekly timeframe carries a higher risk of an agonizing intraday drawdown as the stock naturally breathes. The highest-probability, lowest-risk entry involves stepping down to a daily timeframe and placing limit orders to catch a potential minor structural pullback to perfectly retest the 27.40 to 28.00 breakout zone. Letting that old, heavy historical resistance prove itself as a new, indestructible support floor offers a phenomenal risk-to-reward ratio.
Take Profit (Targets): We use measured structural targets based on the depth of the macro base. By taking the depth of the massive Cup (roughly 21 points from the ~6.50 floor up to the 27.80 ceiling) and projecting it upward from the breakout line, our primary structural macro target sits comfortably in the 48.00 to 50.00 zone. The immediate psychological milestone will be the 40.00 mark.
Invalidation (Stop Loss): A reversal thesis is only valid if the new market structure holds. A hard stop loss should be placed safely below the 27.80 breakout line and inside the recent handle consolidation, around the 21.00 to 22.00 level. A definitive weekly close completely back inside the old accumulation base and breaking below 20.00 would act as a massive warning sign of a failed macro breakout and a severe bull trap.
5. Time Horizon:
Because this technical setup is built on a 1-Week chart capturing a massive structural phase transition and Cup & Handle completion, this is a medium-to-longer-term position trade designed to capture the explosive new markup phase. Let the macro trend run!  Long
Long
TATASTEEL: The Macro Staircase and Explosive High-Level Breakout1. The Macro Perspective: The Perfect Staircase
I am taking a LONG bias on Tata Steel Limited (TATASTEEL) on the daily (1D) timeframe.
When analyzing pure market structure, the healthiest and most sustainable trends do not go straight up in a single volatile line; they climb stairs. Look at the beautiful structural development on this chart. The stock established a rock-solid floor at the 164.46 line. From there, it rallied to the 185.36 line, paused to build a base, broke out, and used that 185 zone as a higher launchpad. This is textbook institutional behavior—systematically absorbing supply and stepping the price higher to prevent catastrophic pullbacks.
2. The Educational Setup: The Pressure Cooker Handle
To understand the sheer strength of this current breakout, look at how the price behaved after reaching the ultimate resistance ceiling at the solid black 215.79 line:
The Washout and Retest: After hitting 215.79, the stock suffered a healthy corrective pullback. Notice where it stopped? Exactly at the dashed 182.31 / solid 185.36 zone. It perfectly retested its previous structural stepping stone, confirming that old resistance had officially become indestructible support. This formed a massive "Cup" structure.
The High-Level Squeeze: As the price marched back up to the 215.79 ceiling, it didn't just smash into it and fail. It consolidated tightly directly underneath it, forming a "Handle." Consolidating right below major historical resistance acts like a pressure cooker, gracefully transferring shares from impatient retail traders to strong-handed institutional buyers and storing immense kinetic energy.
3. Current Price Action: The Lid Blows Off
Look at the most recent daily candles on the far right. The high-level pressure cooker has exploded. Buyers have effortlessly shattered the 215.79 macro ceiling with a strong momentum thrust, pushing the price past 220. Furthermore, look at the RSI indicator at the bottom of the chart. The RSI has smoothly broken out of its own consolidation and is pointing sharply upward (around the 65 level). This confirms that bullish momentum is accelerating beautifully without being dangerously overbought yet. The digestion phase is over; the new markup phase has begun.
4. The Trade Plan: Entries, Targets, and Risk Management
Entry Strategy: Momentum is exceptionally strong right now near 221.13. Chasing a daily expansion candle always carries a risk of an immediate intraday drawdown as the stock naturally breathes. The highest-probability, lowest-risk entry involves placing limit orders to catch a potential minor structural pullback to perfectly retest the 214.00 to 216.00 breakout zone. Letting that old heavy resistance prove itself as a new support floor offers a phenomenal risk-to-reward ratio.
Take Profit (Targets): We use measured structural targets based on the depth of the recent base. By taking the depth of the Cup (roughly 33 points from the ~182 floor to the 215.79 ceiling) and projecting it upward from the breakout line, our primary structural swing target sits comfortably in the 248.00 to 250.00 zone.
Invalidation (Stop Loss): A trade thesis is only valid if the new market structure holds. A hard stop loss should be placed safely below the handle consolidation and recent swing lows, around the 198.00 to 200.00 level. A definitive daily close completely back below the 200 mark would act as a massive warning sign of a failed structural breakout and a severe bull trap.
5. Time Horizon:
Because this technical setup is built on a 1-Day chart capturing an explosive Cup and Handle completion into a new markup phase, this is a short-to-medium-term swing trade designed to capture the violent momentum thrust. Let the new trend run!  Long
Long
 Long
Long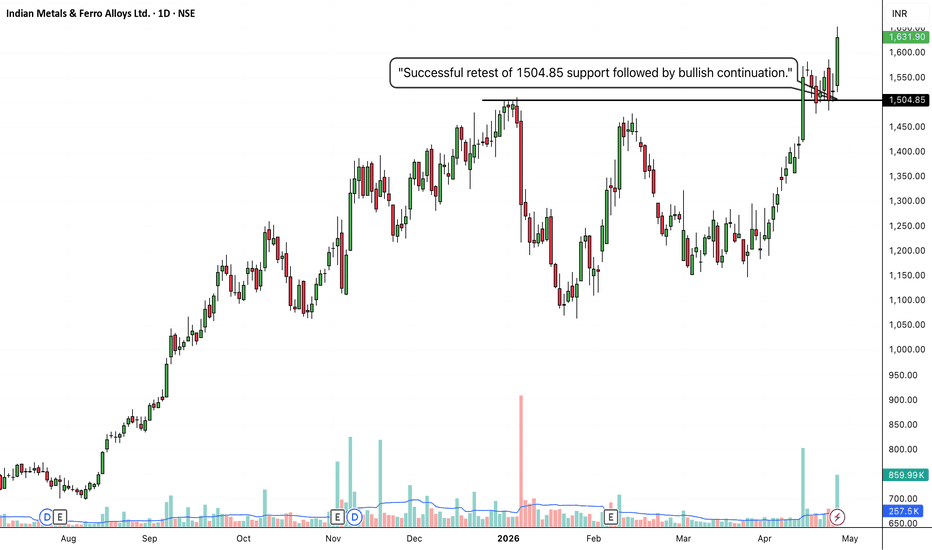
 Long
Long
Best Buy Zone Wait for break leave
Them buy deep level
Long term gold bullish
Buy zone 4000,4050,4100,4080,4200,4250,4280
Target 4350,4400,4500,4670,4800,5000 Long 
XAUUSD — Sell the H1 FVG RetestFundamental Analysis
Gold starts the Fed week under renewed pressure. Markets are pricing roughly an 89%–90% probability of a 25 bp Fed hike at the September 15–16 meeting after stronger August inflation, while the U.S. dollar has climbed to a two-week high. Brent near $108 is also reinforcing inflation concerns and keeping global bond yields elevated.
Middle East tensions continue to provide some safe-haven support, but for now the stronger dollar, higher yields and tighter Fed expectations remain the dominant headwinds for gold.
Technical Analysis
On the H1 chart, XAUUSD is trading near 4,292, maintaining a clear bearish structure below the descending resistance trendline.
Price has already broken beneath several short-term structure levels and is now testing the 4,278–4,290 demand area, close to the 4,282.76 weak low.
Because price is already extended lower, chasing shorts here offers poor positioning. The cleaner setup is a corrective rebound into the 4,320–4,335 H1 FVG.
If this imbalance is mitigated and sellers return, price could rotate back toward 4,290, sweep 4,282, and extend into the lower demand around 4,268–4,278.
The larger 4,395–4,405 FVG remains the higher resistance zone if the retracement becomes deeper.
Important Key Levels
4,395–4,405 — Major H1 FVG
4,320–4,335 — Main sell zone / H1 FVG
4,292–4,300 — Immediate pivot
4,282.76 — Weak low / liquidity
4,268–4,278 — Main demand target
Above 4,340 — Short-term invalidation
Trading Scenario
Main Sell Setup
Entry: 4,320–4,335
Stop Loss: 4,345
Take Profit 1: 4,292
Take Profit 2: 4,282
Take Profit 3: 4,268–4,278
Sell Condition
Wait for price to retrace into the H1 FVG and show bearish confirmation. A rejection wick, bearish engulfing candle, failed reclaim above 4,335, or H1 close back below 4,320 may confirm renewed seller pressure.
A sustained break above 4,340–4,345 would weaken the immediate sell setup.
Overall View
The H1 bias remains bearish while XAUUSD stays below the descending trendline and 4,320–4,335 FVG. With price already near demand, the preferred plan is not to chase the current decline. A corrective rebound into the imbalance would offer the cleaner location to look for continuation toward 4,282 and potentially 4,268–4,278.
The Fed decision remains the major volatility risk this week, with the policy guidance likely to matter as much as the expected hike itself.
Do you expect gold to retest 4,320–4,335 before sweeping the 4,282 weak low? Short 
XAUUSD — H2 Breakdown Keeps Sellers in ControlMarket Pulse
Gold remains under pressure as markets prepare for this week’s Fed decision.
Higher rate expectations, a stronger U.S. dollar and elevated Treasury yields are making it difficult for buyers to build a stable recovery. Higher oil prices are also keeping inflation concerns alive.
What the Chart Says
XAUUSD remains clearly bearish on H2.
Price continues to form lower highs and lower lows, while several bearish BOS moves confirm that sellers still control the structure.
Gold has now pushed below the 4,305–4,323 support area and is trading around 4,287. This shows that bearish momentum is still strong, but it also means price is becoming extended lower.
For that reason, I would not chase fresh shorts at the current level.
A corrective recovery could first return toward 4,305–4,323. If the rebound becomes stronger, the next areas to watch are 4,375–4,390 and 4,400–4,412.
These zones may become resistance if sellers step back in.
Levels That Matter
4,490–4,510 — Major upper resistance
4,400–4,412 — Main resistance
4,375–4,390 — Secondary resistance
4,305–4,323 — Broken support / possible retest
4,280–4,290 — Current downside area
My Main Plan
The main plan remains bearish.
I prefer waiting for a rebound instead of selling after the current drop.
If Gold recovers toward 4,305–4,323 and sellers return with clear confirmation, the bearish trend could continue.
A deeper correction toward 4,375–4,390 would offer an even cleaner area to watch if price reaches it.
What I Need to See
I want to see the rebound fail and another lower high form below the marked resistance zones.
A sustained H2 recovery above 4,412 would weaken the immediate bearish continuation setup.
Final Read
The H2 trend remains firmly bearish, and the latest breakdown confirms seller control.
However, price is already extended near the lows. For now, I prefer waiting for a corrective rebound before following the bearish trend again, rather than chasing shorts around 4,287. Short 
Downward Sloping Running Correction Just Before FED EventProbable Scenario Analysis:
⏺ Present Scenario:
The main trend of Gold (XAUUSD) FOREXCOM:XAUUSD is downward. However, the fall is staggering and volatile. It is a sign of a running correction. This week, we have a high-impact event on 16th September (Wednesday). The price action is broken due to the upcoming high-impact event. Broader sentiment is indecisive to bearish.
🟢 Bullish Scenario
There is no sign of a bullish setup. Doubt every upward move. However, if the price sustains above 4350, then weak bullish targets would be 4375 and 4400. Next, if the price starts to trade above 4400, then strong bullish targets would be - 4425, 4450, 4475, and 4500. There will be strong resistance at 4500.
🔴 Bearish Scenario
Presently, a bearish setup is active. Stay bearish below 4300. Try to find bearish opportunities only unless the trend is genuinely reversed. The probable bearish targets below 4300 would be - 4275, 4250, 4225, and 4200. There will be strong support at 4200. Next, if the price decisively breaks down below 4200, then the probable bearish targets would be - 4175 and 4150.
🟡 No Trading Zone: (4350 - 4300).
⏺ Range of Consolidation (ROC): (4350 - 4250).
Here, 4300 is the median of the ROC. The median works like a trading session sentiment evaluator. The price trading above the median would offer bullish sentiment, while the price trading below the median would trigger bearish sentiment within the ROC.
● Events:
- 14 Sep (Mon): No events.
- 15 Sep (Tue): ADP Weekly Employment Change (05:45 PM IST, 🔵 Low Impact).
- 16 Sep (Wed): Core Retail Sales m/m (06:00 PM IST, 🟠 Medium Impact). Federal Funds Rate, FOMC Economic Projections, and FOMC Statement (11:30 PM IST, 🔴 High Impact).
- 17 Sep (Thu): Philly Fed Manufacturing Index (06:00 PM IST, 🟠 Medium Impact). Pending Home Sales m/m (07:30 PM IST, 🔵 Low Impact).
- 18 Sep (Fri): Capacity Utilization Rate (06:45 PM IST, 🔵 Low Impact). FOMC Member Bowman Speaks (07:00 PM IST, 🔵 Low Impact). FOMC Member Schmid Speaks (09:15 PM IST, 🔵 Low Impact).
● Intraday, Weekly, and Monthly Bias
Establish bias with respect to the opening price (of the particular session - Intraday, Weekly, and Monthly). If the price sustains above the opening price, then don't think of shorting. Look for bullish trades only. On the contrary, if the price sustains below the opening price, then don't think of going long. Look for bearish trades in that case.
● Disclaimer + End Note
- All the analyses would fail in the case of a major gap up, gap down, or price structure anomaly. Thus, practice PRAGMATISM in the live session.
- Trade only if there is a set-up. Remember, not trading is an extension of the trading activity.
- Mark your points. Trade your points. Price is GOD. Anything can happen in the markets. Thus, trade what you see, not what you believe.
- Always PRACTICE RISK MANAGEMENT. Always PROTECT YOUR CAPITAL. Be RESPONSIBLE.
- Be Strategic. Be Courageous. Be Patient. Be Wise.
- Every day is a new day. Thus, do not carry the baggage of past successes or failures. Leave the gardens of winning and losing. Establish yourself in equanimity. Always think from a new perspective.
- Let the joy of trading drive your effectiveness, not greed or fear. Believe in Possibilities.
Happy Trading! Nifty Intraday Outlook for 15-09-2026📊 **NIFTY 15-Min: Gap-Up Rejected — Opening Structure Turns Weak**
NIFTY opened strongly higher but faced aggressive selling from the 23,590 area.
The first 15-minute candle produced a sharp rejection and price has now slipped below the important 23,470 level.
That shifts the immediate setup toward sell-on-rise unless buyers quickly reclaim the broken structure.
---
📌 **Important Levels**
Resistance:
• 23,520
• 23,590
Upside Targets:
• 23,590
• 23,680
• 23,790
Support:
• 23,445
Downside Targets:
• 23,400
• 23,360
• 23,230
---
📉 **Bearish Plan**
If NIFTY pulls back toward 23,472–23,500 and gets rejected:
• PE after bearish confirmation
• Prefer lower-high formation + rejection
• Targets: 23,445 / 23,420 / 23,400
Below 23,445:
• Bearish continuation
• Prefer breakdown + failed reclaim
• Targets: 23,420 / 23,40 0/ 23,362
Do not chase PE after the sharp opening fall. A pullback can provide a much cleaner setup.
---
📈 **Bullish Plan**
CE only after NIFTY reclaims and sustains above 23,475.
Targets:
• 23,500
• 23,520
• 23,550
Stronger bullish confirmation comes only above 23,590.
A bounce from the opening low alone is not enough — buyers need to reclaim the broken resistance structure.
---
🌍 **Market Context**
The expected positive opening materialized, but sellers aggressively rejected the opening strength.
Brent crude remains elevated near $107 as Middle East supply risks continue.
Higher oil, rupee pressure and elevated US bond yields remain important headwinds for Indian equities.
Markets are also focused on the Federal Reserve meeting, with expectations of a rate hike remaining high.
---
✅ **Final View**
Above 23,475 → short-covering recovery possible
Above 23,520 → recovery strengthens
Reject 23,472–23,500 → PE setup preferred
Below 23,445 → bearish continuation
Below 23,402 → downside momentum strengthens
At current levels after the opening fall → WAIT
Educational analysis only. Trade with confirmation and disciplined risk management.
 Long
Long
 Long
Long