Why nifty ignored resistance on friday - futures flowFriday (11 sep) nifty decoded, phase by phase. no view for monday here, just what the data showed while it was happening.
Setup - nifty opened gap down at 23,270, ~0.9% below thursday close. Above us was the zone it fell from : thursday low 23,380 and wednesday close 23,431. Proper resistance on chart, most of us were expecting rejection there.
Phase 1 (9:15 - 10:00) gap down, big volume, no follow thru
Those tall red volume bars at open - thats the gap getting sold, low came at 23,231. But in nifty futures, aggressive selling vs aggressive buying was almost balanced in those first 45 min. Big volume but sellers not pressing = first clue.
Phase 2 (10:00 - 12:00) the climb
Fut buyers took over. Trades hitting the ask beat trades hitting the bid by ~11% of volume in both hours, strongest of the day. Price went up towards the zone.
Phase 3 (12:00 - 13:40) pause under resistance
Price went sideways and lot of reads turned bearish here - classic "rejection at resistance" look. But fut buying never flipped to selling, it only slowed down (still net buying every hour). And fut never lost session VWAP - above it for 313 of 315 minutes from 10:00 to 15:15.
Phase 4 (13:41) the dump that failed
One minute of ~₹100 cr net selling in cash stocks plus a burst of big option prints (~₹136 cr premium in 5 sec on nifty + sensex strikes). Low 23,315, looked like breakdown. But futures were net bought in that same minute, and PE OI unwinding started - the 5 strikes near ATM lost ~48 lakh put OI between 13:35 and 13:50.
Phase 5 (13:41 - 14:05) breakout
Option prints and fut buying came first (13:41 - 13:48), cash stocks joined later - ~₹29 cr net buying at 13:54 and ~₹64 cr at 14:02. Day high 23,448 at 14:03. Thats the long green candle on the chart.
Phase 6 (14:05 - close)
Held most of it, closed 23,398 - inside the zone, not above it. So resistance got tested and entered, not cleared on close.
Full day picture - in nifty 50 stocks aggressive buying beat aggressive selling by ~₹1,250 cr (10:00 - 15:15), and 34 of 50 stocks were up in that window.
What this does NOT tell you -
- orderflow shows who is pushing right now. its not a forecast, same picture can still end in rejection on another day.
- "buyers getting tired at the high" type reads kept firing whole afternoon and were wrong. on a trending day price sits near the high for hours, so without real proof of fading (less offers lifted, thinner bids) its just a location.
- OI falling = positions closed. alone it cant tell if put buyers exited or put writers covered.
Takeaway - before calling any level resistance, check if someone is actually selling into it.
Not a trade reco. Only market structure learning, do your own analysis.  Long
Long
 Long
Long

HDFC Bank - Weekly Analysis – Potential Bullish RSI Divergence.NSE:HDFCBANK
HDFC Bank Limited is forming a potential reversal structure on the weekly chart following a prolonged correction from its major peak near ₹1,020.00+ . Price established a major base low near ₹681.90 (with key extended support around ₹652.75 ) and is currently trading at ₹708.25 (-0.54%). A potential bullish RSI divergence is emerging as price forms lower lows/equal lows while the RSI line demonstrates higher lows, pointing toward a base-building process or potential 'W' pattern formation.
🔹 PATTERN: BULLISH RSI DIVERGENCE & KEY RESISTANCE ZONES
• Bullish RSI Divergence (Potential): Price is testing the lower support band near ₹681.90 – ₹708.25 , while the weekly RSI indicator shows a rising trajectory above oversold levels.
• W-Pattern / Base Formation Setup: Consolidation around ₹708.25 – ₹720.00 supports a double-bottom base, with a confirmed entry trigger above ₹720.00 .
• Overhead Trendline Channel: Ascending multi-line resistance band situated between ₹750.00 and ₹760.00 .
• GAP Resistance / SHORT Zone: Major unfilled horizontal gap supply band near ₹790.00 – ₹810.00 aligned with the Round Level 800.00 .
• Previous Breakdown Zone: Major overhead horizontal supply band located between ₹920.00 and ₹950.00 ("Previous Breakdown level can be Target and Resistance Level").
🟢 UPSIDE SCENARIO – BULLISH REVERSAL
• Breakout / Confirmation Level: ₹720.00 (Entry above 720)
• Confirmation Required: Weekly candle close above ₹720.00
• Entry Zone: Above ₹720.00
• Target 1: ₹800.00 (+11.11% move from entry / GAP Resistance & Round Level 800)
• Target 2: ₹850.00 (+18.05% move from entry)
• Target 3 / Round Level Target: ₹900.00 (+25.00% move from entry / Round Level 900)
• Major Resistance Zone: ₹920.00 – ₹950.00 (Previous Breakdown Level)
🔴 DOWNSIDE SCENARIO – BEARISH BREAKDOWN
• Weakening Level: Loss of immediate support at ₹690.00
• Breakdown Level: Below major low at ₹681.90
• Important Support Levels: ₹708.25 , ₹681.90 (Major Base Low), ₹652.75 , and ₹640.00
• Invalidation: A weekly candle close below ₹652.75 invalidates the bullish RSI divergence and W-pattern thesis.
🔹 MY BREAKOUT & EXIT RULE
If price crosses above a key resistance level (such as ₹800.00, ₹850.00, or ₹900.00) and makes a High above that level, but closes below that same level, I consider it a failed breakout/rejection and the BUYER NEEDS TO EXIT THE TRADE.
High above level + Close below level = Failed breakout → EXIT BUY TRADE.
🎯 MY TRADE ROADMAP
Bullish Reversal Path:
₹720.00 Breakout / Base Confirmation Entry
↓
₹750.00 – ₹760.00 Trendline Resistance
↓
₹800.00 – Target 1 (11.11% / GAP Resistance & Round Level)
↓
₹850.00 – Target 2 (18.05%)
↓
₹900.00 – Target 3 (25.00% / Round Level 900)
↓
₹920.00 – ₹950.00 Major Overhead Breakdown Supply Zone
Bearish Breakdown Path:
Rejection near ₹720.00
↓
₹708.25 Current Level
↓
₹681.90 Major Base Low
↓
₹652.75 Key Invalidation Support
🔑 MY VIEW
The preferred technical setup favors a bullish reversal, provided price delivers a confirmed breakout above ₹720.00. The chart structure suggests a potential W-pattern bottom formation combined with bullish RSI divergence along the lower support region.
The bullish thesis strengthens once price trades and closes above ₹720.00, opening the path toward ₹800.00 (Target 1), ₹850.00 (Target 2), and ultimately the psychological round level at ₹900.00 (Target 3). The setup weakens if price fails to clear ₹720.00 and breaks below the primary base support at ₹681.90 / ₹652.75. The breakout is considered confirmed only with a proper weekly candle close above key trigger levels, strictly adhering to the candle-close exit rule if a rejection occurs.
---
This is technical analysis based on chart structure, price levels, and visual patterns shown above. It is not financial advice. Market conditions can change and actual price movement may differ from projected levels.  Long
Long
Rishabh Instruments Ltd - Breakout Setup, Move is ON...#RISHABH trading above Resistance of 769
Next Resistance is at 1137
Support is at 601
Here are previous charts:
This weekly chart for Rishabh Instruments Limited displays a strong bullish breakout from a consolidation pattern, supported by significant volume and structural trendline context.
Chart Overview
Timeframe & Asset: Rishabh Instruments Limited (1-Week Chart, NSE).
Current Price: 829.60 INR (+12.34% change shown on the chart header).
Key Technical Observations
Horizontal & Channel Breakout: The stock consolidated within a downward-sloping mini-channel (white lines) and horizontal range before breaking out above 295.00 INR, marked by the yellow Breakout arrow.
Volume Expansion: The blue arrows highlight substantial surges in trading volume during the initial breakout phase and the subsequent upside continuation, confirming strong institutional buying conviction.
Support Levels:
295.00 INR (Yellow Line): The horizontal level corresponding to the initial breakout point and dynamic base support.
491.00 INR (Green Line): An earlier structural resistance level that previously defined Resistance 1 before converting into intermediate support.
601.00 INR (Red Line): A major horizontal level (marked with a red arrow) that previously acted as resistance before flipping to become the primary structural support level on recent pullbacks.
Resistance Levels:
Resistance 1 (491.00 INR): An earlier structural resistance level that has since been surpassed and converted into support.
Resistance 2 (769.00 INR): A structural resistance level (green line) that the current price candle has tested and breached to trade at 829.60 INR.
Resistance 3 (1,137.00 INR): The long-term upside projection level marked near the top green line.
Long-Term Trend Lines: The solid white lines form a multi-month falling channel from which the stock staged a structural reversal, with price action now accelerating into a strong macro expansion.
Conclusion & Current Price Action
The current price action reflects strong bullish momentum following the volume-backed breakout above 295.00 INR and a successful retest of the 601.00 INR support zone. The stock has recently cleared its immediate hurdle at Resistance 2 (769.00 INR).
A sustained weekly close above this Resistance 2 zone indicates room for extended upside toward the long-term upside projection level of 1,137.00 INR (Resistance 3). On any potential pullbacks, the 601.00 INR level will serve as the primary line of defense for buyers to keep the structural uptrend intact.
A parallel channel (also known as an ascending, descending, or horizontal channel) is a technical analysis pattern bounded by two parallel trendlines that encompass a security’s price action over time.
Structure & Mechanics
Main Components:
Trendline / Base Line: Connects a series of prominent reaction lows (in an uptrend) or reaction highs (in a downtrend).
Channel Line: Drawn parallel to the trendline, connecting the peaks (top boundary) or troughs (bottom boundary).
Price Movement: Price oscillates between the upper boundary (which acts as dynamic resistance) and the lower boundary (which acts as dynamic support).
Types of Channels
Ascending Channel (Bullish): Characterized by higher highs and higher lows. Indicates a steady uptrend where buying pressure dominates.
Descending Channel (Bearish): Characterized by lower highs and lower lows. Represents a controlled downtrend or corrective pullback.
Horizontal Channel (Consolidation): Moving sideways between static support and resistance lines, signaling market indecision or range-bound trading.
How Traders Use Parallel Channels
Trading Within the Range: Buying near the channel's lower boundary (support) and selling or shorting near the upper boundary (resistance).
Breakout Trading: A strong, high-volume candle breaking outside either boundary signals potential trend acceleration or continuation in the direction of the breakout (as seen in the charts provided previously).
Midline (50% Line): Often, a dashed line is drawn down the middle of the channel. Price reacting to this midline can confirm the channel's validity and act as interim support or resistance.
Disclaimer: This is for demonstration and educational purpose only. This is not buying or selling recommendations. I am not SEBI registered financial advisor. Please consult your financial advisor before taking any trade.  Long
Long
NIFTY 1D: Structural Break and Retest Leading Exhaustion climax### 📊 Executive Summary & Market Structure
This technical analysis details a structural regime shift on the daily (1D) chart of the Nifty 50 Index (NSEI). Following an extended, high-momentum advance supported by an ascending trendline, price action has transitioned into a corrective bear sequence. This breakdown has systematically executed a textbook series of classical structural principles: the violation of an ascending demand line, a structural support breach via a breakaway gap, a polar role reversal, and a terminal downside capitulation marked by a contrarian exhaustion gap.
### 📉 Phase 1: Trendline Violation & Breakaway Gap Execution
- **Trendline Breach:** The long-term ascending support line, which previously anchored the intermediate bull market, was cleanly violated on a daily closing basis, signaling structural weakness.
- **Support Area Breach:** Following the trendline violation, price action formed a horizontal distribution zone. A subsequent surge in downside momentum generated a clean **Breakaway Gap** straight through this crucial horizontal support floor.
- **Market Psychology:** In classical price theory, a breakaway gap signifies a profound overnight shift in supply/demand dynamics, leaving an unpopulated price void that confirms the initiation of a new intermediate downtrend.
### ➡️ Phase 2: The Principle of Polarity (Support Becomes Resistance)
- **Structural Role Reversal:** Following the immediate panic of the breakaway gap, a localized, low-volume technical bounce occurred.
- **The Retest:** As dictated by the **Principle of Polarity**, once a major horizontal support area is decisively broken, the underlying psychology flips—former demand transforms into overhead supply. As annotated on the chart, the index staged a precise return move back to this specific boundary. The zone successfully held as new overhead resistance, rejecting the counter-trend advance and validating the bear regime.
### ⚠️ Phase 3: The Exhaustion Gap & Contrarian Market Extreme
- **The Climax:** Following the polar rejection, aggressive selling resumed, culminating in a secondary downward price gap at the absolute terminus of the swing leg.
- **Contrarian Mechanics:** This terminal price void is classified as an **Exhaustion Gap**. Unlike its breakaway counterpart, an exhaustion gap occurs at the tail-end of a rapid, vertical price descent. It represents the final capitulation of late-stage sellers and forced margin liquidations.
- **Market Extreme:** This behavior creates a textbook market extreme. Because exhaustion gaps signify the final flushing of market participants, they are highly contrarian in nature and naturally tend to recover or fill rapidly as buying interest emerges in an oversold structural vacuum.
### 🎯 Tactical Conclusion & Validation Plan
The emergence of the downside exhaustion gap indicates that the current immediate down-leg has achieved a near-term selling climax.
- **Bullish Confirmation:** A rapid, daily close within or above the exhaustion gap window will trigger a classic island/cluster reversal setup, confirming the exhaustion floor and opening the door for a counter-trend relief rally.
- **Bearish Continuation:** Should price action fail to fill this gap within the next few sessions, the structural thesis must adapt to treat this price action as a runaway/measuring gap, expanding the downside target.
*Disclaimer: This analysis is published strictly for educational and CMT professional profile tracking purposes and does not constitute formal financial advice.*
BTC/USD 45M Long Setup and Market Structure Analysis Current Structure
BTC is showing a short term bearish structure, but buyers have defended the 76,400 to 76,800 demand zone strongly. After the sharp rejection from the lows, price has stabilized around 77,300 to 77,500.
This suggests that sellers are losing momentum and buyers may be preparing for another push higher.
Long Entry Zone
Aggressive Entry: 77,250 to 77,550
Safer Entry: Wait for a breakout above 77,600 to 77,800, followed by a successful retest.
A clean retest of 77,600 to 77,700 as support would provide stronger confirmation for the long.
Stop Loss
Conservative SL: 76,750
Structural SL: 76,350
The structural stop should be below the major swing low because a break of this area would significantly weaken the bullish setup.
Take Profit Targets
TP1: 77,800
TP2: 78,200 to 78,400
TP3: 78,800 to 79,000
TP4: 79,200 to 79,600
The 78,200 to 78,600 area is particularly important because previous price action suggests significant resistance there.
Trade Confirmation
Price holds 76,800
Price breaks 77,600 to 77,800
45M candle closes above resistance
Price retests the breakout zone
Buyers defend the retest
Price continues toward 78,200 and higher
Invalidation
If BTC repeatedly rejects 77,600 to 77,800 and then breaks below 76,800, the long setup becomes weak.
A decisive break below 76,400 would invalidate the bullish reversal idea and could open the way toward 76,000 or lower.
Professional Bias
The preferred setup is:
Break 77,800
Retest 77,600 to 77,700
Hold the retest
Long
TP 78,200
TP 78,600
TP 79,000+
The key level to watch is 77,600 to 77,800. Until BTC confirms a breakout above this zone, patience is preferable to chasing the current price.
Risk management is essential because the 45M structure has not completely turned bullish yet.  Long
Long
MCX — A Perfect Gravestone Doji at Major Resistance!!!There are some candles that deserve attention, and then there are candles that appear exactly where they matter. This is one of those charts.
On the weekly timeframe, MCX has formed what looks like a Gravestone Doji right at a major descending resistance trendline. But the real story is not just the candle itself — the location of the candle is what makes this setup interesting.
MCX has rallied strongly from the lower portion of the structure and moved back toward the upper boundary of the descending channel. At the same time, price is approaching the previous major high zone around ₹3,471.
Look closely at the latest candle. Buyers pushed the price significantly higher during the week, but those higher levels were rejected, and the price came back down toward the opening area by the close. That long upper wick shows clear rejection from higher prices.
A Gravestone Doji by itself is not enough to call a reversal. Context matters.
Here, we have multiple factors coming together at the same zone — a strong rally, a descending resistance trendline, the upper boundary of the structure, the previous major high, and now a Gravestone Doji.
That combination is what makes this chart worth watching.
Now, I don't want to predict what happens next. I want the market to confirm it.
If MCX starts trading below the Gravestone Doji's low and follows through with weakness, the rejection from this resistance zone becomes much more meaningful. On the other hand, if price breaks above the resistance and sustains there, then this bearish signal could simply become a temporary rejection, and the structure would need to be reassessed.
This is exactly why I believe confirmation is more important than prediction.
For me, the beauty of this chart isn't simply the Gravestone Doji. It's the combination of price structure, trendline, previous resistance and candlestick behaviour coming together at the same location.
One candle doesn't decide the trend.
But when a significant candle appears at a significant level, it can give us a very important warning.
So I’m not trying to guess whether MCX will go up or down from here.
I’m watching how price reacts around this resistance.
The market has reached a decision zone.  Short
Short
SMALL-CAP INDEX:Expanding Channel + Dragonfly Doji + Key SupportThe Small-Cap Index is currently moving within a well-defined rising/expanding channel, and the price action is giving us some very interesting clues.
What caught my attention is the repeated formation of Dragonfly Dojis near the lower boundary of the channel.
🕯️ What does a Dragonfly Doji tell us?
Sellers initially push the price lower, but buyers step in and absorb that selling pressure, bringing the price back toward the opening level.
But remember:
A candlestick pattern by itself is NOT a signal. Its location and confirmation are what matter.
Here, the Dragonfly Dojis are appearing around an important channel-support area, making the reaction much more significant.
📐 The bigger picture — CHANNEL STRUCTURE
The index has been respecting the channel with a repeated rhythm:
Lower Channel Support → Bounce → Upper Channel Resistance → Pullback → Support
We've already seen previous reactions from the lower trendline followed by meaningful upside moves.
At the same time, the recent movement toward the 20,100–20,200 zone brought the index closer to the upper portion of the channel, where we are now seeing signs of rejection.
🎯 So what am I watching now?
🟢 Bullish scenario:
If the lower channel continues to hold and buyers defend the support zone, the index could potentially continue its movement toward the upper channel.
🔴 Bearish scenario:
If the lower channel support is decisively broken and price fails to reclaim it, the current structure starts weakening—and we need to reassess the entire setup.
🧠 THE REAL LESSON
Don't trade a Dragonfly Doji simply because it is called a Dragonfly Doji.
Study:
Candlestick + Location + Trendline + Channel + Price Structure + Volume + Confirmation
That's where the real information is.
The candle tells us what happened.
The structure tells us where it happened.
The next candles tell us whether the market agrees.
I've marked the important levels and formations on the chart so you can visually understand the entire structure.
No prediction. No blind bias. Just price action, evidence and confirmation.
Let's see whether this channel continues to hold—or whether the Small-Cap Index finally breaks the structure. 📈📉
Save this chart. The next few sessions could be very interesting.  Long
Long
XAUUSD – Gold Holds 4,279, Bigger Breakout Still Possible XAUUSD – Gold Holds 4,279, Bigger Breakout Still Possible
Gold is closing the week at a very important technical area.
On the 12H chart, price is trading around 4,349 after a strong rejection from the recent upper zone near 4,697. The market has already broken above the previous long-term downtrend line, which is an important structural change. However, after that breakout, gold has not continued directly higher. Instead, price is now pulling back and testing whether the broken structure can become support.
This is the key point for me: gold is no longer in the old clean downtrend, but buyers still need to prove that the breakout is real.
Technical structure:
Gold broke above the long-term downtrend line.
After reaching the 4,600 – 4,697 area, price started to correct.
The current reaction zone is around 4,279 – 4,350.
This area is important because it sits near Fibonacci support and the previous breakout zone.
If buyers defend this area, gold may create a higher-low structure.
The first confirmation for recovery is a break back above 4,509.
A stronger medium-term bullish confirmation comes above 4,697.
If gold fails to hold 4,279, price may retest the deeper support zone near 4,000 – 3,950.
Key levels to watch:
Current price: 4,349
Short-term reaction area: 4,279 – 4,350
Strong support / buy reaction zone: 4,000 – 3,950
First recovery confirmation: 4,509
Medium-term bullish confirmation: 4,697
Upside target after confirmation: 4,850 – 5,000
Main scenario:
If gold holds above 4,279 and forms a bullish reaction, buyers may try to rebuild momentum toward 4,509.
A clean break above 4,509 would show that the correction is losing strength.
If price later breaks above 4,697, the medium-term bullish structure becomes much clearer, and gold may continue toward the 4,850 – 5,000 area.
Alternative scenario:
If gold fails to hold 4,279 and closes below this area, the recovery structure becomes weaker.
In that case, the market may need one deeper liquidity sweep toward 4,000 – 3,950 before buyers return with stronger confirmation.
Hannah’s view:
Gold is standing between two important stories.
The first story is bullish: price has already broken the long-term downtrend, and if buyers defend the current support, this pullback can become a healthy retest before continuation.
The second story is cautious: gold has not yet confirmed a strong continuation above 4,509 and 4,697, so chasing the market too early is risky.
For now, I prefer to watch the reaction around 4,279 – 4,350. If this zone holds, the recovery setup remains valid. If it fails, gold may need a deeper correction before the next bigger bullish attempt.
Main view: gold can still build a medium-term bullish recovery, but only if buyers defend the current support and reclaim 4,509. No confirmation means no trade.
Do you think gold will defend this breakout retest zone, or will price sweep deeper before the next recovery?
 Short
Short
NIFTY IT — A Massive Inverse H&S Is Taking Shape???NIFTY IT — A Major Inverse Head & Shoulders Is Taking Shape 👀
NIFTY IT is showing a potential Inverse Head & Shoulders (IH&S) pattern on the weekly timeframe.
The structure is quite clear — a left shoulder around ₹27,500–₹28,000, a deeper head near ₹25,700, and a right shoulder developing around the ₹27,500–₹28,000 zone.
The key level is the ₹32,000 neckline.
A decisive breakout and sustained move above ₹32,000 could confirm the pattern and potentially open the way toward the ₹38,000+ zone, based on the approximate measured move.
But I’m not anticipating the breakout.
Breakout → Sustain → Confirmation → Follow-through.
Until then, this remains a developing structure.
What makes this chart interesting is that NIFTY IT could be quietly building a major reversal structure after a prolonged period of weakness.
Now the market has to prove it.
₹32,000 is the level to watch. 📈  Long
Long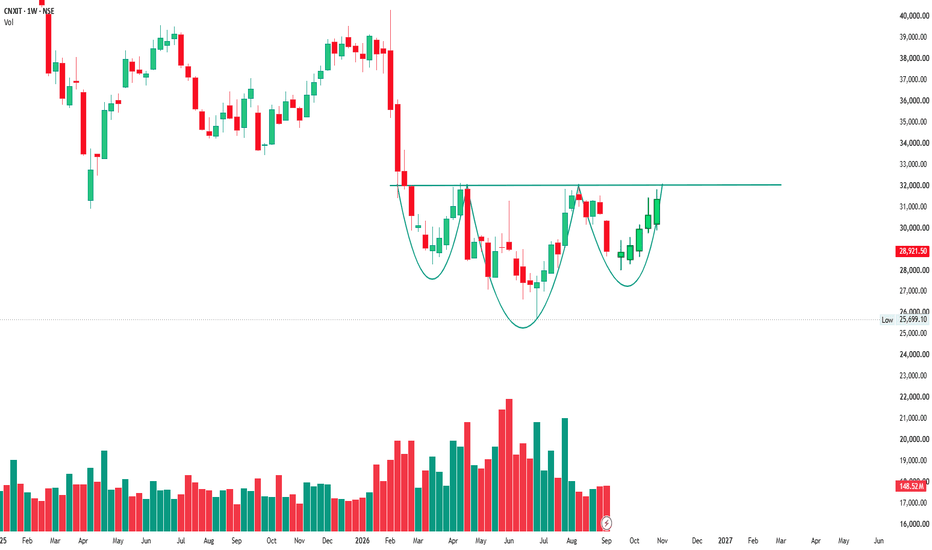
BRIAN XAUUSD – GOLD BREAKS LOWER, 4,242 IS NEXT VALUE BRIAN XAUUSD – GOLD BREAKS LOWER, 4,242 IS NEXT VALUE
Gold has shifted back into a weak technical structure after failing to recover above the previous value areas.
From the chart, the market already rejected strongly from the upper distribution zone around 4,596. After that rejection, price rotated lower and failed again near the Sell Scalping POC around 4,474. This confirms that sellers are still active at higher value, and the current move is not a clean bullish recovery.
Gold is now trading around 4,349, below the short-term resistance structure. The next important area is not above the market, but below it.
The key question now is whether gold will complete the next downside auction into the 4,242 value zone before buyers react again.
Technical structure
On the H4 chart, gold is still moving lower after losing momentum from the high-value distribution area.
The Sell POC around 4,596 remains the major upper resistance. This is the zone where the previous bullish leg failed and where sellers started to regain control.
Below that, the Sell Scalping POC around 4,474 acted as the second rejection area. Price attempted to recover but could not hold above this level. That makes 4,474 a key resistance if gold rebounds again.
Current price is now around 4,349, and the market is approaching the Buy Scalping POC around 4,242. This zone is important because it represents the next lower value area where buyers may attempt a reaction.
If 4,242 fails, the next downside areas are 4,113 and 4,047. These are deeper value supports and could become stronger buyer reaction zones if selling pressure continues.
Important zones
Current price area: 4,340 - 4,355
Gold is trading under pressure after losing higher value.
Sell Scalping POC: 4,465 - 4,480
Short-term resistance if gold rebounds.
Major Sell POC: 4,585 - 4,600
Main upper distribution zone and strong seller area.
Buy Scalping POC: 4,235 - 4,250
Next downside value target and first important buyer reaction zone.
Buy Scalping Zone: 4,105 - 4,120
Deeper buyer reaction area if 4,242 fails.
Buy Zone POC: 4,040 - 4,055
Major lower value support.
Trading scenario
Priority view: sell on recovery below 4,474
Entry:
Look for sell positions only if gold rebounds toward 4,465 - 4,480 and shows clear bearish rejection.
Stop Loss:
Above the rejection high or above the 4,474 POC resistance zone.
Take Profit:
TP1: 4,300
TP2: 4,242 - 4,250
TP3: 4,113 if bearish momentum expands
This setup follows the current market structure. Sellers already rejected the higher POC zones, so the cleaner plan is to wait for a recovery into resistance instead of selling late near the lows.
Alternative buy scenario
A buy setup is only interesting if gold reaches 4,242 - 4,250 and forms a strong bullish rejection.
Entry:
Buy only after confirmation from the Buy Scalping POC zone.
Stop Loss:
Below the local sweep low or below the buyer reaction zone.
Take Profit:
TP1: 4,300
TP2: 4,350
TP3: 4,465 - 4,480 if buyers reclaim momentum
If 4,242 breaks without reaction, I would not force the buy. In that case, gold may continue lower toward 4,113 or even 4,047 before finding stronger demand.
Final view
Gold is still under seller control after rejecting from the 4,596 major POC and failing again near 4,474.
The short-term direction is bearish while price remains below 4,474. The next important downside target is 4,242, where buyers may attempt the next reaction.
For me, the map is simple:
Below 4,474 = sellers remain in control.
Reject 4,474 = downside continuation stays valid.
Reach 4,242 = watch for buyer reaction.
Lose 4,242 = 4,113 becomes the next target.
Break above 4,474 = bearish pressure weakens.
Gold is not in a strong buy zone yet. The better plan is patience: wait for a clean rejection from resistance, or wait for price to reach the lower value zone before looking for buyer confirmation.
Will gold complete the move into 4,242 first, or will buyers reclaim 4,474 and change the short-term structure?
Short 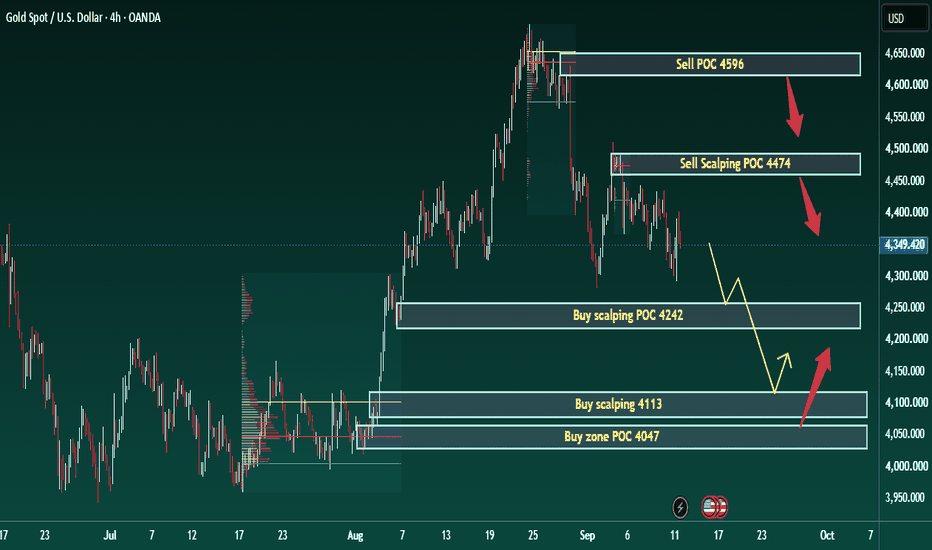
 Long
Long
 Long
Long
 Long
Long
XAUUSD H4: 4,240 Holds the Recovery Story XAUUSD H4: 4,240 Holds the Recovery Story
Market Context
Gold is trading around 4,349 after a strong correction from the recent high area.
The market is no longer in clean bullish continuation mode. Price has failed to hold the upper structure and is now moving below the short-term descending pressure line. This shows that sellers are still active, especially after the rejection from the higher zone.
However, the bigger recovery structure has not fully broken yet. Gold is still trading above the rising HTF trendline and above the main bullish demand area. That means the market is in a decision phase, not a confirmed bearish collapse.
Technical Structure
On the H4 chart, gold created a strong bullish leg from the July-August base, but the latest movement shows a clear slowdown.
Price rejected from the upper zone and is now trading below the OB / FVG Sell Order area. The first important resistance is around 4,400 - 4,460. If gold rebounds into this area and fails, sellers may use it to continue the correction.
Above that, 4,511 remains the buy-side liquidity level. A clean break above 4,511 would be the first sign that buyers are regaining control.
Below current price, the most important area is the OB Buy Zone around 4,240 - 4,260. This zone also sits close to the rising trendline, making it a major decision area for the next move.
If buyers defend 4,240 - 4,260, gold may form a higher-low reaction and recover back toward 4,400 - 4,460. But if this zone breaks, the next deeper support is the Strong OB around 4,080 - 4,110.
Key Levels
Current Price: 4,349
Short-term Liquidity: 4,293
Main OB Buy Zone: 4,240 - 4,260
Strong OB Support: 4,080 - 4,110
OB / FVG Sell Order: 4,400 - 4,460
Buy-side Liquidity: 4,511
Bullish Confirmation: Above 4,511
Bearish Continuation: Below 4,240
Trading Plan
Primary Buy Reaction
Entry: 4,240 - 4,260 after bullish confirmation
SL: Below 4,200
TP: 4,293 / 4,400 / 4,460
Condition: Price must sweep into the OB Buy Zone and show a strong bullish reaction. This is the main area where buyers need to defend the recovery structure.
Primary Sell Scenario
Entry: 4,400 - 4,460 after bearish confirmation
SL: Above 4,511
TP: 4,293 / 4,260 / 4,240
Condition: If gold rebounds into the OB / FVG Sell Order zone and fails to break higher, sellers may return and push price back toward the main buy area.
Breakout Buy Scenario
Entry: Above 4,511 after breakout and retest
SL: Below 4,460
TP: 4,560 / 4,600 / 4,650
Condition: Buyers must break above the buy-side liquidity level and hold it. Only then does the short-term bearish pressure begin to weaken.
Breakdown Sell Scenario
Entry: Below 4,240 after breakdown and retest
SL: Above 4,293
TP: 4,180 / 4,110 / 4,080
Condition: Gold loses the OB Buy Zone and fails to reclaim it. This would confirm that the recovery structure is broken and the market may rotate into deeper demand.
Overall Bias
Gold is under short-term bearish pressure, but the larger recovery is not dead yet.
The key battle is between 4,400 - 4,460 resistance and 4,240 - 4,260 support.
If gold rejects from the sell order zone, the next target is the OB Buy Zone around 4,240. If buyers defend that zone, the recovery can restart. But if 4,240 breaks, sellers may drag price toward 4,080 - 4,110.
Best approach: do not chase the market in the middle. Wait for price to either react clearly from 4,240 - 4,260 or reject from 4,400 - 4,460.
Will buyers defend 4,240 and rebuild the recovery, or will sellers break the structure and send gold deeper?
Short 
Cup and Handle / Structural Supply Zone BreakoutChemcon Speciality Chemicals is exhibiting a high-conviction bottoming and re-accumulation structure on the daily chart. Following a major recovery from its April lows, the stock has developed a multi-month Cup and Handle pattern. Price is currently probing directly into a major historical horizontal supply zone (₹220–235), backed by rising relative strength and constructive higher-low handle formations.
Technical Observations
Cup and Handle Formation: As highlighted by the purple dashed curves on image_6544ec.png, the stock formed a rounded macro cup base from April through June, followed by a succession of two shallower, higher-low handles. This structural progression signals strong supply absorption prior to testing major resistance.
Testing Major Horizontal Supply Zone: The price is pressing into the prominent overhead supply box between ₹220 and ₹235, which historically acted as a breakdown point and prior resistance. A decisive daily close above this zone clears the path for a strong Stage 2 markup phase.
Ascending Relative Strength (RS): The RS indicator at the bottom has broken firmly into the green zone and is trending upward sharply, signaling accelerating outperformance against the broader market index as the pattern nears completion.
Higher Lows Structure: The successive handle contractions have established a clear series of higher pivot lows (~₹165 in July and ~₹185 in August), indicating that buyers are aggressively stepping in at higher levels.
Immediate Price Action: The recent impulse candle reached a high of ₹222.00, confirming that demand is actively testing the ceiling of this accumulation structure.
Key Levels
Immediate Support: ₹200–205 (Immediate Consolidation Shelf / Handle Pivot)
Major Support Zone: ₹180–185 (Secondary Handle Support Floor)
Breakout Pivot: ₹225–230
Target 1: ₹260 (Intermediate Structural Target / Swing Peak)
Target 2: ₹285–300 (Macro Cup Pattern Measured Move Extension)
Trade Plan & Entry Tactics
Option 1 - Conservative Breakout Entry (Recommended): Wait for a decisive daily closing candle above ₹225–230 on expanding volume. This filters out false intraday wicks at the supply wall and confirms overhead supply is fully absorbed, though entry will be at a slightly higher cost basis.
Option 2 - Anticipatory Handle Entry: Position building within the current handle range (around ₹210–217) or on minor pullbacks near ₹205. This offers a tighter stop-loss and better risk/reward ratio, but carries the risk of price rejection at resistance or extended sideways time-decay inside the handle.
Option 3 - Staggered / Retest Approach: Take a 50% starter position inside the handle (~₹210–217) and add the remaining 50% only after a confirmed daily close above ₹225–230 (or on the first low-volume pullback retesting ₹225 as new support).
Stop-Loss (SL): Placed on a daily closing basis below ₹195 (safely below the handle support shelf).
Summary
CHEMCON displays several classical technical characteristics of a Stage 1 base breakout candidate: a well-defined Cup and Handle pattern, higher-low handle contractions, rising relative strength, and a direct test of a major supply boundary. While buying inside the handle offers higher risk/reward, waiting for a confirmed daily close above the ₹225–230 supply zone provides maximum probability for an immediate Stage 2 markup expansion.
Disclaimer: Educational purpose only. Not a recommendation to buy or sell securities. Please manage risk appropriately.  Long
Long


