Gold 1H: Buy 4,335 or Break 4,385?
Market Overview
• Macro Driver: Spot Gold consolidates near $4,357 on Friday, September 18, 2026, preserving gains following an aggressive post-FOMC short squeeze earlier in the week. With US Treasury yields leveling off and the US Dollar Index (DXY) consolidating as the Fed delivered an expected status quo policy rate, global traders are actively digesting fresh macro catalysts—including today's preliminary Michigan Consumer Sentiment data—to gauge consumer inflation expectations for Q4.
• Market Condition: Institutional order flow shows an active re-accumulation cycle. Following the major sell-side liquidity sweep at the 4,235 – 4,260 Demand Zone, smart money initiated a massive displacement wave that generated multiple Bullish CHoCH and BOS breaks. The current intraday correction represents a calculated pullback into internal discount imbalance arrays to fuel the next leg up.
Technical Context
• Structure: Institutional Bullish Expansion / OTE Retest. On the 1H timeframe, Gold executed an impulsive V-shaped recovery off the 4,235 floor, breaching prior swing highs up to 4,380 before stalling at the Intermediate Supply Block.
• Liquidity & Imbalance: Price is currently printing an orderly corrective retracement from 4,380 (current market price: 4,357.245). The technical projection anticipates a downward drift into the confluent FVG + FIBO 0.5–0.618 discount mitigation zone (4,332.000 – 4,345.000). A confirmed absorption here is positioned to drive a breakout through the Intermediate Supply block (4,368.000 – 4,385.000) and expand aggressively toward the Upper Macro Supply Ceiling (4,420.000 – 4,435.000).
Key Zones
• Macro Upper Supply Ceiling (Target Blue Box): 4,420.000 – 4,435.000
• Intermediate Supply Block (Middle Blue Box): 4,368.000 – 4,385.000
• Immediate Market Price: 4,357.245
• Confluent FVG + FIBO 0.5–0.618 Retest Zone (Grey Box): 4,332.000 – 4,345.000
• Structural Fib 0.382 Base: 4,322.000
• Major Demand Zone Floor (Bottom Grey Box): 4,240.000 – 4,265.000
Trading Plan (IF–THEN)
• IF price completes the corrective pullback into the 4,332.000 – 4,345.000 FVG + Fibo 0.5–0.618 confluence block AND validates lower-timeframe (M5/M15) bullish rejection displacement/CHoCH -> THEN look to execute Long positions, targeting 4,380 and expanding directly toward the 4,420.000 – 4,435.000 Upper Macro Supply Ceiling.
• IF price delivers a decisive 1H candle close below 4,320 -> THEN the bullish continuation setup is delayed, exposing a deeper retest toward the 4,285 discount level.
MMFLOW View
• Bias: Pro-Trend Bullish Retest. Chasing greens directly inside the 4,370–4,380 intermediate supply block carries poor risk-to-reward; the institutional mathematical edge favors waiting for confirmed demand mitigation inside the FVG + Fibo 0.5–0.618 discount array before riding the expansion wave.
Are you looking to buy the 4,335 FVG mitigation, or waiting for a clean 1H breakout above 4,385?  Long
Long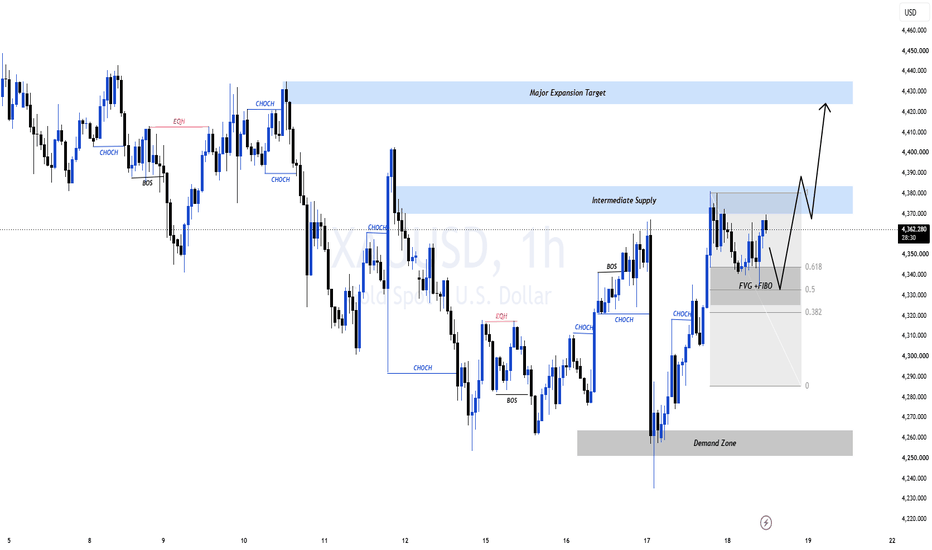
XAUUSD / GOLD – 30-Minute Buy Limit ProjectionGold is moving within a bullish parallel channel. The 4,358–4,362 zone is an important confluence area, supported by the rising trendline and 0.618 Fibonacci level at 4,359.46.
Trade Projection:
Buy Limit Zone: 4,358–4,362
Stop Loss: 4,341
TP1: 4,381 — Partial Close
TP2: 4,400–4,402
The 4,400 zone has formed a double top, so profit booking is recommended near this resistance. Take the entry only Long 
Key Structure Level ETHUSDTCurrent Price Action: The price is actively consolidating between a prominent Descending Trend Line (acting as immediate resistance) and a multi-week Ascending Trend Line (acting as long-term support).Major Support Zones:$2,357.20: Labeled explicitly on the chart as Major Support. This aligns near the inflection point where the ascending trend line meets historic structural demand.$2,316.40: A secondary fallback cushion if the primary support fails.Resistance Levels:$2,471.60: The near-term ceiling keeping the price suppressed.$2,566.00: The critical macro swing-high horizontal resistance target.📊 Volume & Momentum IndicatorsVolume Trend: The Simple Volume bars at the bottom show distinct spikes during major upward moves, followed by noticeably tapering volume as the price funnels inside the triangle pattern. This signature drop-off indicates a lack of aggressive selling pressure, but suggests that the market is waiting for a volatility catalyst before committing to a definitive breakout.📉 Strategic Frameworks & ScenariosSymmetrical triangles are inherently neutral patterns that resolve in explosive continuations or reversals once broken. Because single-crypto pairs are highly volatile, it is essential to manage risk tightly to avoid total capital losses.Bullish Continuation (Breakout): If the price manages a strong, high-volume close above the Descending Trend Line (~$2,470), look for a fast retest of the horizontal structural zone around $2,566.00.Bearish Breakout (Reversal): If the price breaks down through the Ascending Trend Line and the $2,357.20 Major Support, it signals an invalidation of the short-term bullish thesis, leaving the $2,316.40 zone open as the next target.  Long
Long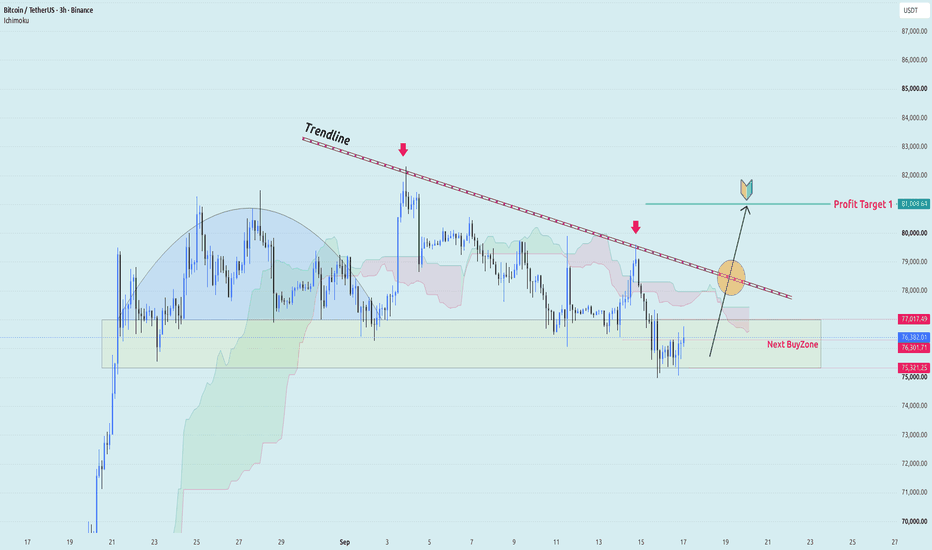
XAU/USD - Breaks Trendline, Buyer Eye 4,530OANDA:XAUUSD is showing its first meaningful change in structure after pushing above the long descending trendline. Price is still holding inside the 4,290–4,360 buy zone, so the next confirmation is simple: buyers need to keep this area from turning back into resistance.
If the breakout holds and Gold builds above 4,360, I’m watching:
🎯 Target: 4,530
Macro Market: The backdrop has improved for Gold. Oil prices are easing and the US 10-year Treasury yield has pulled back to around 4.94%, reducing some of the pressure on non-yielding assets. Gold has already benefited from lower yields and a softer Dollar.
A sustained H2 move back below 4,290 would weaken the breakout setup.
AURICVERSE View: this is more interesting than another simple bounce from support. The trendline is finally being challenged from above. If buyers can turn 4,290–4,360 into a base, 4,530 becomes the next level in focus. Long 
 Long
Long
 Long
Long
NIFTY — Wedge Breakdown Confirmed, Major swing Support in FocusOverview
Nifty closed the week at 23,398.10, down 499.60 points or 2.09%, extending the sharp breakdown from recent weeks. Price has now broken decisively below the entire wedge structure and multiple support zones, with the multi-month rising trendline support the next major level in sight.
Follow-up on Last Week's View
Last week we flagged Nifty needing strength above 24,050 for a bullish case, with a break below the trendline and Immediate Support opening the door lower. That bearish path has played out in full, price broke through 23,818, then 23,600, and this week's low of 23,231.40 has pushed well past the 0.5 Fib level (23,478.45) too, confirming the Rising Wedge has resolved firmly to the downside.
Pattern Explanation
The Rising Wedge breakdown is now well underway, with price cutting through three support-turned-resistance zones in quick succession (23,818, 23,600, and 0.5 Fib at 23,478). The next meaningful level is the rising Trendline Support, which is converging with the 0.618 Fib (23,172.60) in the coming weeks, a genuine confluence zone worth watching closely.
Key Levels
Resistance 3: 23,818
Resistance 2: 23,600
Resistance 1 / 0.5 Fib: 23,478
Support (Trendline + 0.618 Fib confluence): 23,172
Major Support: 23,070.15
Deeper Fib: 0.786 (22,737.20)
Scenarios
Bullish: If Nifty reclaims 23,600 with strength, it would suggest this leg of selling is exhausting, and price could work back toward 23,818 and the 0.382 Fib (23,784).
Bearish: If Nifty closes below the trendline and 0.618 Fib confluence (23,172), it would confirm the breakdown is extending, with Major Support (23,070) as the immediate test, and 0.786 Fib (22,737) as a deeper target if weakness continues.
Beginner's Lesson
A trendline that's held for many months, like this one since March, carries real weight when it's finally tested after a sharp breakdown. The fact that it's now converging with a Fibonacci level (0.618) makes this an even stronger confluence zone. These multi-month structural tests often produce either a strong bounce (since so many traders watch the same level) or a decisive breakdown that accelerates the move, either way, it's a zone worth paying close attention to rather than ignoring.
Conclusion
Nifty has confirmed a clean wedge breakdown, cutting through multiple support zones in just a couple of weeks. The focus now shifts to the Trendline + 0.618 Fib confluence near 23,172, an important test for the broader uptrend structure. Holding this zone would keep the bigger picture intact; losing it would open the door toward deeper Fib levels and Major Support.
This is for educational purposes only and not investment advice. Please do your own research or consult a financial advisor before making any trading decisions.  Short
Short
XAUUSD – H2 Bullish Recovery Toward Supply
XAUUSD is trading around 4,354 after extending its recovery from the lower structural area. Price has broken above the recent descending trendline and printed an MSS, showing that short-term buyer momentum is improving. However, gold is now entering the first resistance / supply zone, so a controlled pullback may be needed before the next expansion.
Gold gained more than 2% on Thursday as the U.S. dollar weakened, oil prices eased and Treasury yields pulled back. Spot gold was still around 4,361 early Friday, while the U.S. 10-year yield moderated to roughly 4.94% and Brent slipped toward $103.77.
The broader macro backdrop remains restrictive. The Fed raised rates by 25 bp to 3.75%–4.00%, and 16 of 18 policymakers still expect at least one additional hike this year. That keeps higher real yields and a stronger-dollar risk in play even as gold attempts to recover.
Technical View
The H2 chart shows a meaningful recovery from the lower trendline structure around 4,260–4,280.
Price has now pushed back above the descending trendline and printed a bullish MSS, which weakens the immediate bearish momentum.
The first important obstacle is the 4,355–4,380 Resistance / Supply Zone. Because price is already testing this area, chasing the rebound offers weaker positioning.
The cleaner bullish location sits lower at the 4,300–4,320 Demand Zone. A controlled pullback into this area followed by bullish rejection, higher-low formation or another MSS would support continuation.
Above current resistance, the next major target is the 4,415–4,435 Major Supply Zone.
If buyers establish acceptance above that structure, the larger recovery objective sits around 4,495–4,510.
Key Zones
Current Price: 4,353.695
Resistance / Supply: 4,355–4,380
Buy Priority / Demand: 4,300–4,320
Major Supply: 4,415–4,435
Upper Supply: 4,495–4,510
Structural Support: 4,234.819
Trading Plan
Buy Priority: 4,300–4,320
Condition: wait for an H2 pullback into demand followed by bullish rejection, liquidity sweep + reclaim, higher-low formation or renewed MSS confirmation.
TP1: 4,355–4,380
TP2: 4,415–4,435
TP3: 4,495–4,510
Invalidation: sustained H2 acceptance below 4,300 would weaken the immediate recovery setup.
Buy/Sell View
The preferred idea is not to chase gold directly into resistance.
A retracement toward 4,300–4,320 would provide a cleaner location to evaluate buyer strength. If demand holds and structure confirms, the recovery can continue toward the higher supply zones.
If demand fails, the bullish recovery thesis should be reassessed rather than forcing another long.
Important Note
The Fed remains hawkish despite the current gold rebound. Lower oil and Treasury yields are helping buyers in the short term, but another rise in yields or renewed dollar strength could quickly cap the recovery.
Final View
Gold is showing an improving H2 recovery after breaking the descending trendline, but price is now testing its first important resistance.
The cleaner scenario is a pullback into 4,300–4,320 followed by confirmed bullish continuation, targeting 4,355–4,380, then 4,415–4,435, with 4,495–4,510 as the larger recovery objective.
Can buyers defend H2 demand before gold expands toward the major supply zone? Long 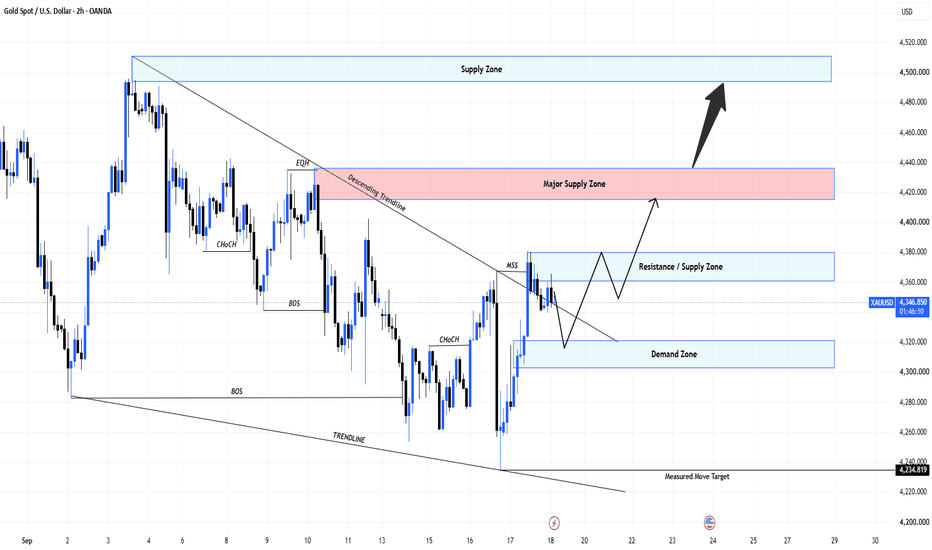
COPPER FUTURES – 1H CHART | MCX BULLISH BREAKOUT SETUP
Copper has broken above the descending trendline with strong bullish momentum. Price is approaching key resistance levels, indicating potential for further upside.
🎯 TRADE LEVELS:
🟢 Entry: Above ₹1,405.90
🛑 Stop Loss: ₹1,398.00
🎯 Target 1: ₹1,410.95
🎯 Target 2: ₹1,417.90
🎯 Target 3: ₹1,424.95
🚀 Target 4: ₹1,431.00
📌 Wait for 1H candle confirmation above the breakout zone. Trail SL as price moves in your favor.
DISCLAIMER :
This content is created by Logic Trade Room for educational and informational purposes only.
It is not financial advice, investment advice, trading advice, or a recommendation to buy or sell any security, index, futures contract, or options contract.
Trading and investing in the stock market involve substantial risk, including the risk of losing your entire invested capital. Past performance does not guarantee future results.
The entry, stop-loss, and target levels mentioned are illustrative chart-based levels and may change with market conditions. No trade setup or market prediction is guaranteed to be accurate.
Always conduct your own research, verify live market prices, and consult a qualified financial advisor before making investment decisions.
Trade with logic. Risk with discipline.
Logic Trade Room  Long
Long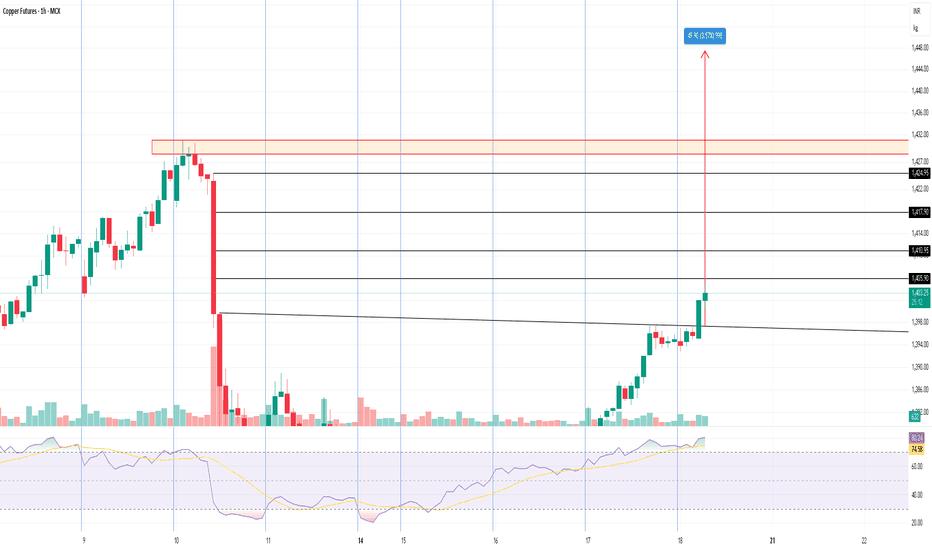
 Long
Long
Short 
XAUUSD — Bullish Wave Structure Toward 4,490
From Kelly’s view, gold is rebuilding a bullish structure after breaking away from the previous descending trendline. Price is trading around 4,391, and the recent recovery suggests buyers are trying to establish a new impulsive sequence toward the upper Fibonacci resistance zones.
The key idea is simple: the main trend may stay bullish while price continues to form higher lows, with 4,405–4,415 acting as the first important resistance test before a potential expansion toward 4,459 and the 4,488–4,497 area.
⟡ Market structure
Gold has recovered strongly from the 4,240–4,260 swing-low area and is now trading above the former descending trendline.
The short-term structure has shifted toward higher lows, while the projected Elliott Wave path suggests another bullish impulse may be developing.
The first obstacle is the Fibonacci resistance zone around 4,405–4,415. If buyers can absorb selling pressure here, price could continue toward 4,433 and 4,459.
Above that, the major resistance and projected Wave (5) completion zone sits around 4,488–4,497, close to the 2.618 Fibonacci extension.
➤ Key levels
◌ Current price area: 4,390–4,395
◌ Main bullish retest zone: 4,375–4,390
◌ Strong support: 4,335–4,350
◌ First resistance: 4,405–4,415
◌ Key resistance: 4,433
◌ First target: 4,459
◌ Main target: 4,488–4,497
◌ Invalidation: Below 4,335
⌁ Elliott Wave view
Wave (1): The current recovery may extend toward the 4,405–4,415 resistance area.
Wave (2): A controlled pullback toward approximately 4,375–4,390 could follow if buyers take profit near resistance.
Wave (3): If the pullback holds and bullish confirmation appears, the stronger expansion could target 4,459.
Wave (4): Price may then consolidate or retrace toward the 4,430–4,440 area.
Wave (5): The final bullish leg could extend toward 4,488–4,497, where the major Fibonacci resistance and projected Wave (5) target overlap.
▸ Trading scenario
Preferred bullish scenario
Entry: 4,375–4,390 after bullish confirmation
Stop Loss: Below 4,335
Take Profit 1: 4,410–4,415
Take Profit 2: 4,459
Take Profit 3: 4,488–4,497
The cleaner plan is to wait for buyers to defend the projected Wave (2) retracement area rather than chase price directly into Fibonacci resistance.
Alternative scenario:
If gold breaks and holds above 4,415 without a deeper pullback, a confirmed retest of this zone could support continuation toward 4,433–4,459.
◌ Invalidation
The bullish structure would weaken if price loses the 4,335–4,350 support area and begins trading back below the recent higher-low structure. A sustained break below 4,335 would invalidate the preferred bullish wave sequence.
⌁ Kelly’s view
Kelly’s main view remains bullish while gold continues to defend its higher-low structure above 4,335–4,350.
The immediate test is 4,405–4,415. If buyers can break and hold above this Fibonacci resistance, the next wave may open the way toward 4,459, followed by the larger 4,488–4,497 Wave (5) target.
Do you think gold will complete this bullish wave structure toward 4,490, or retest the key support zone first? Long 
XAUUSD — Post-Fed Bullish RecoveryMarket Pulse
Gold is recovering strongly after the Fed raised rates by 25 bp to 3.75%–4.00%. The Fed still sees room for another hike this year, which keeps the medium-term rate backdrop restrictive. However, Gold has gained more than 1% today as the U.S. dollar eased from a seven-week high and oil prices moved lower.
Short-term Treasury yields remain elevated, so the recovery may stay volatile even if buyers keep control.
What the Chart Says
XAUUSD has made a strong bullish recovery on H1 after the sharp Fed-driven sweep toward the 4,260 area.
Price reclaimed 4,300, pushed through the 4,330–4,345 zone, and has now broken above the previous CHoCH around 4,365.
That shift shows buyers have regained short-term control.
Gold is currently trading near 4,370, so chasing the move higher is less attractive. A controlled pullback could give a cleaner continuation setup.
The first area I am watching is 4,330–4,345. If buyers defend this zone, price may continue toward the upper 4,388–4,398 resistance area.
A deeper correction could reach 4,295–4,305, which remains the stronger demand zone below.
Levels That Matter
4,388–4,398 — Main resistance
4,365–4,370 — Breakout structure
4,330–4,345 — First support / retest zone
4,295–4,305 — Main demand zone
4,260–4,270 — Post-Fed swing low
My Main Plan
The main plan is bullish.
I prefer waiting for a pullback toward 4,330–4,345 rather than buying after the current expansion.
If this zone holds and bullish confirmation appears, Gold could continue toward 4,388–4,398.
A deeper pullback toward 4,295–4,305 could still keep the recovery structure valid if buyers return there.
What I Need to See
I want price to hold above the reclaimed structure and continue forming higher lows.
A sustained H1 move below 4,295 would weaken the immediate bullish recovery idea and increase the risk of another deeper correction.
Final Read
The H1 picture has improved sharply after the post-Fed liquidity sweep.
For now, buyers have the short-term advantage, but Gold is already extended from the lows. I prefer waiting for the pullback and bullish confirmation rather than chasing price near resistance. Long 
XAUUSD — 4,290 Retest Before the Next Push?
Gold is trading around 4,317 after a strong post-Fed recovery.
M30 structure is improving, but price is still sitting inside a near-term decision area.
A bounce is not enough.
The pullback will tell us more.
The simple read
The key zone today is 4,285–4,298.
If buyers defend this pullback area, Gold may recover toward 4,335 first, then challenge the major resistance around 4,357–4,367.
A clean breakout above that zone could open the way toward 4,396–4,399.
If 4,285 fails, the 4,277 OB becomes the next support.
Key price zones
4,285–4,298 — key pullback zone
4,277 — OB support
4,357–4,367 — major resistance
4,396–4,399 — upper target
4,236–4,245 — major support
The recovery structure is improving, but I prefer the pullback rather than chasing price.
Can 4,290 hold and send Gold toward 4,36x? Long 
Gold rises vs Fed — FOMO or liquidity trap?Gold is showing a strong technical rebound despite the bearish macro backdrop, recovering from the 4,250–4,280 area and pushing back toward 4,390–4,400. However, the broader H4 structure has not yet changed: price remains inside the descending channel and is approaching the upper trendline. This makes the current rally an important test rather than a confirmed bullish reversal.
The interesting part is the divergence between macro narrative and short-term price flow. The Fed delivered a 25bp rate hike and maintained a relatively hawkish stance, while the latest U.S. jobless claims also showed a resilient labor market. Normally, this combination should create pressure on Gold. However, Treasury yields subsequently pulled back, the USD weakened, and oil prices eased as concerns over supply disruptions diminished. These moves helped Gold rebound more than 2% on Thursday.
From the institutional-flow perspective, this is exactly why FOMO should be avoided. Gold is rising, but the rally is occurring into a major technical resistance area while the broader H4 structure remains bearish. If price reaches 4,400–4,420 and fails to break the descending trendline, this rebound could become another liquidity trap before sellers return.
Bearish Scenario — Preferred Bias
If Gold is rejected around 4,390–4,420 and fails to break the descending trendline, sellers could regain control and push price back toward 4,330–4,350, followed by the 4,260–4,280 Supply zone.
The ideal setup is therefore not to chase the current rally, but to wait for rejection and confirmation before following the bearish flow.
Bullish Scenario
If buyers can produce a clean H4 close above the descending trendline and hold above 4,420, the bearish structure would begin to weaken. In that case, Gold could extend toward 4,450–4,480.
For now, the market is giving us an important message: Gold can rally even when the headline macro narrative looks bearish if USD and yields reverse lower. Therefore, the next move should be judged by the interaction between price and the trendline, rather than simply assuming that the Fed hike must immediately push Gold lower.
KEY LEVELS:
🔴 4,390–4,420 — Descending trendline / key resistance
🔴 4,450–4,480 — Major recovery zone
🟢 4,330–4,350 — Near-term support
🟢 4,260–4,280 — Major Supply / downside target
BIAS: BEARISH — NO FOMO. WAIT FOR REJECTION AT THE TRENDLINE OR A CONFIRMED BREAKOUT.
The question now is not “Gold is going up, should we buy?” — but “Is this a genuine structural breakout, or liquidity being built before the next sell-off?” Short 
Bitcoin may fall to 58000 againCOINBASE:BTCUSD
Namaskaram Everyone
Why is very important, why i am giving you a sell here.
so here is my reasons.
# As per neowave Market finished a major bullish trend at the top 1,26,296.
Retraced 61 percent from there.
# Now we are seeing a price jump from this 61 percent which is 60,000 price area.
But market is only given a price wise fall here , still there is some space for consolidation a time wise correction
# Major resistance area is 98,000 , no doubt about it. But if this is going to be an diagonal than price must retrace from current area in form of ((D)) and ((E)) leg.
# if this happen than we have a great risk to reward ration of 10 times and if we do compounding than more.
# Now why price must behave this way, honestly price can behave any number of ways but this way we a good risk reward ratio so we are givng a trade suggestion here.
I dont post regulary updates about instrument, but i have found a new approch to neowave and its easy to code and update. so if you are interested in Neowave Trades , keep following us.
and if you have any query related to anything , you can leave comment here.
Thank You.
Thank You. Short 


