Observation: Rising Channel Structure Intact (Weekly)Observation: Rising Channel Structure Intact
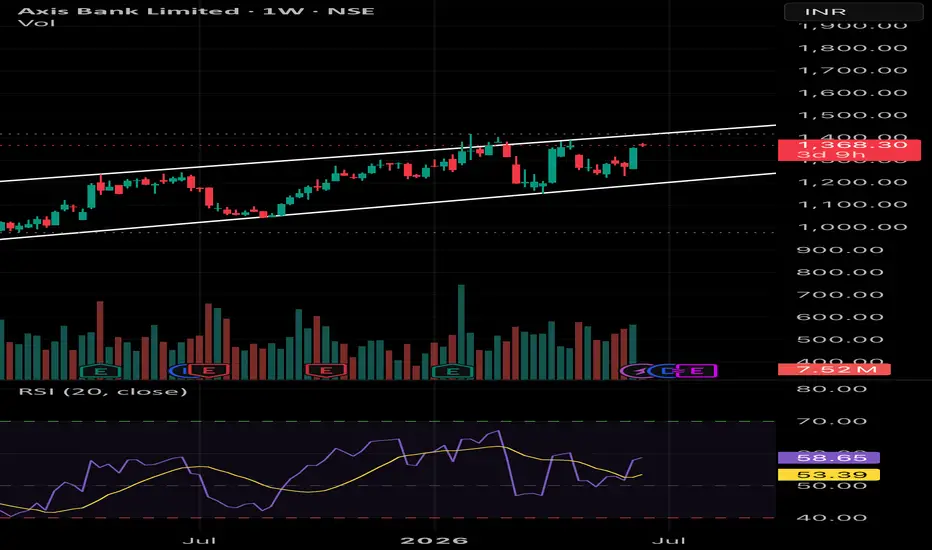
Axis Bank continues to trade within a well-defined ascending channel on the weekly timeframe. Price recently bounced from the lower half of the channel and is attempting to regain momentum toward the upper boundary.
📈 Bullish Factors
* Long-term uptrend remains intact as price is respecting the channel support.
* RSI (20) has crossed above its moving average and is currently around 59, suggesting bullish strength without entering overbought territory.
* Volume has improved during the recent recovery, supporting the bounce.
🎯 Key Levels
* Immediate Resistance: 1,380–1,400
* Major Resistance / Channel Top: 1,425–1,450
* Breakout Target Above 1,450: 1,520–1,580
🛡️ Support Levels
* Immediate Support: 1,320–1,300
* Channel Support: 1,250–1,220
* Trend Failure Below: 1,200  Long
Long
 Short
Short
KPRMILL: Weekly Descending Channel Breakout & Earnings Catalyst1. The Macro Perspective: The Descending Channel Formation
I am taking a LONG bias on K.P.R. Mill Limited (KPRMILL) on the macro weekly (1W) timeframe.
When analyzing pure market structure on a textile sector leader, extended markdown phases often form classical corrective patterns before the primary trend resumes. Following a peak, the stock entered a prolonged structural correction, carving out a well-defined Descending Channel visible on the chart. This multi-month digestion phase allowed institutional capital to systematically accumulate shares at lower valuations. Fundamentally, this technical momentum is supported by their recent Q4 FY26 earnings report, where consolidated net profit jumped 11 percent year-on-year to ₹227.17 crore. Furthermore, their sugar business division demonstrated strong performance with a 10% YoY revenue growth. Documenting these classical accumulation bases makes the charting workflow highly repeatable and easy to understand for anyone analyzing momentum shifts.
2. The Educational Setup: The Channel Boundaries
To understand the technical validity behind this macro launch, look closely at how the price structure interacted with its core boundaries:
The Upper Resistance Trendline: The definitive line in the sand for a bullish structural shift was the solid black descending resistance line connecting the lower highs. This level established a dynamic supply zone that systematically capped upward momentum over the past year.
The Lower Support Trendline: During the consolidation, buyers consistently stepped in at the lower bounds, forming a parallel descending support line. The price action oscillated cleanly between these two boundaries, gradually flushing out weak hands and building immense kinetic energy.
3. Current Price Action: Breakout and Volatility Expansion
Look at the most recent weekly candle on the far right of the chart. The structural pressure cooker has officially exploded. Institutional buyers have stepped in with undeniable conviction. The stock printed a strong green expansion candle that has decisively obliterated the upper channel resistance, currently trading strong near 1,103.20. The stock has officially transitioned out of its macro corrective phase and into a highly explosive markup trend.
Note: Always ensure your exchange's End of Day (EOD) data files have fully synchronized before confirming the final weekly close shape, as evening data shifts can occasionally alter the visual confirmation of these critical breakouts.
4. The Trade Plan: Entries, Targets, and Risk Management
Entry Strategy: Macro momentum is exceptionally strong with the stock trading out in the open above the pivotal breakout line. Chasing an extended weekly breakout candle carries a minor risk of a lower-timeframe mean-reversion pullback. The highest-probability entry strategy involves waiting for the initial vertical excitement to cool off. Look to scale into long positions on a potential structural pullback to perfectly retest the broken descending trendline prior resistance zone. Letting old historical resistance prove itself as a concrete new support floor provides an unmatched risk-to-reward ratio.
Take Profit (Targets): By utilizing a classical measured move strategy based on the width of the descending channel, we can project upside targets. Taking the approximate width of the channel (roughly 200-250 points) and projecting it upward from the breakout point, our primary structural macro target sits comfortably in the 1,300.00 to 1,350.00 zone over the coming months.
Invalidation (Stop Loss): An explosive macro breakout thesis is completely invalidated if the price fails to hold its newly claimed structural support and collapses back inside the core of the channel boundaries. A hard stop loss should be placed safely below the recent lower-timeframe swing lows, specifically around the 940.00 to 960.00 level. A definitive weekly close completely back below 940.00 would act as a severe warning sign of a failed macro breakout and a major bull trap.
5. Time Horizon:
Because this technical setup captures a clear structural phase transition and a major diagonal breakout on the 1-Week chart, this is a longer-term position trade designed to capture a rapid momentum markup phase over the coming weeks and months. Let the macro trend run!  Long
Long
 Long
Long
Nifty Case Study: How to Read and Trade a Double ZigzagWe’ve all seen those times when the market needs a correction, but a simple three-wave ABC drop just isn't enough to shake out the weak hands or reset the indicators. When a single zigzag fails to get the job done, the market prints a Double Zigzag , labeled as W-X-Y .
If you want to understand how these complex corrections work, here is a simple breakdown of what they are, where to find them, and how to spot them using our recent Nifty price action.
What is a Double Zigzag?
Think of a double zigzag as two completely separate ABC zigzag corrections connected by a temporary, counter-trend bounce called Wave X.
A few non-negotiable rules to keep in mind when tracking them:
They are sharp and aggressive: Unlike flats or triangles that drag out sideways for weeks, a double zigzag moves with a relatively steep slope against the main trend.
The Channel Behavior: Because they are so structured, double zigzags almost always trend inside a parallel corrective channel.
Wave X has boundaries: The connector Wave X can be any corrective pattern, but it can never retrace 100% of Wave W. It must peak below the start of the correction.
Where Do They Typically Happen?
You will usually find double zigzags forming in these spots:
Wave 2 of an impulse: This is their absolute favorite territory. Wave 2 corrections are sharp and deep, trying to convince everyone the old trend is dead.
Wave 4 of an impulse: Less common here because of the law of alternation (if Wave 2 was sharp, Wave 4 is usually sideways), but if Wave 2 was a shallow flat, Wave 4 can absolutely be a double zigzag.
Wave B in a larger correction: You will often see them forming the B-wave leg inside a massive macro Flat structure.
The Fibonacci Relationships
To project where the final leg (Wave Y) will terminate, we measure the length of the first leg (Wave W) and project it from the peak of Wave X.
The most common target is Wave Y = 100% of Wave W , showing perfect symmetry.
If the underlying trend is exceptionally strong, Wave Y might truncate at 61.8% .
In high-volatility environments, Wave Y can stretch all the way to the 161.8% extension .
Real-World Case Study: Nifty 50(2H)
If you look at the chart you can see this pattern play out perfectly in the recent Nifty 50 price action.
After establishing a solid low way back at 22,182.55, Nifty went up to the 24,601.70 peak. When the correction started, a single ABC drop wasn't enough. The market mapped out a double zigzag inside that clean, descending purple channel:
Wave W dropped sharply to 23,796.85.
Wave X stalled out at 24,482.10, remaining well below the start of the correction.
Wave Y accelerated down to hit a low of 23,151.50.
Look at how that 23,151.50 low aligns with multiple technical targets. It tagged the exact bottom of the purple channel, hit the fibonacci 61.8% retracement from the April low, and perfectly extended to the 1.618 Fibonacci extension of Wave W. That is a massive confluence zone, which explains the immediate bounce we are seeing up to 23,396.95.
Where the Setup Fails (Invalidation)
No technical setup is guaranteed, so you always need to know where your thesis breaks. For this bullish view, keep an eye on two main risk factors:
The Hard Floor: If the price breaks cleanly below the Wave Y low of 23,151.50 and the lower channel line, the bullish double zigzag count is completely dead. It means a much deeper correction is underway.
The Triple Zigzag Trap: Notice the dotted projection line on the chart labeled "Towards Wave (3/C) or Wave (X)". This is the ultimate trap for traders. If the current bounce struggles to break above the upper purple channel line, loses momentum, and rolls over, it means the market wants to extend into a Triple Zigzag (W-X-Y-X-Z) . In that case, this bounce is just a secondary Wave X, and one more leg down (Wave Z) is coming to print a newer low.
The Takeaway: To confirm that the correction is 100% over and a massive Wave (3/C) rally is starting, we want to see the price convincingly smash right through that upper purple trendline.  Education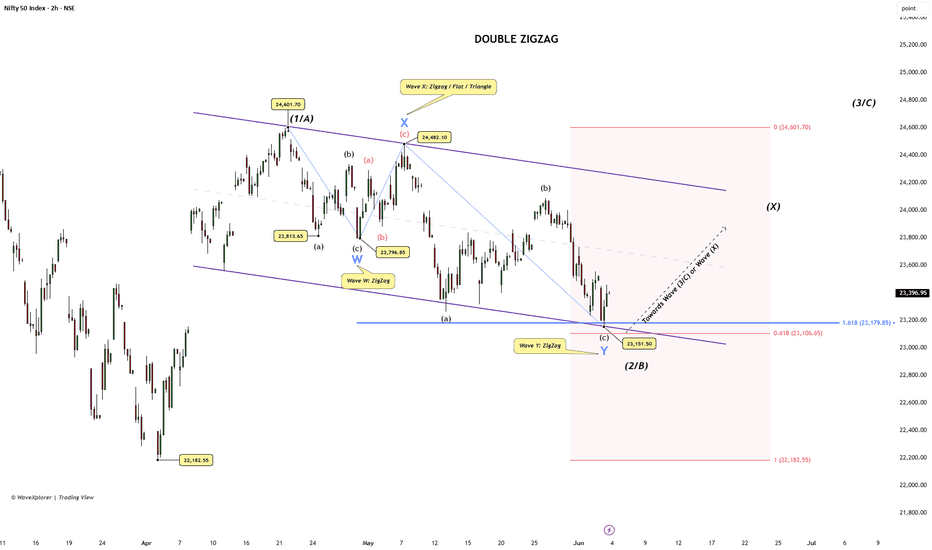
 Long
Long
Angel One: Reading Volume Trends Inside a Corrective ChannelThis post is an educational case study mapping the current structural behavior of Angel One Limited on the 30-minute chart . By combining Elliott Wave Theory, Fibonacci levels, and volume trends, we can observe how the asset is digesting its recent moves.
The Structural Layout
The Impulse Phase: The stock previously completed a strong upward move, marked here as Wave (3). This rise was supported by expanding volume bars, showing active participation during the advance.
The Corrective Phase: Since reaching its peak, the price has been drifting lower inside a clear descending channel. This slow downward grind can be interpreted as a complex W-X-Y corrective structure, forming a potential Wave (4).
Key Clues from the Volume
The most notable feature of this setup is the volume behavior during the wave (3) rise and wave (4) pullback. As highlighted on the chart, volume expanded during wave (3) and is contracting as the price declines. A drop in volume during a downward channel indicates that the drift is caused by a temporary lack of buying interest rather than heavy, aggressive selling pressure.
Key Levels and Risk Rules
Structural Confluence: The chart identifies a theoretical area of interest near 330.90 . This zone is where the 0.382 Fibonacci retracement level aligns with the bottom line of the descending channel. Chart users typically watch this confluence zone for a specific candlestick reversal pattern—such as a hammer or a bullish engulfing candle—to indicate if the correction is reaching completion.
The Invalidation Line: A technical setup is only reliable if it has a strict rule for when the idea is wrong. For this specific structure, the Invalidation Line is placed at 324.70 (the 0.5 Fibonacci level). If the price crosses below 324.70, the bullish scenario is canceled.
Disclaimer: This post is for educational purposes only and is not financial advice. I am not a SEBI-registered analyst. Please do your own research and manage your risk carefully.  Long
Long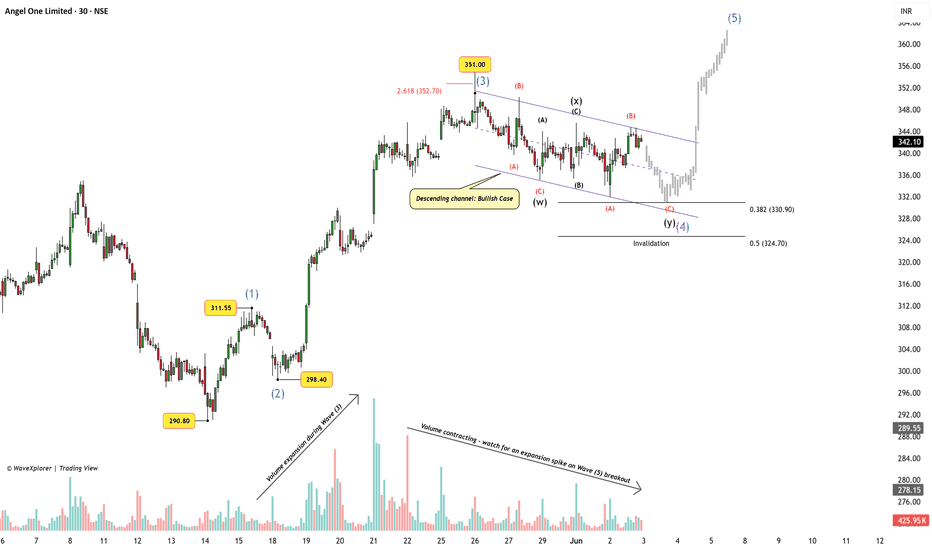
Long 
 Long
Long
 Long
Long
Long 
AAPL: Monthly Ascending Channel & Resistance Breakout1. The Macro Perspective: The Secular Ascending Channel
I am taking a LONG bias on Apple Inc. (AAPL) on the monthly (1M) timeframe.
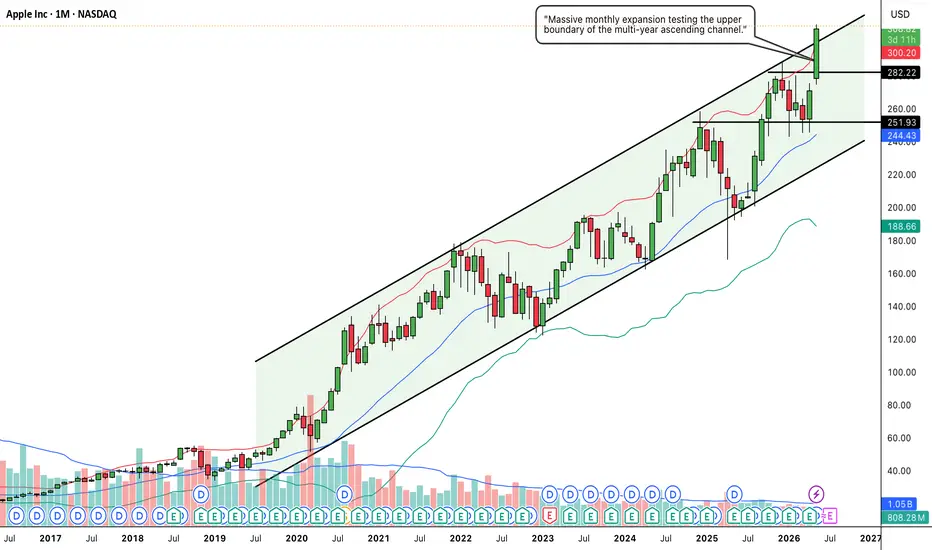
When analyzing pure market structure on a mega-cap tech leader, long-term trend channels dictate the primary narrative. Look at the structural development on this chart. Since the pandemic crash in early 2020, AAPL has been flawlessly respecting a massive ascending parallel channel. This channel acts as a mechanical roadmap: the lower boundary consistently serves as a deep-value accumulation floor, while the upper boundary acts as a profit-taking zone. Following the most recent test of the channel's lower support line in early 2026, institutional buyers aggressively stepped in, launching the stock back toward the top half of the structure. Fundamentally, this fierce momentum aligns perfectly with Apple's recent blockbuster Q2 2026 earnings report, where the company delivered $111.2 billion in revenue and announced a massive new $100 billion share repurchase authorization.
www.investing.com
2. The Educational Setup: Clearing Horizontal Resistance
To understand the technical validity behind this recent thrust, look at how the price interacted with key horizontal levels within the channel:
The 251.93 Support Base: During the mid-channel chop, sellers tried to push the price lower but repeatedly failed at the 251.93 structural support. This established a critical, unbreakable higher low.
The 282.22 Resistance Ceiling: The main obstacle preventing AAPL from reaching the channel top was the solid black horizontal resistance line drawn at 282.22. This marked a major historical pivot where supply previously capped rallies. By chopping tightly beneath this line while the moving averages caught up, the stock built the necessary kinetic energy for a major breakout.
3. Current Price Action: Volatility Expansion and Channel Top
Look at the most recent monthly candle on the far right of the chart. The structural pressure cooker has exploded. Buyers have seized absolute control, printing a massive, full-bodied green expansion candle that has decisively shattered the 282.22 resistance ceiling. The stock has surged to fresh highs near the 311.40 mark, driven by major positive catalysts such as the upcoming CEO transition to John Ternus and Apple's continued dominance in the premium consumption market. Furthermore, this aggressive move has pushed the price directly into the upper boundary of the macro ascending channel.
www.perplexity.ai
4. The Trade Plan: Entries, Targets, and Risk Management
Entry Strategy: Momentum is incredibly strong, but the stock is currently running directly into the upper resistance line of the multi-year channel. Buying blindly at the absolute top of a channel carries a severe risk of a mean-reversion pullback. The highest-probability, lowest-risk entry strategy involves stepping down to the weekly timeframe and waiting for a structural cooling-off period. Look to scale into long positions on a healthy pullback that perfectly retests the broken 275.00 to 285.00 zone. Letting the 282.22 historical resistance prove itself as a concrete new support floor offers a phenomenal risk-to-reward ratio.
Take Profit (Targets): If AAPL can establish the 282.22 level as support, the primary objective is a continued grind along the upper channel boundary, projecting a structural macro target zone of 340.00 to 350.00 over the coming quarters.
Invalidation (Stop Loss): The bullish continuation thesis is severely damaged if the price fails to hold the mid-channel support and collapses back below the breakout zone. A hard stop loss should be placed safely below the 251.93 swing low, around the 240.00 to 245.00 level. A definitive monthly close completely below 240.00 would act as a major warning sign of structural failure and a break of the macro channel.
5. Time Horizon:
Because this technical setup is engineered on a 1-Month chart capturing a secular channel and a major horizontal breakout, this is a longer-term position trade designed to capture sustained macro markup over the coming months and quarters. Let the mega-cap trend run!  Long
Long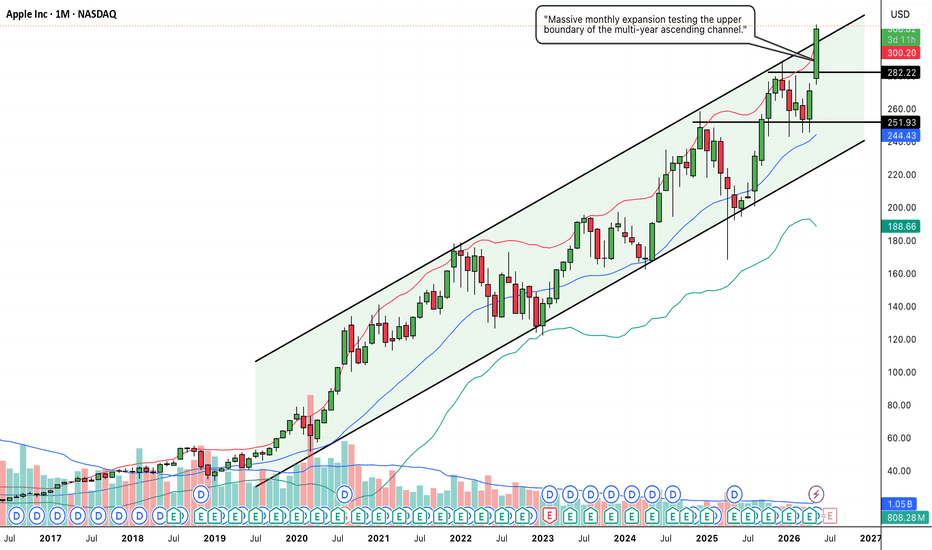
 Long
Long
 Long
Long
SANSERA: The Perfect Ascending Channel and Confluence Bounce1. The Macro Perspective: The Institutional Staircase
I am taking a LONG bias on Sansera Engineering Limited (SANSERA) on the daily (1D) timeframe.
When analyzing pure market structure, the most sustainable and lucrative trends do not go straight up vertically; they move in structured waves. Look at the massive structural development spanning this chart. I have highlighted a textbook "Ascending Channel." This pattern is the ultimate footprint of methodical, long-term institutional accumulation. For months, heavy capital has been systematically walking this stock higher. They aggressively step in to buy every time the price touches the lower trendline (support), and they gracefully take partial profits every time it reaches the upper trendline (resistance), creating a beautiful, rhythmic upward staircase.
2. The Educational Setup: The Power of Confluence
To understand the sheer strength of this current setup, look closely at the mechanics of the recent pullbacks:
The Mid-Line Pivot: Notice how the price frequently interacts with the invisible mid-line of this channel, chopping around the rising 20 SMA (the middle blue line of your Bollinger Bands). This shows a very healthy, balanced trend.
The Concrete Floor: Every major dip that approaches the bottom solid black trendline is met with immediate, aggressive buying pressure. The lower boundary acts as an indestructible structural floor, proving that the underlying macro trend remains entirely intact.
3. Current Price Action: The Golden Bounce
Look at the most recent daily candles on the far right. After reaching the top of the channel near the 2,600 level, the stock suffered a healthy, necessary corrective pullback. But look exactly where the bleeding stopped. The price pulled back to perfectly touch the lower boundary of the ascending channel. Furthermore, notice how the rising 20 SMA perfectly intersected with that trendline. This is a textbook "Confluence Bounce." By printing strong green candles right off this intersection, buyers are loudly confirming that the channel is still dictating the trend.
4. The Trade Plan: Entries, Targets, and Risk Management
Entry Strategy: We are currently sitting right in the "golden entry" zone. The highest-probability, lowest-risk entry involves stepping in right here as the stock launches off this structural confluence in the 2,350.00 to 2,400.00 zone. Buying the confirmed bounce at the bottom of an ascending channel offers a phenomenal risk-to-reward ratio.
Take Profit (Targets): Our targets are dictated entirely by the structure of the channel. The primary structural swing target is a full measured move back up to the upper boundary of the channel, which currently projects comfortably into the 2,800.00 to 2,900.00 zone over the coming weeks. The immediate hurdle will be reclaiming the recent swing high near 2,600.
Invalidation (Stop Loss): A channel-bounce thesis is only valid if the channel holds. A hard stop loss should be placed safely below the lower trendline and the 20 SMA, around the 2,200.00 to 2,250.00 level. A definitive daily close completely breaking down out of the bottom of the channel would act as a massive warning sign of a trend reversal and a severe structural failure.
5. Time Horizon:
Because this technical setup is built on a 1-Day chart capturing a massive structural channel bounce, this is a medium-term swing trade designed to ride the wave back up to the top of the range. Let the channel dictate the trend!  Long
Long
 Long
Long
 Short
Short
Long 
BTCUSD Retest Structure After Channel BreakdownAfter breaking out of the parallel channel structure, the market is continuing toward the downside while respecting the bearish trend. However, I believe the current bearish candle area may still get a retest before the next major move begins.
My expectation is that the market could perform a small pullback and retest the negative candle zone. If price reacts there and forms another bearish confirmation candle, then the downside continuation may become stronger.
At the same time, I also converted the previous demand area into a potential supply zone using the demand-to-supply interchange concept. Because of that, the marked lower zone is now acting as an important reversal area.
If the market reaches this zone and forms any strong positive candle or bullish confirmation, then a temporary upside reaction is also possible from that area.
For now, the market structure still looks bearish overall, but a short pullback before continuation would be completely normal. The reversal zone is already marked, and if proper retesting happens, the setup could become even cleaner.
At this stage, the next reaction around the retesting area will decide whether the market continues lower immediately or creates a short-term recovery move first. Long