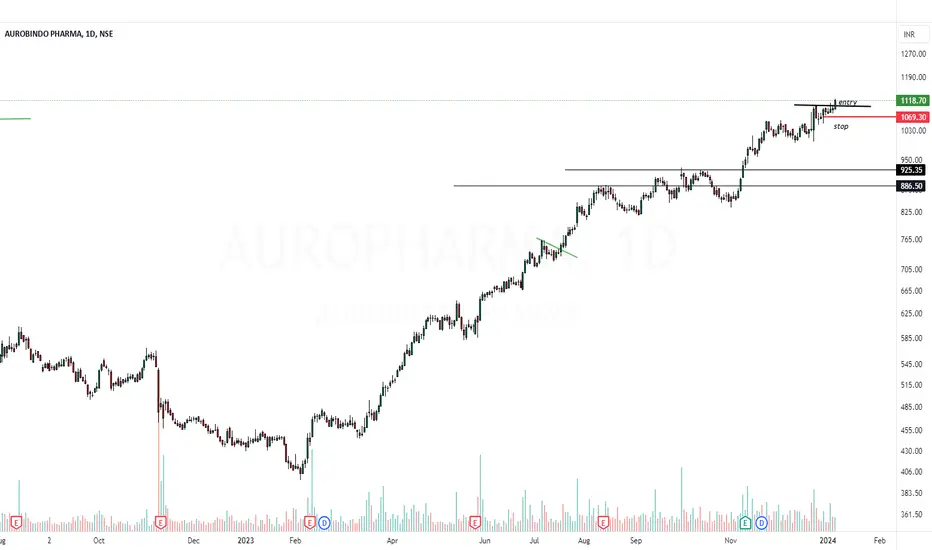
Pennant
HFCL - Breakout from pennant - Continuation b.o.The analysis is done on Weekly TF hence price may take few weeks to few months in order to reach the targets. Trade setup is explained in image itself. This is a continuation breakout chart.
When price comes out of such narrow zone on higher timeframe, chances of such breakouts being successful increases manifold.
The above analysis is purely for educational purpose. Traders must do their own study & follow risk management before entering into any trade
Checkout my other ideas to understand
Fusion Micro Finance about to give Bullish Pennant pattern breakWeekend Pick 3: Fusion Micro Finance
Fundamentals : Strong FY 23, consistent on Sales, Profits and EPS. High Reserve Vs Debt Free.
Technicals : At the verge of Bullish Pennant pattern Breakout with heavy volumes.
R 1: 665
R 2: 720
R 3: 790+
S : 540
Eicher Motors - Pennant BreakoutEicher Motors, on hourly time frame we have seen breakout - pennant breakout. We can expect the price to move to 4300-4500. Other paramters:
1. MACD is making green histograms
2. RSU is positive above 60
3. Volumes are increasing
"Clean Charts, Easy Charts"
Learning & Earning!!!
Cheers!!!
Low risk swing trade in #SOLARASeems like Solara Active Pharma has bottomed out. With the recent high volume followed by tight inside candles + inside dojis, this is a picture perfect setup for swing trade. Pharma sector is in an uptrend so can expect #SOLARA to jump the wagon as well.
Enter @ CMP
Stoploss 322
*DISCLAIMER*
This analysis is only for educational purpose. I am not a SEBI Registered Analyst/Advisor. Please consult your financial advisor before taking any position and please use a Stop Loss for any Investments
Bullish Pennant and Double Bottom BreakoutWeekly chart analysis of NSE:LATENTVIEW
A bullish pennant has been seen on weekly chart pattern. In technical analysis that usually forms after a strong price movement upward, followed by a brief consolidation period.
A double bottom is a bullish chart pattern observed in technical analysis. It usually occurs after a downtrend and signifies a potential reversal in the price of an asset. The pattern resembles the letter "W" and consists of two troughs at approximately the same price leve
Will Tesla Keep Up the Winning Streak with the Upcoming EarningsNASDAQ:TSLA A behemoth in the electric vehicle and clean energy sector that has always kept investors and market analysts on their toes with its stock price movements.
Tesla had a tough time in 2022, seeing its stock price drop from $400 to almost $100. But things turned around this year. The stock price bounced back big time, going up by 200% from $100 to $300. Now, it's moving within a tight range, forming what's called a symmetrical pattern. This means the stock price is holding steady for
A Closer Look at DraftKings Inc (NASDAQ: DKNG)DraftKings Inc, a name synonymous with digital sports entertainment and gaming, has showcased a roller-coaster journey on the stock market. Let's delve into a simplistic examination of its performance, focusing on the key price actions and what lies ahead.
In 2020, prior to the pandemic-induced market crash, DraftKings enjoyed a rally of about 90%, with its stock price soaring from roughly $10 to a high of $19.50. However, the pandemic sent it plunging to a low of $10.60. Unfazed, DKNG rallied
Tata Motors on the Move: Unpacking the Bullish MomentumA recent development on the Tata Motors stock chart has caught the eagle eye of traders and investors: a compelling breakout from a bullish pennant, coupled with a closure above its All-Time High (ATH). While these technical patterns portray a potentially lucrative picture, it's vital to delve deeper and understand the implications and strategies before jumping on the bandwagon.
1. The Bullish Pennant Breakout: A Signal to Surge:
Tata Motors has unfurled a classic bullish pennant, a continuati
Banknifty After Market analysisThe Banknifty recently completed a consolidation phase, forming what appears to be a bullish pennant pattern on the price chart. However, it's important to note that the presence of this pattern alone doesn't guarantee an upward price movement. It is crucial to consider that the market may experience a price correction around the 44730-44750 range, which is a strong resistance zone.
To confirm a potential upward movement, we should watch for a scenario where the price breaks through this resist
Triveni Engg : Breakout Candidate#Triveni #SwingTrade #momentumtrading #flagpattern #chartpatternbreakout
TRIVENI : Swing Trade
>> Flag Pattern Breakout candidate
>> Good Strength & Volumes
>> Levels mentioned on chart
>>Swing Traders can lock 10% profit & keep trailling
Please Like or comment if u r Liking the analysis & Learning from it. Keep showing ur Love
Disclaimer : This is not a Trade Recommendations & Charts/ stocks Mentioned are for Learning/Educational Purpose. Do your Own Analysis before Taking positions.
SUZLON: Swing Breakout IdeaSUZLON again took support this week over the rising trendline which it has been respecting from over 7 months since it began its wonderful breakout. The descending resistance line was also broken out today. Pennant formation. The swing breakout also sent price above 10 and 20 EMA and a crossover was avoided. RSI again crossed over 60 and yesterday was 5% upper circuit. It might continue its upward journey if it crosses the 27 high.
Mastering the Symmetrical Triangle chart patternHello Friends,
Here we had shared Educational purpose post to understand & to master the Symmetrical Triangle chart pattern with real example on chart of the stock MARUTI.
Symmetrical Triangle Chart Pattern
A symmetrical triangle is a common chart pattern used by traders and investors to predict where the price of a stock or asset might go next.
What It Looks Like
Imagine two lines on a chart. One line is sloping up, and the other is sloping down. These lines meet at a point at the top
Ambuja Cement Bullish pennant pattern formation on 1D timeframeThere is a bullish pennant pattern formed in 1D timeframe.
It can be a good trade for both swing traders an intraday traders once it backs the upper parallel channel.
First target could be 460.00 level
SL would be end of wick of the break-out candle
Happy Trading Cheers:)