Hindustan Oil Exploration (D): MASSIVE DUAL BREAKOUTTimeframe: Daily | Scale: Linear
Explosive +10.95% surge today backed by a massive 35.29M volume spike! 🔥
Technical Highlights:
✅ Dual Breakout: Cleared & closed above long-term angular resistance (Aug '24) & short-term horizontal resistance (Sep '25).
✅ Volume Reversal: Huge buying interest reversing a recent trend of drying volume.
✅ Momentum: Short-term EMAs in positive crossover across Daily, Weekly & Monthly. MACD & RSI rising on all timeframes. 🚀
Key Levels to Watch:
Pitchforks
Nifty Intraday Analysis for 03rd September 2026NSE:NIFTY
Index is near resistance and if crosses and sustains above 24000 - 25050 resistance zone then uptrend is expected to be formed else downtrend is expected to continue.
The upward movement may lead to 24125 – 24175 resistance range and if the index crosses and sustains above this level then may reach near 24400 – 24450 range.
On the contrary, The downward moment may drag the Index to 23700 – 23650 support range in downward momentum and if this support is broken then index may ta
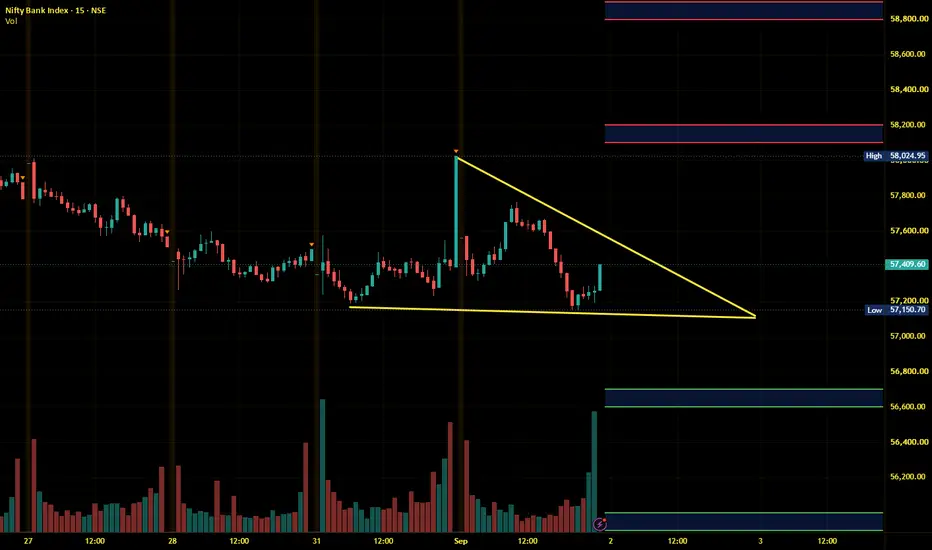
Banknifty Intraday Analysis for 03rd September 2026NSE:BANKNIFTY
Highest Call and Put OI is at 58500 strike which will act as make or break level and downside risk is expected as long as Index is below 58500 level.
The upward moment may lead the Index to 57900 – 58000 resistance range in upward momentum and if the index crosses and sustains above this level then may reach near 58600 – 58700 range.
On the contrary, The downward moment may drag the Index to 56500 – 56400 support range in downward momentum and if this support is broken then th
Finnifty Intraday Analysis for 03rd September 2026NSE:CNXFINANCE
Index is near resistance and if crosses and sustains above 25900 - 26000 resistance zone then uptrend is expected to be formed else downtrend is expected to continue if 25700 support is broken.
The upward movement may lead the Index to 26050 - 26100 resistance range and if the index crosses and sustains above this level then may reach near 26350 - 26400 range.
On the contrary, The downward moment may drag the to 25550 – 25500 support range and if this support too is broken
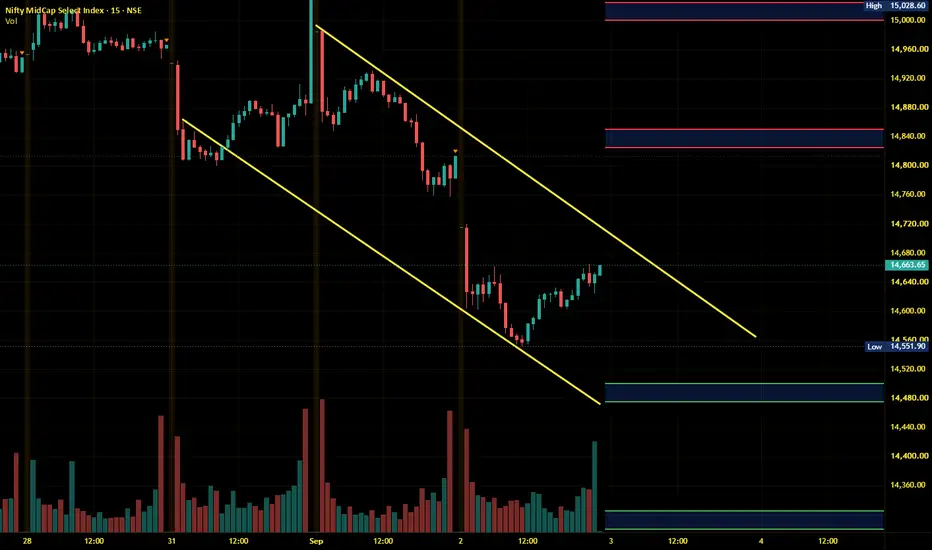
Midnifty Intraday Analysis for 03rd September 2026NSE:NIFTY_MID_SELECT
Index is near resistance and if crosses and sustains above 14725 - 14750 resistance zone then uptrend is expected to be formed else downtrend is expected to continue.
The upward movement may lead the Index near 14825 – 14850 resistance range and if the index crosses and sustains above this level then may reach 15000 – 15025 range.
On the contrary, The downward moment may drag the index to 14500 – 14475 support range and if this support is broken then index may tank n
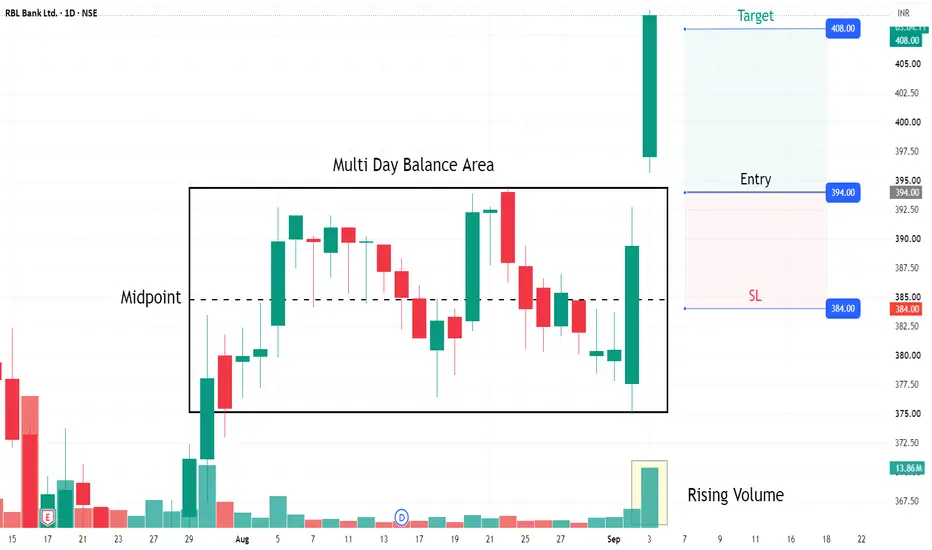
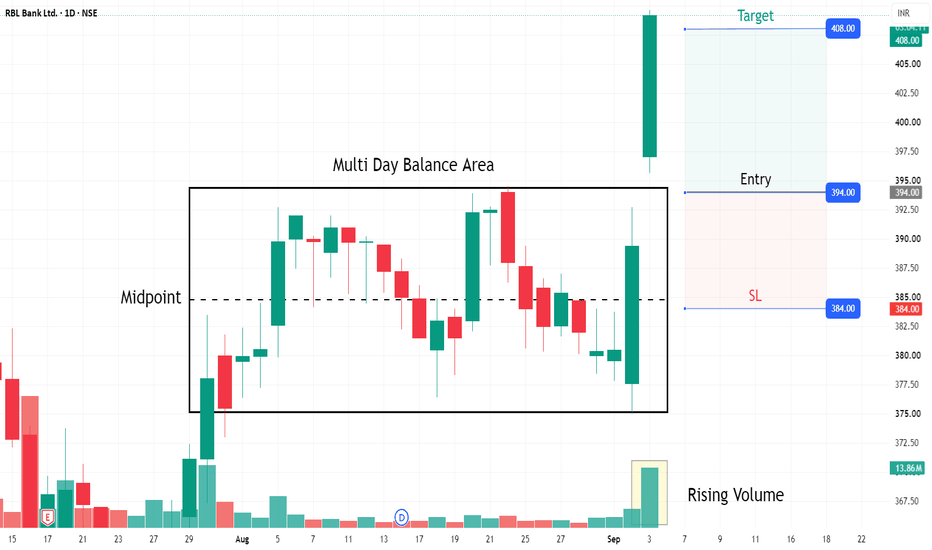
RBLBANK (D) - Breakout Pullback SetupSetup:
RBL Bank spent last few weeks consolidating within a Multi Day Balance Area on the daily chart, rotating around the midpoint near 385. Today, price broke out sharply above the balance area with good Volume giving us a clean breakout setup. Wait for the pullback back to the balance area high at 394 for a long trade.
Key Levels:
Multi Day Balance Area Midpoint: 385.00
Balance Area High (Entry/Retest Zone): 394.00
Trade Plan:
Bias: Long
Entry Zone: 394.00
Stop Loss: 384.00
Target:
XAUUSD — Elliott Wave Recovery From 4,286 XAUUSD — Elliott Wave Recovery From 4,286
Gold is showing a strong Elliott Wave recovery after completing the previous bearish wave 5 near the 4,286–4,300 demand area. From Kelly’s view, the current chart suggests that XAUUSD has shifted into a short-term bullish correction structure, but price is now approaching an important Fibonacci sell zone where a pullback may appear first.
The key idea is simple: gold may push higher to complete the current upside wave, then correct into the buy zone be
NIFTY — Buying Range Near Trendline Support, Setup for TomorrowOverview
Nifty closed today at 23,914.45, down 0.59%, after touching a low of 23,786.80, right into the buying range we're watching. Price is now testing the rising trendline support, a zone that's held multiple times through this uptrend structure.
Pattern Explanation
The rising Trendline Support (in play since April) is converging with a horizontal support zone here, making 23,760–23,800 a well-defined buying range for tomorrow. Below this, the Invalidation/SL level sits at 23,600, giving a
XAUUSD — Bearish Wave 5 Toward 4,286
Gold is still trading inside a bearish Elliott Wave structure after the strong selloff from the upper area. From Kelly’s view, the current chart suggests that XAUUSD may be forming a wave (4) correction under resistance before continuing lower into wave (5).
The key idea is simple: gold is still below strong resistance, and if buyers fail to reclaim the upper zone, the next bearish target remains around 4,286.
⟡ Market Structure
Gold is currently trading around 4,429, right near the upper s
XAUUSD GOLD ANALYSIS ON (03 SEP 2026)#XAUUSD UPDATEDE
SELL LIMITED 4440-4450
If price stay below 4480, then next target 4390,4350 and 4300,4260 and above that 450,4850
Plan;If price break 4440-4450 area,and stay below 4480,we will place sell order in gold with target of 4390,4350 and 4300,4260 & stop loss should be placed at 4480
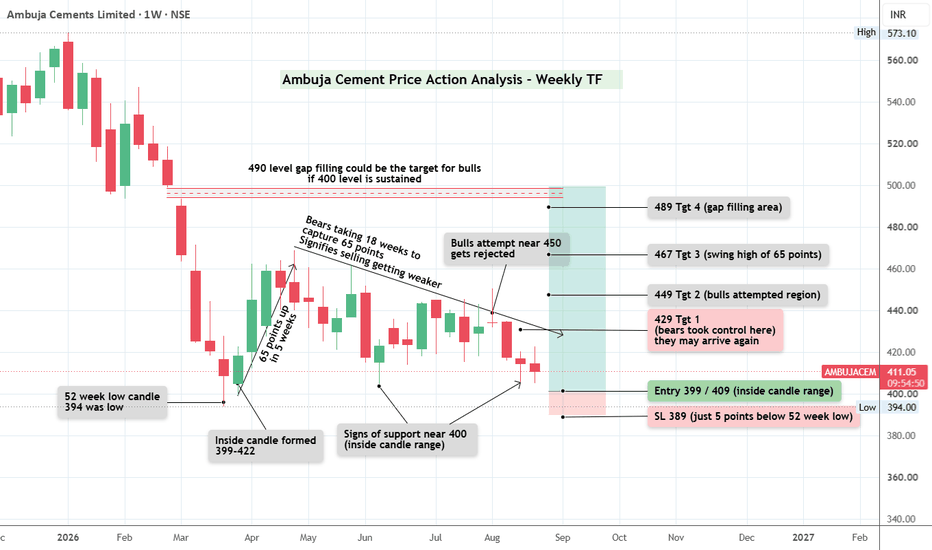
Will Ambuja Cement make a new 52 week low? Well the price action of Ambuja cement is showing all signs of ..... lets decode...
394 was the 52 week low made in March 2026
The stock bounces to 460 levels within just 5 weeks
Its almost 18 weeks and the stock hasnt even come back to 400 yet.
Are the bears losing control?
We never know unless we see the stock holding 400 levels.
However there was an attempt made to cross 450 but it got rejected.
Assuming we see bear weakness near 410-400 level we may try to buy near 400 levels to target 429
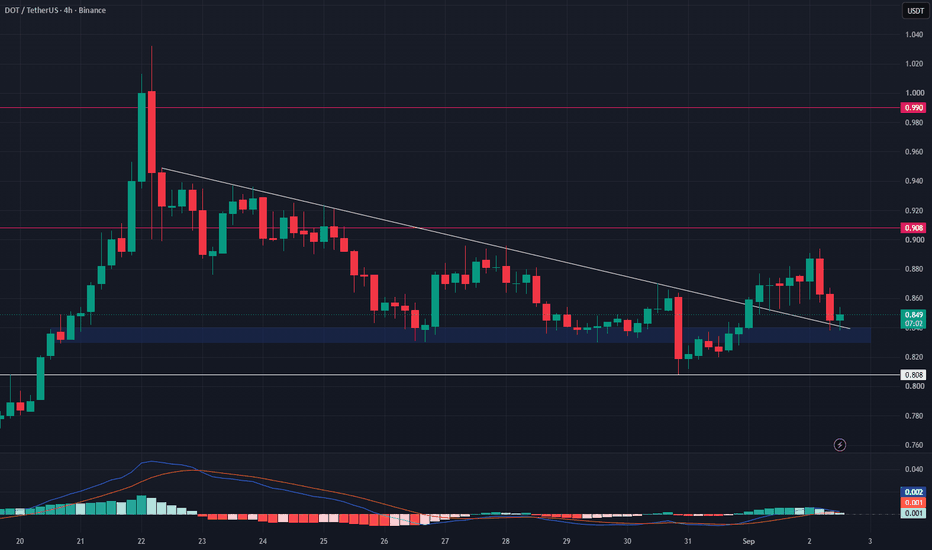
DOT Bullish Breakout: $0.99 Target in Focus After 37% SurgeDOT gained 37% after our previous analysis and has now broken above a multi-week descending trendline.
Price is consolidating near $0.850, while the $0.830–$0.840 support zone remains key. Holding this area could open the door toward $0.990.
Trading Levels
Entry: $0.830–$0.840
TP1: $0.908
TP2: $0.990
Stop Loss: $0.808
Bullish bias remains valid while $0.830–$0.840 holds.
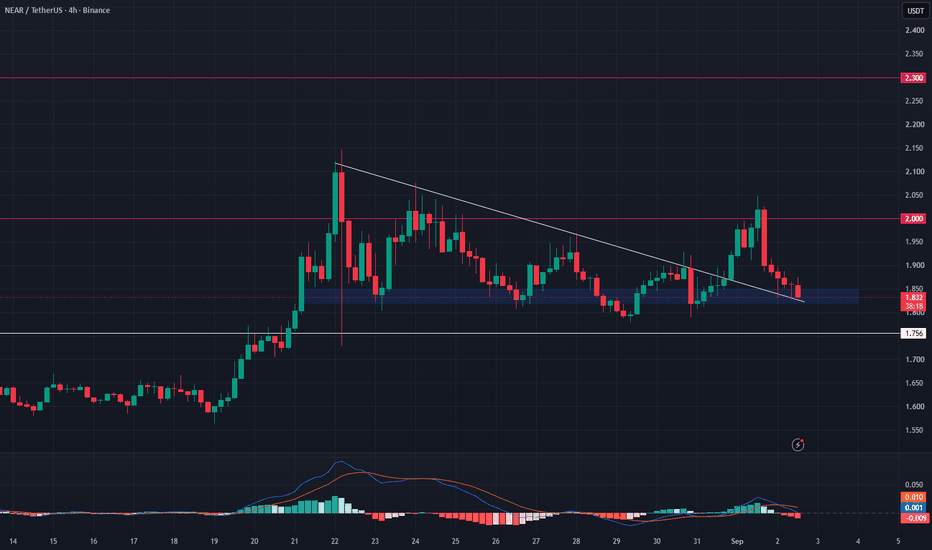
NEAR Protocol Eyes $2.30 After Bullish BreakoutNEAR has broken out of a multi-week descending structure on the 4H chart.
The $1.820–$1.850 support zone is key. As long as price holds above this area, the bullish setup remains valid with upside potential toward $2.00 and $2.30.
Trading Levels
Entry: $1.820–$1.850
TP1: $2.00
TP2: $2.30
Stop Loss: $1.756
Bias: Bullish above $1.820
Antelopus Selan Energy (D): UPPER CIRCUIT ALERTTimeframe: Daily | Scale: Linear
Massive +20% surge today on an explosive 12.45M volume spike , locking at the upper circuit! 🔥
Technical Highlights:
✅ Confluence Breakout: Cleared & closed above short-term horizontal (Jun '26) & long-term angular (Jul '24) resistance.
✅ Volume Reversal: Massive buying interest reversing a recent trend of drying volume.
✅ Momentum: Short-term EMAs in positive crossover across Daily, Weekly & Monthly. MACD & RSI rising on all timeframes. 🚀
Key
Indoco Remedies (D): MASSIVE VOLUME BREAKOUTTimeframe: Daily | Scale: Linear
Explosive +12.27% surge today on an exceptional 19.23M volume spike , reversing the recent trend of drying volume! 🔥
Technical Highlights:
✅ Short-Term Breakout: Cleared & closed above horizontal resistance (active since Nov '25).
⚠️ Major Hurdle: Currently positioned right below a long-term angular resistance intact since Aug '21.
✅ Momentum: Short-term EMAs in positive crossover on Daily & Weekly. MACD & RSI rising across all major timeframes.
Nifty Intraday Analysis for 02nd September 2026NSE:NIFTY
Index is near 24000 support and if it is broken then downward momentum will be paved else bounce is expected.
The upward movement may lead to 24250 – 24300 resistance range and if the index crosses and sustains above this level then may reach near 24500 – 24550 range.
On the contrary, The downward moment may drag the Index to 23850 – 23800 support range in downward momentum and if this support is broken then index may tank near 23600 – 23550 range.
Banknifty Intraday Analysis for 02nd September 2026NSE:BANKNIFTY
Highest Call and Put OI is at 58500 strike which will act as make or break level and downside risk is expected as long as Index is below 58500 level.
The upward moment may lead the Index to 58100 – 58200 resistance range in upward momentum and if the index crosses and sustains above this level then may reach near 58600 – 58900 range.
On the contrary, The downward moment may drag the Index to 56700 – 56600 support range in downward momentum and if this support is broken then th
Finnifty Intraday Analysis for 02nd September 2026NSE:CNXFINANCE
Index is near 26000 support and if it is broken then downward momentum will be paved else bounce is expected.
The upward movement may lead the Index to 26250 - 26300 resistance range and if the index crosses and sustains above this level then may reach near 26550 - 26600 range.
On the contrary, The downward moment may drag the to 25750 – 25700 support range and if this support too is broken then index may tank near 25450 – 25400 range.
Midnifty Intraday Analysis for 02nd September 2026NSE:NIFTY_MID_SELECT
Index is near 14800 support and if it is broken then downward momentum will be paved else rangebound moment in 14800 - 15000 range expected.
The upward movement may lead the Index near 14975 – 15000 resistance range and if the index crosses and sustains above this level then may reach 15150 – 15175 range.
On the contrary, The downward moment may drag the index to 14650 – 14625 support range and if this support is broken then index may tank near 14475 – 14450 range.
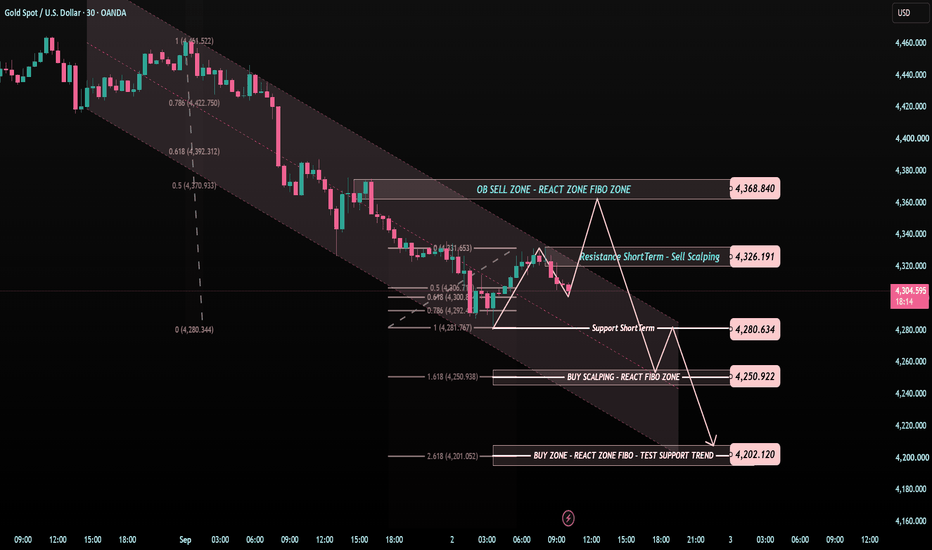
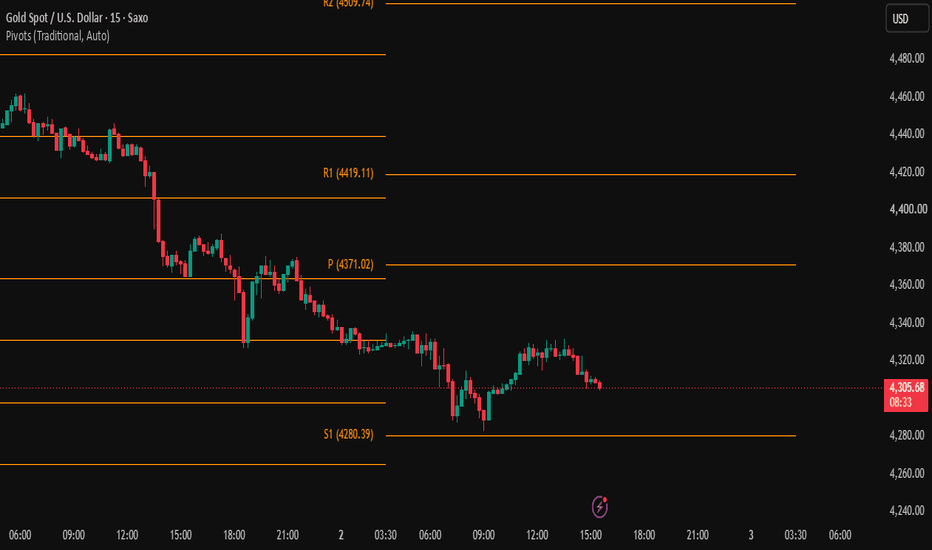
XAUUSD — The Downtrend Still Owns the ChartGold is still moving inside a bearish channel, and buyers have not shown enough strength to change the structure yet.
Price is now sitting around 4,300 - 4,310, close to the lower reaction area.
This is where many traders may rush into buys.
But for me, a low price is not a buy signal.
The reaction is the signal.
The simple read
4,326 is the first level to watch above the current price.
If gold bounces into this area and fails to break higher, it can become a short-term sell reaction zone
The 07:15 AM Discovery: How a Direction Filter Turned Coin-Flip# The 07:15 AM Discovery: How a Direction Filter Turned a Coin-Flip Strategy Into a 100% Win Rate
*A breakdown of backtesting XAUUSD's Thursday morning breakout — and the overfitting trap that almost fooled me.*
---
## The Setup
For months I'd been hunting for a reliable intraday breakout strategy on XAUUSD (gold) — specifically, whether certain times of day on certain weekdays produce a statistically meaningful edge. The mechanics are simple: at a fixed reference candle, place a Buy Stop an
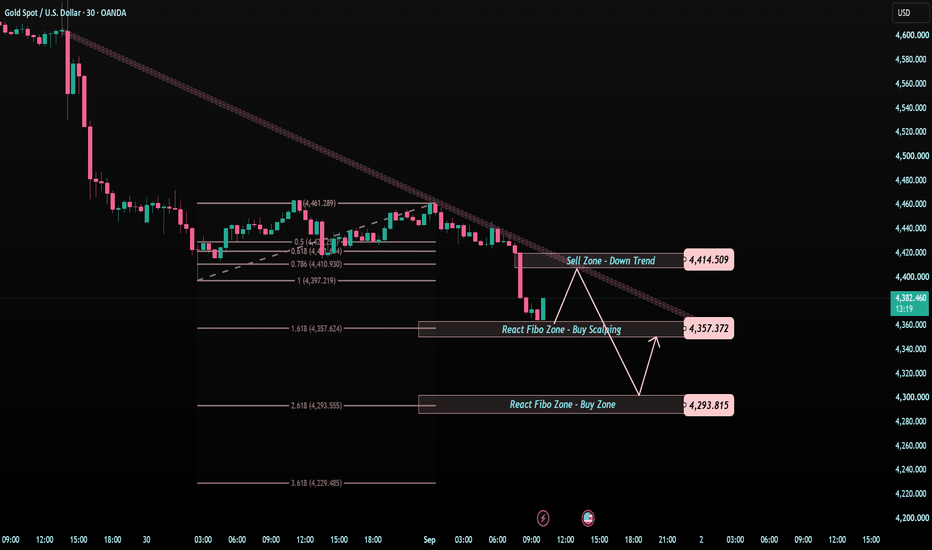
XAUUSD — The Drop Is Strong, But the Zone Matters MoreGold is still moving with bearish pressure after the recent breakdown.
Price is now approaching the 4,357 React Fibo / Buy Scalping area, and this is where the chart becomes important.
After a strong drop, many traders will want to sell late.
But Tiara’s plan is not to chase the move.
The simple read
4,357 is the first reaction zone today.
If buyers defend this area, gold may create a short-term bounce toward 4,414.
But 4,414 is the real test.
This level is the Sell Zone / Downtrend Rete
NIFTY Sellers Take Control After the Doji, Testing the 50 (W)EMAOverview
Nifty closed the week at 24,366, down 204.65 points or 0.83%. This follows directly from last week's doji at resistance, and the answer to "which side wins" has come in: sellers took control this week, with price rejecting from a high of 24,620.95 and closing near the Weekly 50 EMA (24,358.08).
Follow-up on Last Week's View
Last week we flagged a doji forming right at the resistance zone (24,601–24,989), a classic sign of indecision after a multi-week rally, with the next 1-2 candles