NIFTY FIN SERVICE FOR 31 OCT#Execution only after break and close above or below from resistance or support 15-minute candle.
#Stop Loss above or below from resistance or support 15-minute candle.
NOTE- Only for Education Purpose.
Please Give A Like If You Like
The information and publications are not meant to be, and do not constitute, financial, investment, trading, or other types of advice or recommendations
Pivot Points
NIFTY FOR 31 OCT#Execution only after break and close above or below from resistance or support 15-minute candle.
#Stop Loss above or below from resistance or support 15-minute candle.
NOTE- Only for Education Purpose.
Please Give A Like If You Like
The information and publications are not meant to be, and do not constitute, financial, investment, trading, or other types of advice or recommendations
BANKNIFTY FOR 30 OCT#Execution only after break and close above or below from resistance or support 15-minute candle.
#Stop Loss above or below from resistance or support 15-minute candle.
NOTE- Only for Education Purpose.
Please Give A Like If You Like
The information and publications are not meant to be, and do not constitute, financial, investment, trading, or other types of advice or recommendations
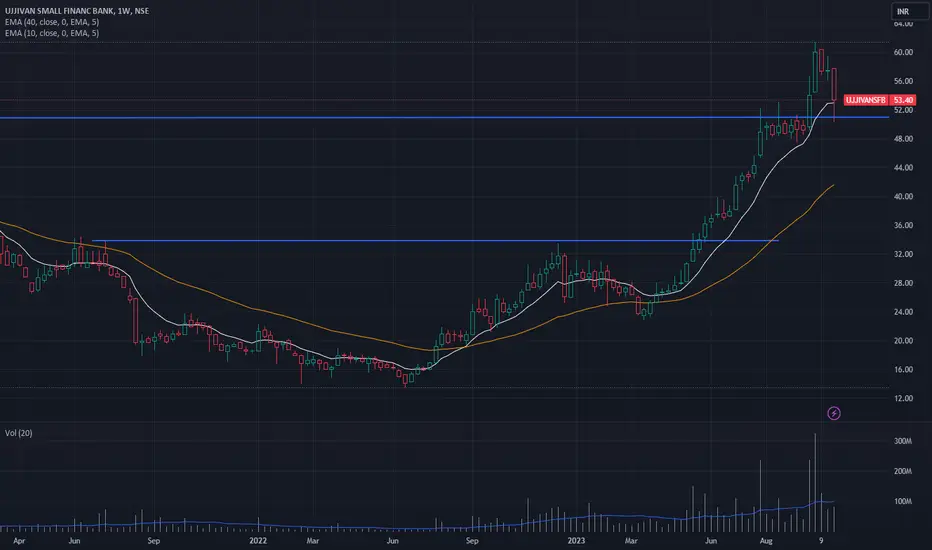
UJJIVANSFB Watchlist Idea [Support @51]UJJIVANSFB recently broke out of a long weekly base with good volumes. Seeing the market conditions, should be a good watchlist candidate as it has support around 51 and good odds to build a base around the same and then move for ATH BO above 62. Keep checking this out :)
XAU - Technical profile.I would like to draw your attention to the resistance level of 1986.69. Recently, this level has not been effectively broken. It is likely that now buyers will try to test it again. If you have the strength to go through it and gain a foothold, then gold will have every chance to continue growing.
Why HUDCO stock Drop 9.51% in Day
HUDCO's share price Dropped 9.51% on Wednesday, the stock reached a low of 81.22 rupees in the day.
According to the stock exchange information, the government is selling up to a 7% stake in the state-run housing finance company through the Offer for Sale (OFS).
Support Zone - 65-67
Major Support Zone - 53-55
Nifty Trading Plan for Monday 16 Oct 2023 Nifty Demand and supply zones are Price levels on Chart where the Buying and selling Pressures are Expected to be Strong and it is top Nifty Trading Indicator for Nifty Intraday Trading
Nifty key Support
Nifty Support 1 - 19720
Nifty Support 2 - 19650
Nifty Support 3 - 19580
Nifty Support 4 - 19480
Nifty key Resistance
Nifty Resistance 1 - 19790
Nifty Resistance 2 - 19840
Nifty Resistance 3 - 19880
Nifty Resistance 4 - 19940
Nifty Trend Signal From Open Interest Analysis
PCR ratio as
TECHNICAL VIEW ON XAUUSD ( ON DAILY TIME FRAME )1) Pivot point IS 1820.50
_R1 : 1828.64 | R2 : 1837.27 | R3 : 1845.24_
_S1 : 1795.44 | S2 : 1804.07 | S3 : 1812.04 _
2) Moving average ( 5, 10, 20, 50, 100, 200)
_MA5 : 1822.49(S), 1829.33(E) | MA10: 1851.61(S), 1847.47(E) | MA20: 1886.48(S), 1871.32(E)
| MA50: 1907.15(S), 1900.34(E) | MA100: 1926.74(S), 1915.11(E) | MA200: 1927.75(S), 1906.52(E)_
3) Trend analysis (MIN, HOURLY, DAILY, WEEKLY, MONTHLY )
15MIN : DOWNTREND | HOURLY : SIDEWAY | DAILY : DOWNTREND | WEEKLY : DOWNTREND | MONT
Nifty Trading Plan for Oct First Week Nifty End of Day Analysis Helps Traders to Understand the Nifty sentiment and Identify Potential Trading Opportunities for the Next Trading Day in Nifty future or Nifty option
Nifty Support
Nifty Support 1 - 19600
Nifty Support 2 - 19490
Nifty Support 3 - 19460
Nifty Support 4 - 19365
Nifty Resistance
Nifty Resistance 1 - 19750
Nifty Resistance 2 - 19860
Nifty Resistance 3 - 19925
Nifty Trend Signal From Open Interest Analysis
PCR ratio as per Option Chain Analysis - 0.93 ( Bullish)
M
Nifty Trading Plan For Monday 18 Sept Nifty Demand and supply zones are Price levels on the Chart where the Buying and selling Pressures are Expected to be Strong
Nifty Support
Nifty Support 1 - 20125
Nifty Support 2 - 20035
Nifty Support 3 - 19960
Nifty Support 4 - 19925
Nifty Resistance
Nifty Resistance 1 - 20200
Nifty Resistance 2 - 20240
Nifty Resistance 3 - 20340
Nifty Trend Signal From Nifty Next Week Open Interest Analysis
PCR ratio as per Option Chain Analysis - 0.99 ( Bullish)
Max Pain As per Option Chain Analysis -
Nifty Trading Plan for Second week of Sept Nifty Demand and supply zones are Price levels on the Chart where the Buying and selling Pressures are Expected to be Strong
Nifty Support
Nifty Support 1 - 19750
Nifty Support 2 - 19650
Nifty Support 3 - 19550
Nifty Support 4 - 19450
Nifty Resistance
Nifty Resistance 1 - 19860
Nifty Resistance 2 - 20000
Nifty Resistance 3 - 20150
Nifty Resistance 4 - 20250
Nifty Trend Signal From Nifty Next Week Open Interest Analysis
PCR ratio as per Option Chain Analysis - 1.0 ( Bullish)
Max Pain As
Nifty Trading Plan for Second week of Sept 2023 Nifty End of Day Analysis Helps Traders to Understand the Nifty sentiment and Identify Potential Trading Opportunities for the Next Trading Day in Nifty future or Nifty option
Nifty Support
Nifty Support 1 - 19358
Nifty Support 2 - 19240
Nifty Support 3 - 19180
Nifty Resistance
Nifty Resistance 1 - 19470
Nifty Resistance 2 - 19570
Nifty Resistance 3 - 19680
Nifty Trend Signal From Open Interest Analysis
PCR ratio as per Option Chain Analysis - 1.1 ( Bullish
Nifty Trading Plan for 31 Aug 2023Nifty Demand and supply zones are Price levels on the Chart where the Buying and selling Pressures are Expected to be Strong and it is the top Nifty Trading Indicator for Nifty Intraday Trading
Support Zones for Nifty are as Given Below
S1- 19260
S2- 19180
S3 -19050
Resistance Zones for Nifty are as Given Below
R1- 19370
R2 -19440
R3 -19515
Nifty Trend Signal From Open Interest Analysis
PCR ratio as per Option Chain Analysis -0.78 ( Bearish)
Max Pain As per Option Chain Analysis -19400
Major
Poddar Pigments forming a 3 week tight doji patternPoddar Pigments after a good time correction is going into bullish zone again, the formation of 3 week tight doji pattern near the trend line breakout zone is a good sign of demand this scrip is getting. Looks like this pigments scrip will be giving a breakout soon. Stop loss should be placed @ 290 here.
*DISCLAIMER*
This analysis is only for educational purpose. I am not a SEBI Registered Analyst/Advisor. Please consult your financial advisor before taking any position and please use a Stop
Nifty Trading Plan for 29 Aug 2023 Nifty Demand and supply zones are Price levels on the Chart where the Buying and selling Pressures are Expected to be Strong and it is the top Nifty Trading Indicator for Nifty Intraday Trading
Support Zones for Nifty are as Given Below
S1- 19260
S2- 19180
S3 -19050
Resistance Zones for Nifty are as Given Below
R1- 19370
R2 -19440
R3 -19515
Nifty Trend Signal From Open Interest Analysis
PCR ratio as per Option Chain Analysis -0.85 ( Bearish)
Max Pain As per Option Chain Analysis -19300
Ma