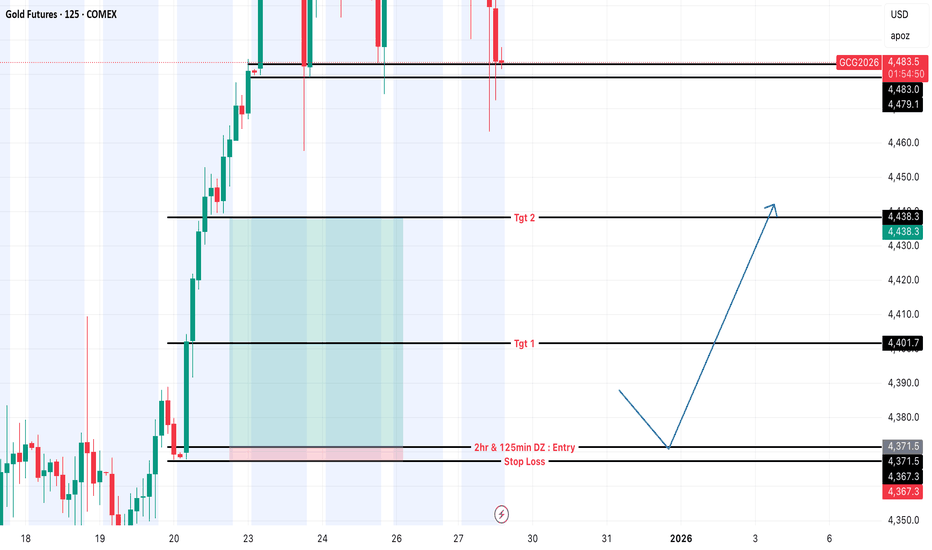
Gold Futures | Bullish Reversal Setup from Demand ZoneThis chart shows a bullish setup on Gold Futures (GC1!) based on a pullback into a 2-Hour + 125-Minute Demand Zone confluence due to FII's pending orders.
I’m expecting the price to retrace back into the marked demand area before continuing higher toward the upside targets.
Plan
• Entry: Inside the 2H & 125m Demand Zone
• Stop Loss: Just below the zone
• Target 1: 4,401
• Target 2: 4,438
Pivot Points
Jaysawal Neco’s JourneyJaysawal Neco’s stock wandered in the wilderness for years, stuck in the shadows below ₹30. Investors almost forgot it existed. But then, around 2024, something changed. The stock woke up, broke its chains, and started climbing the mountain of opportunity.
First, it crossed the old barrier at ₹56 a level that had held it captive for years. Then, like a warrior gaining strength, it surged past ₹90, a powerful resistance that marked the beginning of a new era.
Now, the stock stands at ₹91, looking toward the distant peak at ₹145 the land of Fibonacci’s promise. The path ahead is not without danger. If it slips below ₹65, the dream could fade. But if it holds strong, the journey to ₹145 could make legends.
Entry Point: ₹90–92 (where the hero stands now)
Stop-Loss: ₹65 (the safety rope if the climb gets risky)
Target 1: ₹118 (first milestone)
Target 2: ₹145 (the summit)
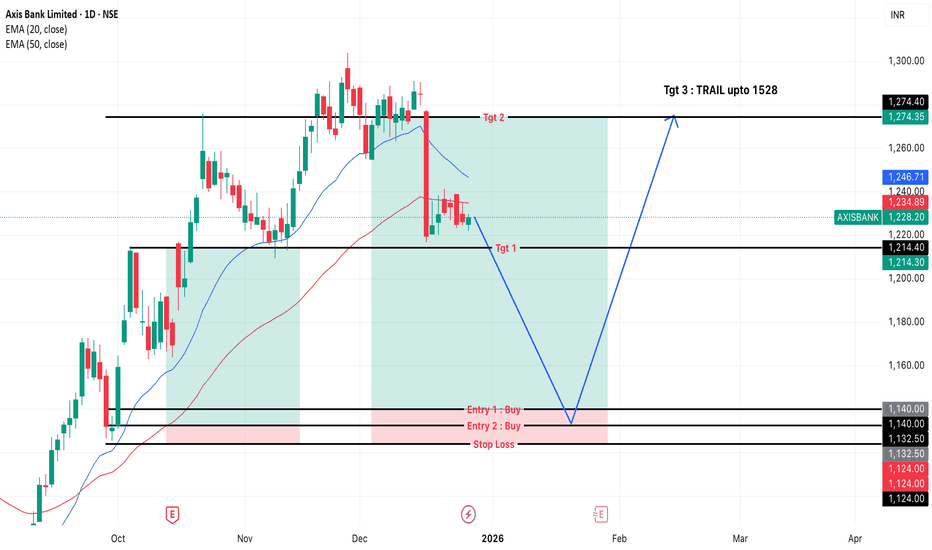
Axis Bank — Positional Long Setup | Plan the Pullback🟢 Long Plan – Buy the Dip Zone
🛒 Entry Zones
Entry 1: around ₹1140
Entry 2: around ₹1132–₹1124 (deeper fill zone)
⛔ Stop Loss
Below ₹1124 (decisive breakdown = setup invalid)
🎯 Upside Targets
Target 1: Previous support retest near ₹1214
Target 2: Resistance retest around ₹1274
Target 3: Trail the position toward ₹1528 if momentum continues
I prefer partial booking + trailing SL as price moves higher.
Trade Logic: A positive Trend & Pulse on daily and weekly time frames + A strong Demand Zone with FII's Pending Orders.
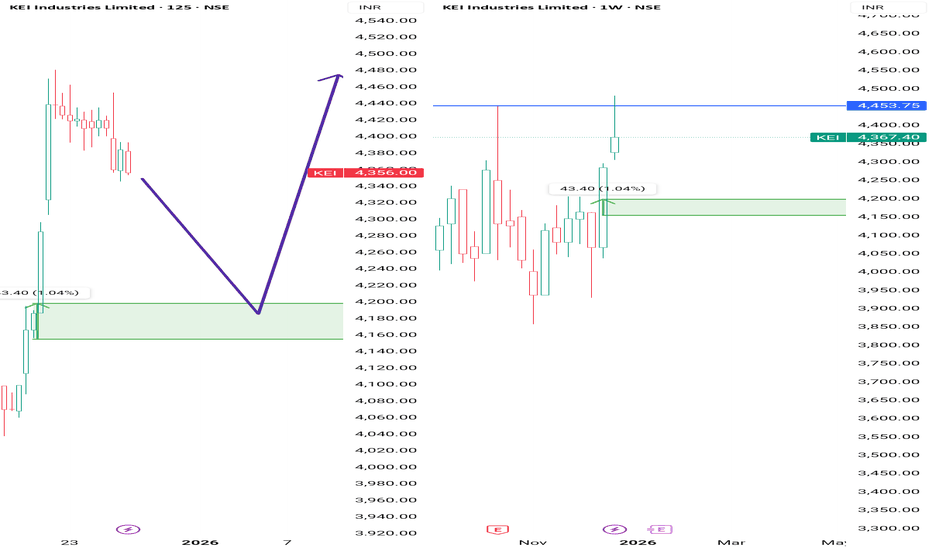
KEI LONG SETUPLogic : KEI is on Uptrend and is trying to break the consolidation on the weekly, entering long on the 125 mind marked demand zone would be a good opportunity. The stock has tried to break the previous high and is retracing too.
The zone also co incides with 50% length of the weekly candle.
Keep strict SL below the zone
NBCC LONG setupLogic: Nbcc has been in Uptrend on Daily and weekly. The demand zone formed is evident on most time frames.
2 scenario can be seen
Scenario 1: if price tries to retrace to the level then entering long is definitely an opportunity
Scenario 2: if price does not retrace and a small inside candle is formed on the daily time frame, then entering long on break of the high of the candle as marked can be a equivalent opportunity, the reason behind, as price may not retrace on strong uptrending stock easily.
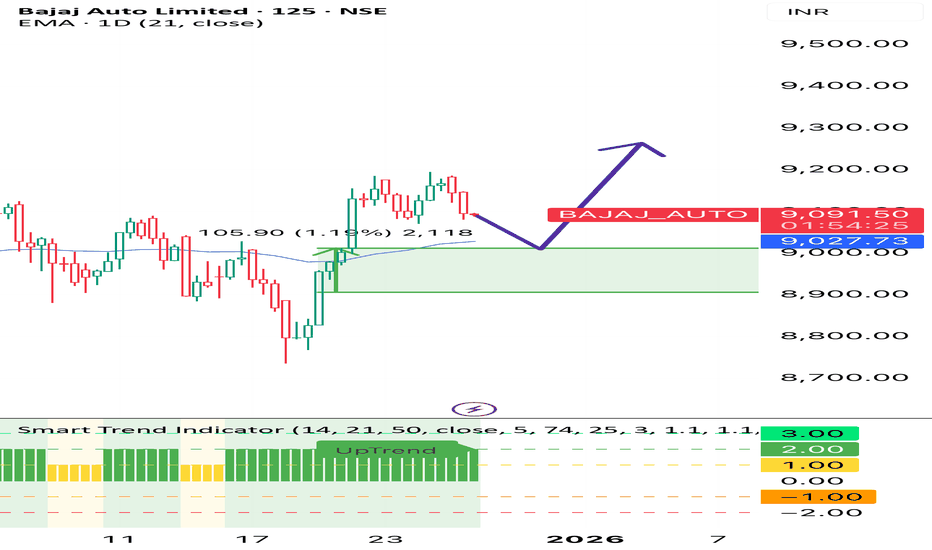
BAJAJ AUTO LONG SETUPLogic: BAJAJ AUTO is creating an up flag pattern on the weekly, followed by uptrend on the Daily.
The marked demand is strong setup.
Inspite of the fact that a stronger zone exist below that zone, but with understanding that if prices retrace into the below level the strength might be lost for an upmove.
The zone also is near 21 DEMA level.
Hence considering that and keeping strict SL below the marked level of atleast 10%DATR, long opportunities can be seen.
XAUUSD | 1H | Liquidity-Based SetupPrice is currently trading inside a well-defined range, with liquidity clearly resting on both sides.
• The equal highs / range high above act as buy-side liquidity, likely to be raided before any meaningful directional move.
• A liquidity sweep to the upside is expected first, tapping into premium pricing and inducing late buyers.
• Post sweep, watch for shift in market structure on LTF, indicating smart money distribution.
• Downside targets align with the HTF demand / discount zone, where unmitigated liquidity rests.
Execution Plan
No blind entries
Entry will be taken only if LTF confirms reversal after liquidity grab, in alignment with HTF narrative
Targeting a range expansion → distribution → markdown sequence
This is a classic liquidity engineering setup, not a breakout trade.
A Bullish Idea A relife Rally Idea, just an Idea
BTC has not been able to push lower. The Low has been stuck for 3 weeks. We think we might have broken the rising wage.
Ideas.
1. Might got to 91k - 98k. If you check the chart in 2021, exactly this kind of chart appeared, and BTC went straight to 69k from 41k. I am not saying the same thing might happen, I see a lot more liquidity building on top than bottom.
2. Some actual whales are still long from 90k
3. Falling Wage appears just today with 5 Elliot waves Correction
Probability: 20%
XAUUSD (Gold) – 15M | SMC Trade IdeaPrice has delivered a clean impulsive bullish leg, displacing above prior structure and confirming bullish BOS on the 15M timeframe. The move was followed by a brief pause, forming a premium supply reaction, which is now being used as a mitigation entry.
SMC Context
Strong bullish displacement confirms institutional intent
Entry aligned at discount to premium flip after BOS
Stop placed above the protected high to invalidate bullish narrative
Targets aligned with liquidity resting below equal lows / demand zone
Execution Plan
Bias: Short-term sell from premium
Entry: At marked mitigation zone
SL: Above recent high
TP: Liquidity sweep into lower demand zone
RR: Favorable, asymmetric structure
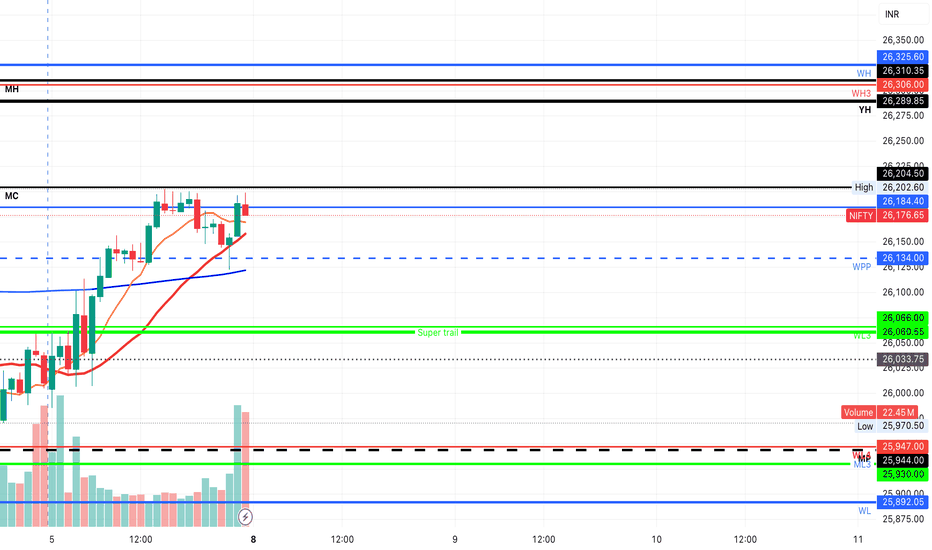
Weekly Wrap : #Nifty50 How strong a rebound will be?First Step of a successful trader is to build a Trade plan & review what he has done. (education purpose for all )
*Trend is up.
*Trade plan: Buy on Dip
* Critical Levels:
* Resistance:26180/26300
* Support: 25900/25800
Jai Hind.
Disclaimer :
This video is only for educational purposes. Please consult your financial advisor before you take any trade.
Real-Time XAG/USD Chart Analysis: Bullish Momentum Builds TowardFOREXCOM:XAGUSD
Real-Time XAG/USD Chart Analysis: Bullish Momentum Builds Toward $60
As of December 8, 2025 (Intraday: Early Trading)
Current Price: 58.31 USD (Down ~0.08% from previous close of 58.36; trading range: 57.59–58.74)
Asset: XAG/USD (Silver Spot vs. US Dollar)
Key Context: Silver's consolidating just shy of its all-time high of 59.42 hit earlier this week, with fresh ETF inflows and tightening physical inventories underscoring the uptrend. Amid Fed rate-cut bets and robust industrial demand (solar, AI), the technical setup leans Strong Buy—a pullback could be a gift for longs eyeing new records.
Quick Macro Snapshot
Tailwinds: Weaker USD from softer PCE inflation and labor data, plus record SLV ETF inflows (highest in 10 years). Supply crunch on Shanghai exchanges at multi-year lows, with green tech demand projected to drive deficits. Silver's 2025 YTD gains now at ~83%, outpacing gold's rally.
Headwinds: Overstretched speculative positioning could spark profit-taking; hawkish Fed signals next week might cap upside if yields rebound.
Technical Breakdown
Pulling from daily and 4H charts, the bias is firmly bullish despite minor intraday dips:
Trend & Moving Averages (Strong Buy):
Daily: Price well above rising 200-day EMA (~55.00) and 50-day EMA (~50.00), with all major MAs aligned bullish. 200-hour EMA at 56.30 provides dynamic support.
4H: Golden cross intact on EMAs; buyers defending the ascending channel.
Implication: Uptrend channel from October lows holding; retest of $59+ imminent on volume pickup.
Momentum Indicators (Neutral with Bullish Tilt):
RSI (14): 50.82 (Neutral)—cooled from overbought but no divergence yet, leaving room for extension.
MACD (12,26): Recently slipped negative below zero line (bearish histogram), signaling short-term downside momentum, but line still above signal overall.
Stochastics (9,6): ~65 (Buy territory); not overbought.
CCI (14): Neutral (~0); Williams %R: -45 (Mild buy).
ADX (14): 28 (Moderate trend strength, bullish direction).
Implication: Momentum pausing after the ATH push, but neutral RSI avoids sell signals—watch for bullish crossover.
Volume & Volatility:
ATR (14): ~0.85 (Elevated vs. recent avg., indicating volatility spike post-breakout).
Bull/Bear Power: Bulls dominant (+0.45), with options flow heavy on calls.
Pivot Points & Key Levels (Classic):LevelPriceTypeR359.50ResistanceR259.20ResistanceR159.00ResistancePivot58.15NeutralS157.50SupportS256.50SupportS356.20Support
Support Cluster: 56.20–56.50 (200h EMA + key zone; break below eyes 55.25 weekly support).
Resistance: 59.00–59.35 (recent ATH; clear for $60+ push).
Fibonacci: 61.8% extension from Oct lows targets 60.50.
Weekly Outlook
Broader uptrend: Strong Buy on MAs; Triangle pattern resolving higher, with potential test of 55.25 support before rally to 60.65–68.05. YTD doubling makes $65 realistic if Fed cuts materialize.
Risk: Drop below 56.20 could accelerate to 54–55 (prior resistance-turned-support), but low probability amid deficit forecasts.
Bias: Buy the dip—industrial tailwinds and ETF momentum point to $60 by quarter-end.
Trade Takeaway: Long above 58.15 pivot (stop below 56.50). Target R1 at 59.00 for 1:2 risk/reward. Squad, silver's stealing gold's thunder—$60 next, or Fed-induced pause? What's your play? #XAG #SilverAnalysis #SignalSquad
Weekly Wrap : #Nifty50 Bulls are here to stay? First Step of a successful trader is to build a Trade plan & review what he has done. (education purpose for all )
*Trend is up.
*Trade plan: Buy on Dip
* Critical Levels:
* Resistance:26300/26470
* Support: 26060/25950
Jai Hind.
Disclaimer :
This video is only for educational purposes. Please consult your financial advisor before you take any trade.