Short
Short
 Long
Long
 Long
Long
 Long
Long
Tata Motors Weekly Analysis: Double Top Confirmed—What’s Next?Tata Motors Passenger Vehicles Ltd on the weekly timeframe shows a clear transition from a strong uptrend to a corrective phase.
After a long consolidation in 2021–2023, the stock gave a powerful breakout followed by a healthy retest, which triggered a multi-year rally.
The upmove slowed near the major resistance and supply zone around ₹590–₹690, where heavy profit booking created a distribution phase.
In 2025, the chart formed a classic Double Top pattern , indicating weakening bullish momentum. The breakdown below the neckline confirms bearish sentiment, pushing the price toward lower support zones.
Key supports lie at ₹318, ₹312, ₹273, ₹266, and the major demand zone between ₹218–₹232, where long-term buyers may re-enter.
Upside strength will return only if the price reclaims the neckline and sustains above the major resistance at ₹452–₹495.
Until then, the short-term trend remains bearish while long-term structure stays intact above the demand zone.
 Short
Short
Best buying Opprtunity in Reliance stock Reliance Industries Announces ₹20,000 Crore Green Energy Joint Venture
Reliance Industries Limited (RIL) has partnered with a leading European firm to invest ₹20,000 crore in India’s renewable energy sector.
The joint venture aims to accelerate the development of solar power, wind energy, and green hydrogen production.
As part of this collaboration, advanced gigafactories will be established to manufacture solar photovoltaic (PV) modules, wind turbines, and electrolyzers, promoting indigenous production under the ‘Make in India’ initiative.
The project is expected to generate thousands of direct and indirect employment opportunities, particularly for engineers, technicians, and skilled professionals.
This strategic partnership will contribute significantly to reducing carbon emissions, aligning with India’s Net Zero Emission targets.
Additionally, the venture will enhance India’s position in the global renewable energy market by integrating next-generation energy solutions, smart grid technology, and AI-driven energy management systems.
Support Levels:
Current Support Zone: ₹1,205 - ₹1,214
Extended Support Level: ₹1,150
Major Support Zone: ₹999 - ₹1,019
Resistance Levels:
Immediate Resistance Zone: ₹1,298 - ₹1,316
First Short-term Target: ₹1,450
Second Short-term Target: ₹1,650
Major Resistance Zone: ₹1,578 - ₹1,611 (near all-time high)
The stock is currently testing the support zone of ₹1,205 - ₹1,214, and if this level breaks, the next downside level to watch is ₹1,150. On the upside, the ₹1,298 - ₹1,316 zone acts as resistance, with potential for further movement towards ₹1,450 and ₹1,650 if strength builds.
LIKE & SHARE , Comment For More Stock Analysis
Long 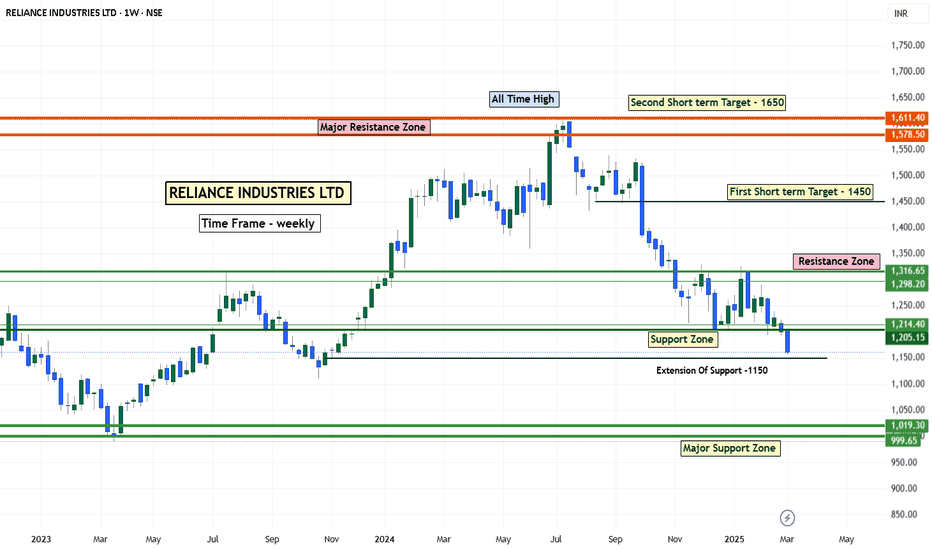
Pivot Points - Traditional🔎 Overview
Traditional Pivot Points are widely used reference levels derived from the previous session’s High, Low, and Close.
They help traders identify equilibrium , short-term trend direction , and key reaction zones where price may bounce or reverse.
The central Pivot Point (P) acts as the day’s balance line, while Resistance (R1–R5) and Support (S1–S5) levels map out potential price behavior for the current session.
---------------------------------------------------------------
📊 What the Levels Represent
🔹 Pivot Point (P)
1. A pre-calculated central level reflecting market equilibrium.
2. Price above P → bullish bias.
3. Price below P → bearish bias.
🔹 Resistance Levels (R1, R2, R3…)
• Highlight potential upside reaction zones.
• Useful for spotting breakout targets, continuation levels, or reversal points.
🔹 Support Levels (S1, S2, S3…)
• Mark potential downside reaction zones.
• Identify areas where buyers may step in or momentum may slow.
---------------------------------------------------------------
🟩 Bullish Bias
1. Price opens above Pivot Point (P) → early buyer control.
2. Long Opportunity (Pullback) : A retest and bounce from the Pivot confirms support.
3. Strong Momentum : A breakout above R1 strengthens the bullish structure.
4. Trend Continuation : Sustained price action above R2 reflects strong upside momentum.
---------------------------------------------------------------
🟥 Bearish Bias
1. Price opens below Pivot Point (P) → early seller control.
2. Short Opportunity (Pullback) : A retest and rejection from the Pivot confirms resistance.
3. Strong Momentum : Breakdown below S1 signals rising bearish pressure.
4. Trend Continuation : Consistent action below S2 suggests a short-term downside trend.
---------------------------------------------------------------
📝 Summary
• Pivot Points offer a structured roadmap for short-term price behaviour.
• P = balance line; R-levels = upside targets; S-levels = downside zones.
• Bias depends on where price opens relative to P.
• Helpful for traders using structure, pullbacks, and breakout confirmation in lower timeframes.
---------------------------------------------------------------
⚠️ Disclaimer
📘 For educational purposes only.
🙅 Not SEBI registered.
❌ Not a buy/sell recommendation.
🧠 Purely a learning resource.
📊 Not Financial Advice. Education 
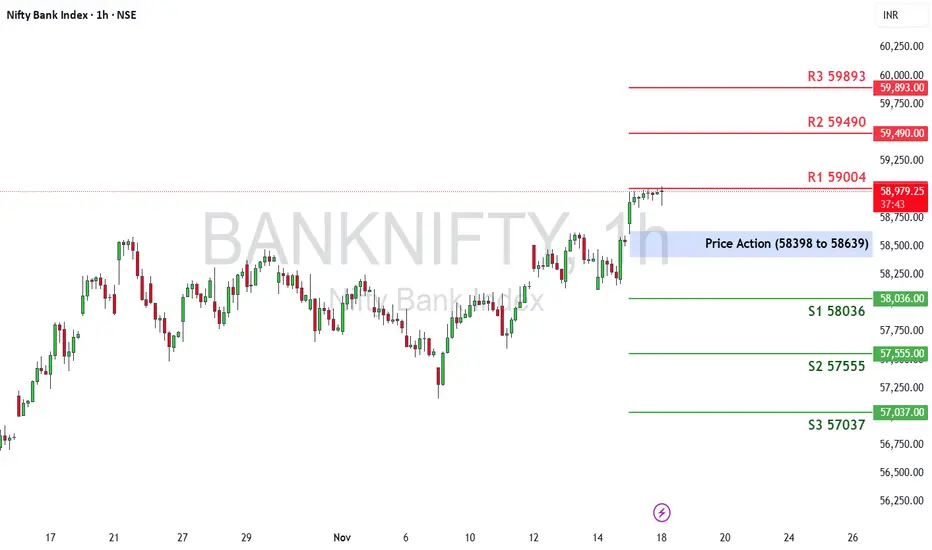
Bank Nifty Weekly Outlook (17th Nov – 21st Nov 2025)The Nifty Bank Index last week ended at 58,517.55, posting a healthy +1.11% gain. The index continued its upward momentum and is now trading near a crucial supply zone, indicating that the market is at an important decision point for the coming week.
🔹 Key Levels for the Upcoming Week
📌 Price Action Pivot Zone (58,398 to 58,639)
This blue-shaded zone marks the key decision area. Sustaining above 58,639 may invite strong buying interest, while rejection from this zone could lead to mild profit booking.
🔻 Support Levels:
S1: 58,036
S2: 56,919
S3: 57,037
🔺 Resistance Levels:
R1: 59,004
R2: 59,490
R3: 59,893
📈 Market Outlook
✅ Bullish Scenario:
If Bank Nifty sustains above the Pivot Zone (58,639), the index may move toward R1 (59,004). A strong breakout above this level could extend the rally toward R2 (59,490) and eventually R3 (59,893).
❌ Bearish Scenario:
If the index falls below 58,398, short-term weakness may drag it toward S1 (58,036), followed by S2 (56,919) and S3 (57,037). A weekly close below 56,900 could indicate the beginning of a deeper corrective phase.
Disclaimer: aliceblueonline.com Nifty 50 Weekly Outlook ( 17th Nov – 21st Nov 2025)The Nifty 50 Index last week ended at 25,910.05, posting a +1.64% gain. The index bounced strongly from lower levels and is now trading near a key supply zone, indicating that the market may see either continuation or consolidation depending on how price reacts to this region.
🔹 Key Levels for the Upcoming Week
📌 Price Action Pivot Zone (25830 to 25991)
This blue-shaded zone represents the crucial decision area. Sustaining above 25,991 may attract strong buying interest, while rejection from this zone could lead to short-term profit booking.
🔻 Support Levels:
S1: 25,590
S2: 25,270
S3: 24,895
🔺 Resistance Levels:
R1: 26,234
R2: 26,558
R3: 27,027
📈 Market Outlook
✅ Bullish Scenario:
If Nifty holds above the Pivot Zone (25830–25991), bullish momentum could push the index toward R1 (26,234). A strong breakout above this may extend the rally toward R2 (26,558) and eventually R3 (27,027).
❌ Bearish Scenario:
If the index fails to sustain above 25,830, short-term weakness may emerge, dragging Nifty toward S1 (25,590). Further breakdowns could open doors to S2 (25,270) and S3 (24,895). A weekly close below 24,900 may signal a deeper correction.
Disclaimer: aliceblueonline.com Tesla’s Technical Outlook and Future Possibilities Tesla’s Technical Outlook and Future Possibilities
Tesla’s current price action reflects a phase of consolidation after a strong rally, where traders are carefully observing how the stock reacts near crucial levels.
The stock’s position around $439 indicates indecision between buyers and sellers, as it trades between an important support trendline and a well-defined resistance zone.
This structure typically represents a buildup phase before a major directional move.
The inclined support line has shown consistent strength over the past few months, highlighting steady institutional interest even during market pullbacks.
As long as the price respects this trendline, the overall technical bias remains positive. A bounce from this level could reignite bullish momentum, targeting the higher range of $480 to $490.
A breakout above this ceiling could confirm a continuation of the long-term uptrend, possibly leading to new record highs.
On the contrary, a failure to sustain above the inclined support may shift market sentiment toward short-term weakness.
If selling pressure intensifies, the stock could revisit lower supports around $400 or even the $350 area, which served as the base of the previous breakout.
Such a pullback, however, would not necessarily signal the end of Tesla’s larger bullish cycle — it could instead offer a healthier retracement for long-term investors.
Overall, Tesla’s chart reflects a stock at a turning point. The next move will depend on how it behaves around its support structure and whether it can overcome the heavy resistance overhead.
Traders should stay alert to both technical triggers and fundamental news especially updates from the Chinese market, production data, and macroeconomic factors.
Tesla remains one of the most watched stocks globally, and its upcoming moves are likely to set the tone for broader sentiment in the electric vehicle sector.
 Long
Long
Bank Nifty Weekly Outlook (3rd Nov – 7th Nov 2025)The Nifty Bank Index last week ended at 57,776.35, posting a modest +0.13% gain. The index showed signs of indecision near the recent high, indicating that the market is pausing after a strong bullish run in October.
🔹 Key Levels for the Upcoming Week
📌 Price Action Pivot Zone:
57,656 to 57,897 – This blue-shaded range marks the key decision area. Sustaining above this zone may invite renewed buying interest, while a close below could lead to mild profit booking.
🔻 Support Levels:
S1: 57,297
S2: 56,819
S3: 56,426
🔺 Resistance Levels:
R1: 58,259
R2: 58,741
R3: 59,335
📈 Market Outlook
✅ Bullish Scenario:
If Bank Nifty sustains above 57,897, a move toward R1 (58,259) can be expected. Sustained strength above this level may open the path toward R2 (58,741) and R3 (59,335) in the near term.
❌ Bearish Scenario:
If the index falls below 57,656, short-term weakness may drag it toward S1 (57,297), followed by S2 (56,819) and S3 (56,426). A weekly close below 57,200 could signal the beginning of a corrective phase.
Disclaimer: lnkd.in Nifty 50 Weekly Outlook ( 3rd Nov – 7th Nov 2025)The Nifty 50 Index last week ended at 25,722.10, posting a -0.28% decline. The index showed mild profit-booking near resistance after a sharp rally in recent weeks, suggesting a potential consolidation phase before the next directional move.
🔹 Key Levels for the Upcoming Week
📌 Price Action Pivot Zone:
25,642 to 25,803 – This blue-shaded zone represents the key decision area. Sustaining above this range may attract renewed buying interest, while a breakdown below could trigger short-term profit booking.
🔻 Support Levels:
S1: 25,403
S2: 25,084
S3: 24,791
🔺 Resistance Levels:
R1: 26,045
R2: 26,368
R3: 26,680
📈 Market Outlook
✅ Bullish Scenario:
If Nifty holds above 25,803, a breakout move could lift the index toward R1 (26,045). Sustained momentum above this level may extend gains toward R2 (26,368) and R3 (26,680) in the coming sessions.
❌ Bearish Scenario:
If the index slips below 25,642, short-term weakness could drag it toward S1 (25,403), followed by S2 (25,084) and S3 (24,791).
Disclaimer: lnkd.in Long 
 Short
Short
 Long
Long
 Long
Long
 Long
Long
Bank Nifty Weekly Outlook (20th Oct – 24th Oct 2025)The Bank Nifty ended the week at 57,713.35, gaining +1.95%, showcasing strong momentum and follow-through buying from lower levels.
🔹 Key Levels for the Upcoming Week
📌 Price Action Pivot Zone:
57,593 to 56,834 – This blue-shaded range remains the crucial zone to watch. Sustaining above this area may lead to further bullish expansion, while a drop below could invite profit booking.
🔻 Support Levels:
S1: 57,235
S2: 56,756
S3: 56,300
🔺 Resistance Levels:
R1: 58,195
R2: 58,678
R3: 59,052
📈 Market Outlook
✅ Bullish Scenario:
If Bank Nifty holds above the pivot high of 57,593, the bullish tone may continue toward R1 (58,195). A breakout above this level can extend gains toward R2 (58,678) and R3 (59,052).
❌ Bearish Scenario:
If the index slips below the pivot low of 56,834, short-term weakness may emerge, pulling prices down toward S1 (57,235), and further toward S2 (56,756) and S3 (56,300).
Disclaimer: tinyurl.com


 Long
Long
 Long
Long