Pivot Points
DE10YDE10Y – Bullish Breakout
The German 10-year yield just broke above the key 2.74–2.75% resistance that has capped the market for weeks. This move confirms a shift from consolidation back into an uptrend. As long as yields hold above the breakout level, momentum favors further upside toward 2.80% and beyond. Higher yields reflect firming inflation expectations and a market leaning toward a “higher-for-longer” ECB path.
RELIANCE LONG TRADETRADE SETUP: Reliance long trade on weekly time frame
Logic: Reliance is in continous uptrend, a dip to the marked weekly level around 1500 can be seen as opportunity to buy.
If taken in futures during entry consider entering in far month expiry.
Maintain stoploss as marked and position sizing.
Tata Motors Weekly Analysis: Double Top Confirmed—What’s Next?Tata Motors Passenger Vehicles Ltd on the weekly timeframe shows a clear transition from a strong uptrend to a corrective phase.
After a long consolidation in 2021–2023, the stock gave a powerful breakout followed by a healthy retest, which triggered a multi-year rally.
The upmove slowed near the major resistance and supply zone around ₹590–₹690, where heavy profit booking created a distribution phase.
In 2025, the chart formed a classic Double Top pattern , indicating weakening bullish mome
Bears Knocking, Then Reversal ? Weekly Wrap #Nifty50First Step of a successful trader is to build a Trade plan & review what he has done. (education purpose for all )
*Trend is rangbound, Short term Bearish.
*Trade plan: Sell on rise
* Critical Levels:
* Resistance:26135- 26200
* Support: 25960-25853
Jai Hind.
Disclaimer :
This video is only for educational purposes. Please consult your financial advisor before you take any trade.
Best buying Opprtunity in Reliance stock Reliance Industries Announces ₹20,000 Crore Green Energy Joint Venture
Reliance Industries Limited (RIL) has partnered with a leading European firm to invest ₹20,000 crore in India’s renewable energy sector.
The joint venture aims to accelerate the development of solar power, wind energy, and green hydrogen production.
As part of this collaboration, advanced gigafactories will be established to manufacture solar photovoltaic (PV) modules, wind turbines, and electrolyzers, promoting indigen
Pivot Points - Traditional🔎 Overview
Traditional Pivot Points are widely used reference levels derived from the previous session’s High, Low, and Close.
They help traders identify equilibrium , short-term trend direction , and key reaction zones where price may bounce or reverse.
The central Pivot Point (P) acts as the day’s balance line, while Resistance (R1–R5) and Support (S1–S5) levels map out potential price behavior for the current session.
---------------------------------------------------------------
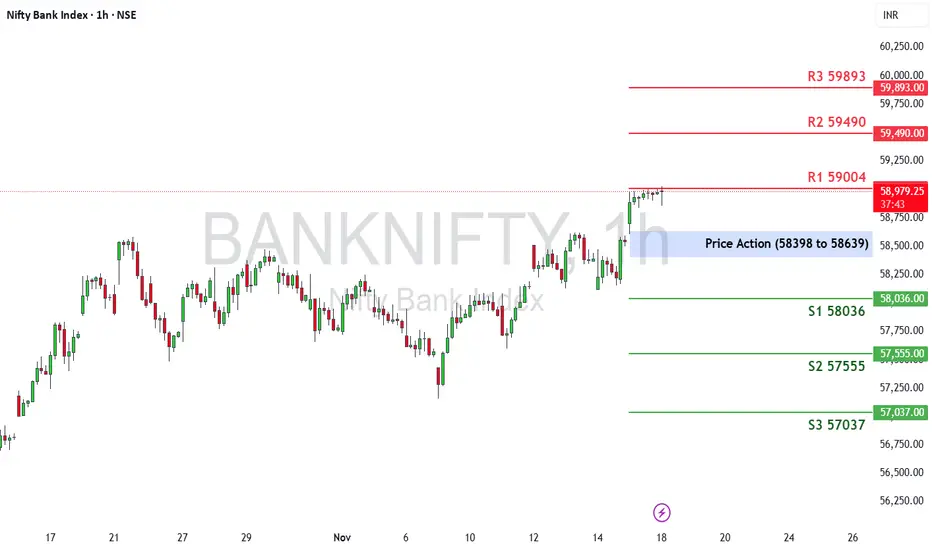
Bank Nifty Weekly Outlook (17th Nov – 21st Nov 2025)The Nifty Bank Index last week ended at 58,517.55, posting a healthy +1.11% gain. The index continued its upward momentum and is now trading near a crucial supply zone, indicating that the market is at an important decision point for the coming week.
🔹 Key Levels for the Upcoming Week
📌 Price Action Pivot Zone (58,398 to 58,639)
This blue-shaded zone marks the key decision area. Sustaining above 58,639 may invite strong buying interest, while rejection from this zone could lead to mild profit b
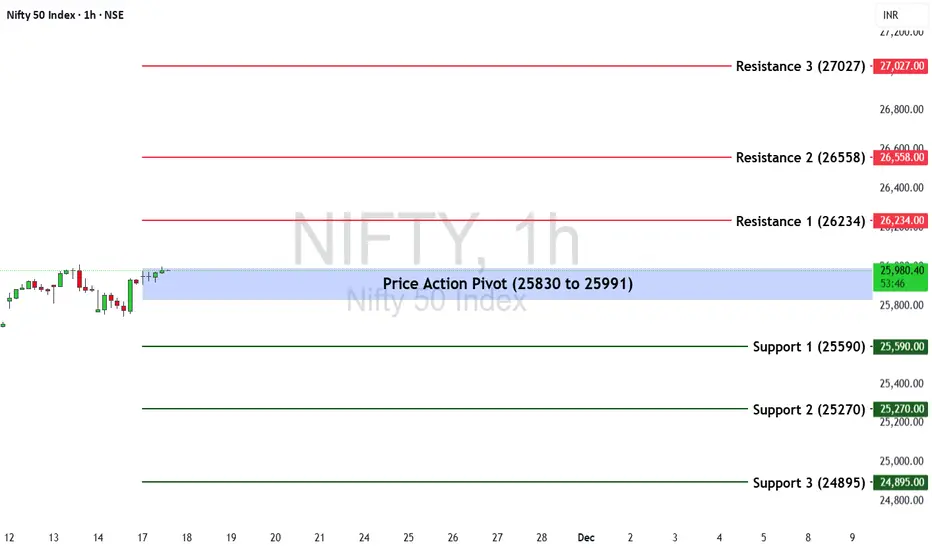
Nifty 50 Weekly Outlook ( 17th Nov – 21st Nov 2025)The Nifty 50 Index last week ended at 25,910.05, posting a +1.64% gain. The index bounced strongly from lower levels and is now trading near a key supply zone, indicating that the market may see either continuation or consolidation depending on how price reacts to this region.
🔹 Key Levels for the Upcoming Week
📌 Price Action Pivot Zone (25830 to 25991)
This blue-shaded zone represents the crucial decision area. Sustaining above 25,991 may attract strong buying interest, while rejection from th
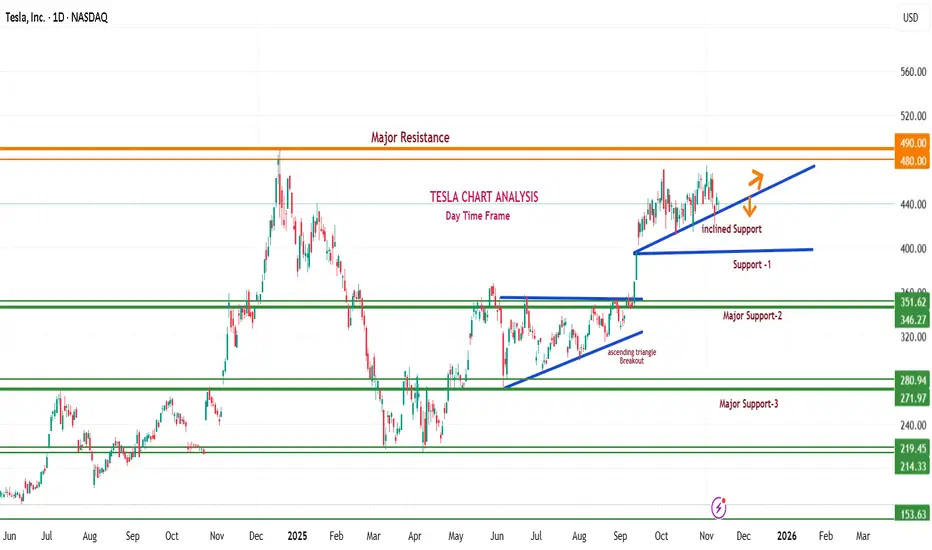
Tesla’s Technical Outlook and Future Possibilities Tesla’s Technical Outlook and Future Possibilities
Tesla’s current price action reflects a phase of consolidation after a strong rally, where traders are carefully observing how the stock reacts near crucial levels.
The stock’s position around $439 indicates indecision between buyers and sellers, as it trades between an important support trendline and a well-defined resistance zone.
This structure typically represents a buildup phase before a major directional move.
The inc
EUR/USD | Institutional Demand RejectionPrice action shows a clean liquidity sweep below the prior session’s low, tapping into a well-defined 5-min demand zone aligned with the 1H structural pivot. Orderflow shift confirmed as buy-side momentum emerged with displacement and follow-through above short-term structure.
Position initiated post-confirmation close, with risk anchored below the sweep low. Upside targets set near 1.1510–1.1520, aligning with local liquidity cluster and FVG mitigation zone.
Market Context:
• EUR/USD rebounde
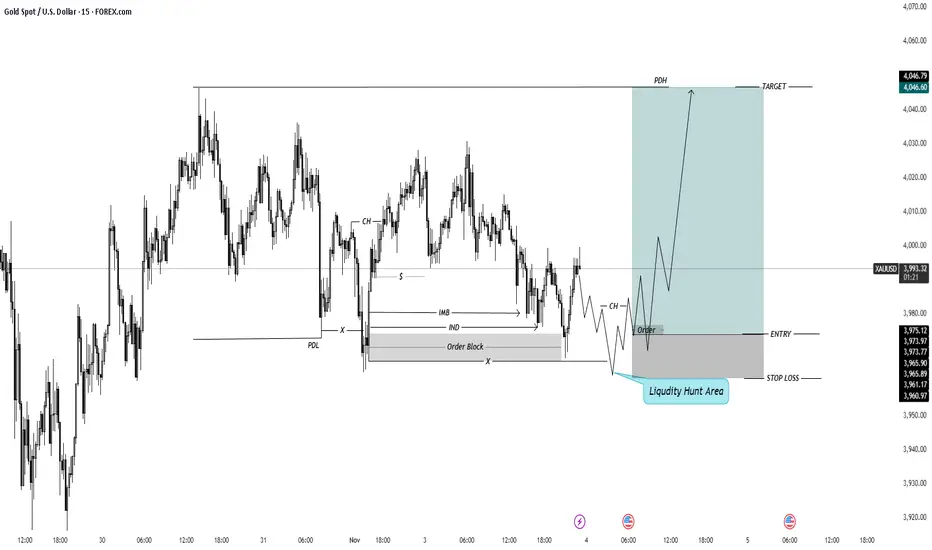
XUD/USD-Long-15MinInitially, the Previous Day High (PDH) and Previous Day Low (PDL) are marked on the Daily Time Frame. After that, we switch to the 4-Hour Time Frame to identify the Imbalance (IMB) candle for a potential entry setup. Once the IMB candle is identified, we move to the 15-Minute Time Frame, where the chart clearly highlights the Order Block and Liquidity Area.
The market then shows a clear Change of Character (CHOCH) indicating a shift from an uptrend. Following this, a liquidity hunt occurs as th
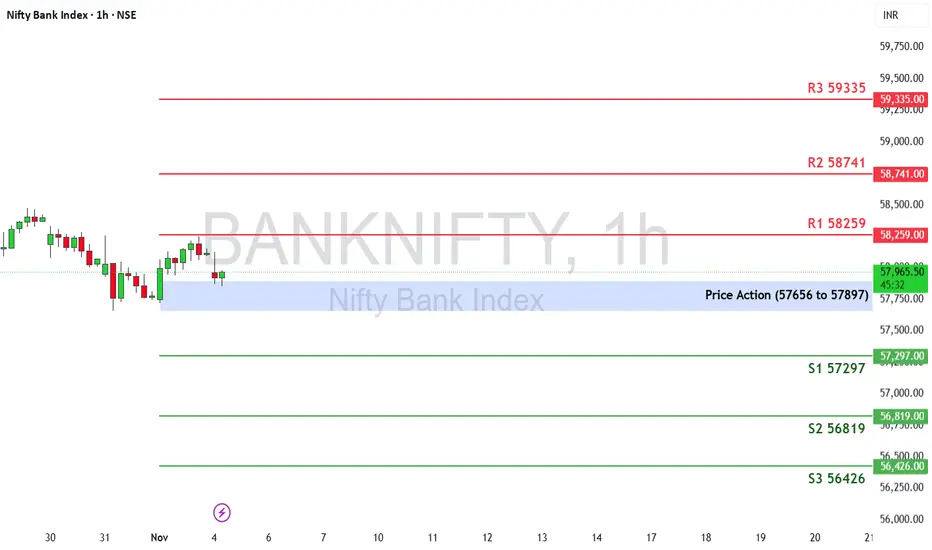
Bank Nifty Weekly Outlook (3rd Nov – 7th Nov 2025)The Nifty Bank Index last week ended at 57,776.35, posting a modest +0.13% gain. The index showed signs of indecision near the recent high, indicating that the market is pausing after a strong bullish run in October.
🔹 Key Levels for the Upcoming Week
📌 Price Action Pivot Zone:
57,656 to 57,897 – This blue-shaded range marks the key decision area. Sustaining above this zone may invite renewed buying interest, while a close below could lead to mild profit booking.
🔻 Support Levels:
S1: 57,297
S
Nifty 50 Weekly Outlook ( 3rd Nov – 7th Nov 2025)The Nifty 50 Index last week ended at 25,722.10, posting a -0.28% decline. The index showed mild profit-booking near resistance after a sharp rally in recent weeks, suggesting a potential consolidation phase before the next directional move.
🔹 Key Levels for the Upcoming Week
📌 Price Action Pivot Zone:
25,642 to 25,803 – This blue-shaded zone represents the key decision area. Sustaining above this range may attract renewed buying interest, while a breakdown below could trigger short-term profit
Netflix: Wave Z or a Surprise Truncation Ahead?After a textbook W–X–Y–X structure, Netflix now appears to be sketching the final leg “Z” inside a well-defined descending channel. Each corrective wave has respected the parallel boundaries — a sign of structural discipline rather than chaos.
The latest drop to $1,087.30 tagged the channel’s lower rail and the Major Pivot near $1,064.50, precisely where the RSI has also reached its long-term support zone. This alignment hints that the market may be nearing exhaustion — but whether it’s the end
GBP/CHF | 1H AnalysisPrice has recently swept liquidity beneath the previous low and reacted from a demand zone within the overall bullish structure.
A lower timeframe break of structure confirms potential short-term bullish momentum.
Currently, price is consolidating near the entry zone, with a favorable risk-to-reward setup targeting the previous supply area.
Entry: 1.0605
Stop Loss: 1.0579 (below structural low)
Take Profit: 1.0658 (previous supply / liquidity area)
Bias: Short-term bullish continuation
If
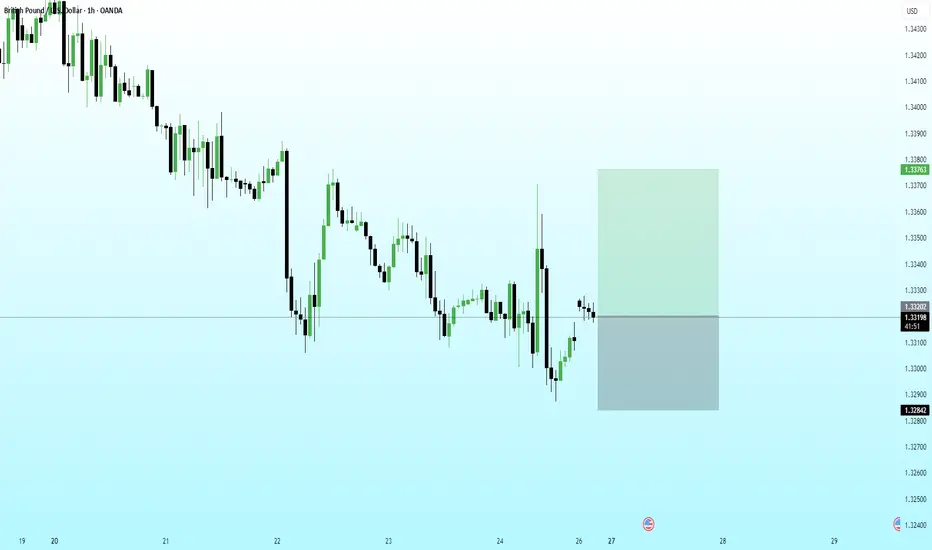
GBP/USD | 1H AnalysisPrice swept liquidity below the recent low and reacted strongly from a discount demand zone.
A bullish displacement followed, signaling a potential reversal in structure.
Currently, price is forming a retracement into the mitigation area — offering a potential continuation to the upside.
Entry: 1.3318
Stop Loss: 1.3284 (below structural low)
Take Profit: 1.3376 (previous supply / liquidity resting above)
Bias: Bullish short-term reversal within corrective structure
If price sustains above
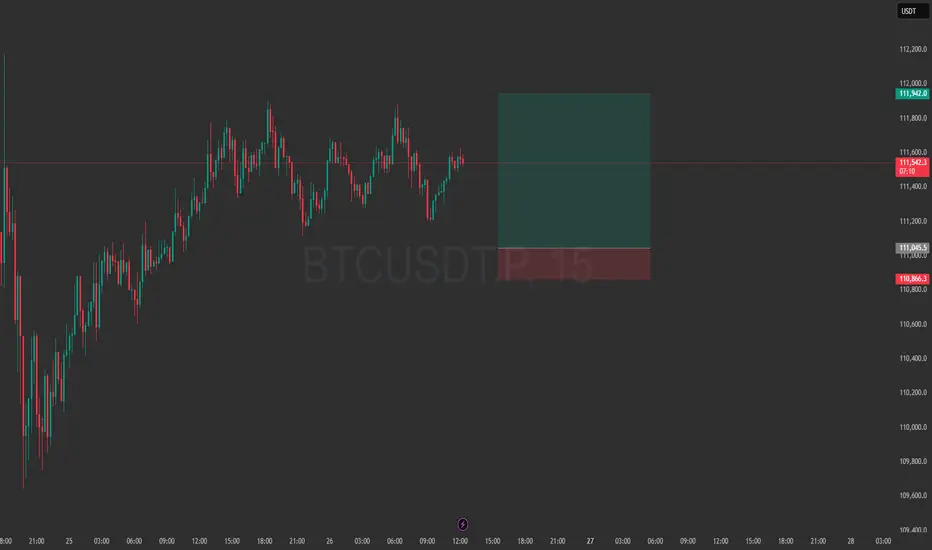
Intraday Long Setup | Oct 26th 2025 | Valid Until Daily ClosePrice might retrace to a strong pivot zone.
Structure remains bullish with potential for continuation after pullback.
Tight risk control.
Watch for price reaction within the red zone. Entry only if confirmation appears
The setup expires at end of the daily candle close.
Intraday Long Setup | Oct 26th 2025 | Valid Until Daily ClosePrice might retrace to a strong pivot zone.
Structure remains bullish with potential for continuation after pullback.
Tight risk control.
Watch for price reaction within the red zone. Entry only if confirmation appears
The setup expires at end of the daily candle close.