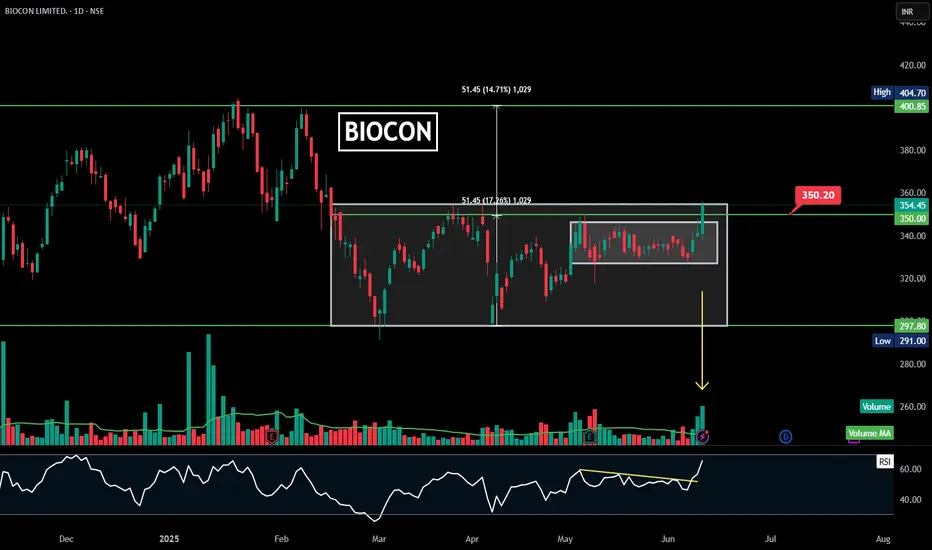
BIOCON |Rectangle | Consolidation Breakout | Daily
### ๐บ **Pattern Overview:**
โ
**Horizontal Rectangle / Consolidation Breakout:**
* **Range:** โน297.80 (support) to โน350.20 (resistance).
* **Breakout Price:** โน350.20 confirmed (recent candle closed above it).
* **Current Price:** โน354.45, showing a breakout and potential further upside.
---
### ๐ฏ **Measured Move Target:**
* **Measured height of the rectangle:** \~โน51.45.
* **Target price zone:** โน400โโน405 in the medium-term.
* **Resistance levels:** โน400.85โโน404.70 (previous swing highs)
Rectangle
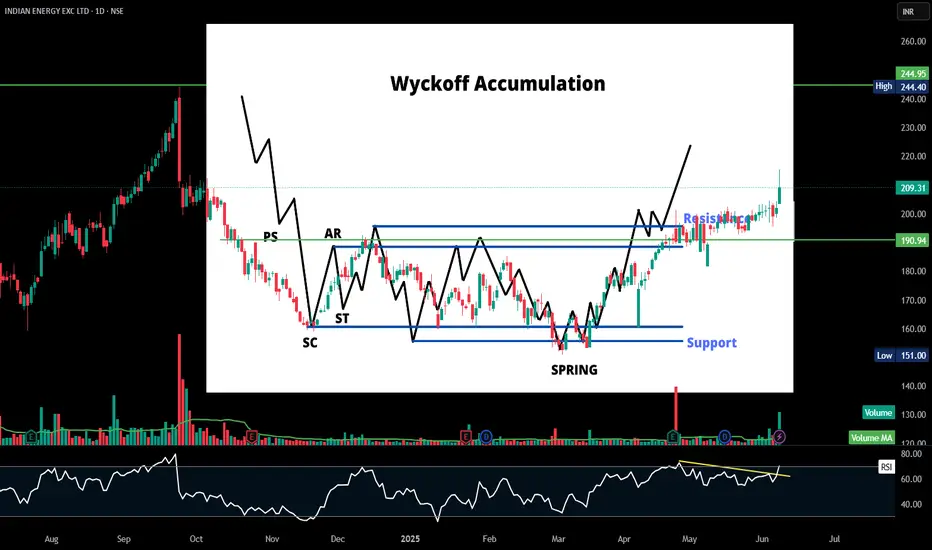
IEX | Consolidation BreakOut | DailyHereโs a **condensed Wyckoff Accumulation Analysis** based on your most recent chart for **Indian Energy Exchange Ltd. (IEX)**:
---
๐ **Key Wyckoff Phases & Levels:**
* **PS (Preliminary Support):** Initial slowing of the downtrend.
* **SC (Selling Climax):** Sharp selloff forming the bottom.
* **AR (Automatic Rally):** First bounce confirming initial demand.
* **ST (Secondary Test):** Testing previous lows around SC.
* **Spring:** Fakeout below support, creating panic-selling before reversal
TRENT | rectangle range breakout |DailyHereโs a **technical analysis summary** for TRENT Ltd (NSE: TRENT) based on the chart you provided:
---
๐ **Pattern Observed:**
The chart highlights a **rectangle range breakout** or a **horizontal consolidation breakout**. Price was consolidating between \~โน4,670 and โน5,750 levels for several weeks and has now broken out above โน5,750, confirming the breakout.
---
๐น **Key Levels:**
* **Breakout zone:** โน5,750
* **Current price:** \~โน5,913.50
* **Next resistance/target:** Measured move targe
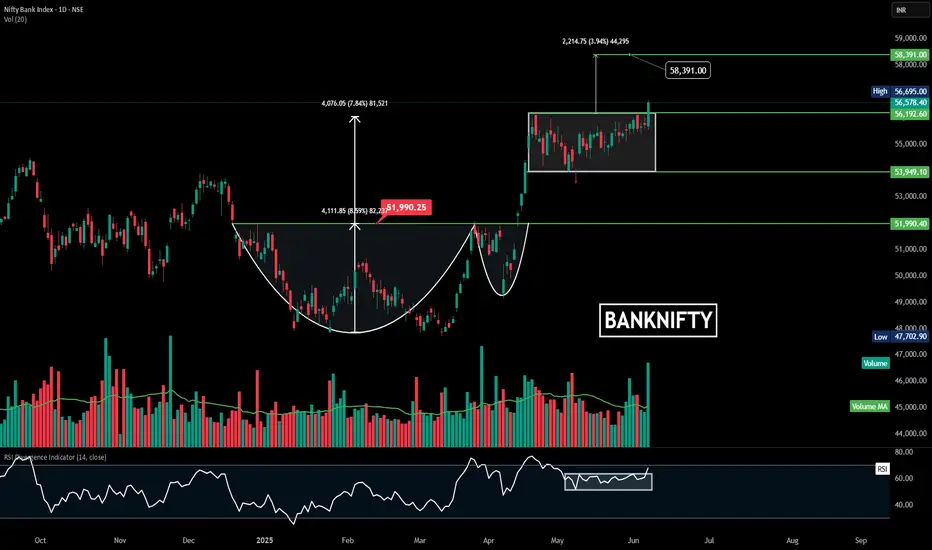
BANKNIFTY | Consolidation breakout | DailyHereโs a technical summary for the BANKNIFTY Index based on the chart:
โ
Pattern: Consolidation breakout is visible.
โ
Breakout Zone: Price has successfully broken out of the consolidation range near 53,949โ56,192 levels.
โ
Target Projection: The measured move suggests a potential upside target at 58,391.
โ
Volume & RSI: Volume is confirming the breakout. RSI (14) is at 67.45, indicating strong momentum with a potential for slight overbought caution.
โ ๏ธ Key Levels to Watch:
Support: 56,192 (b
LT Foods - All Time High Break OutLT Foods has given a all time high BO and is looking great. Factors which make this stock promising:
1. On weekly time frame made 3 White Shoulder Pattern - which is a bullish pattern
2. Breakout after a long consolidation - consolidating from 11 odd months
3. Volume is increasing / steady
4. A rectangular pattern BO as well
5. Fundamentally, LT Foods has lots of opportunities as they have gone beyond India
6. LT Food has ventured in organic food as well with recent 17% acquisition of Nature
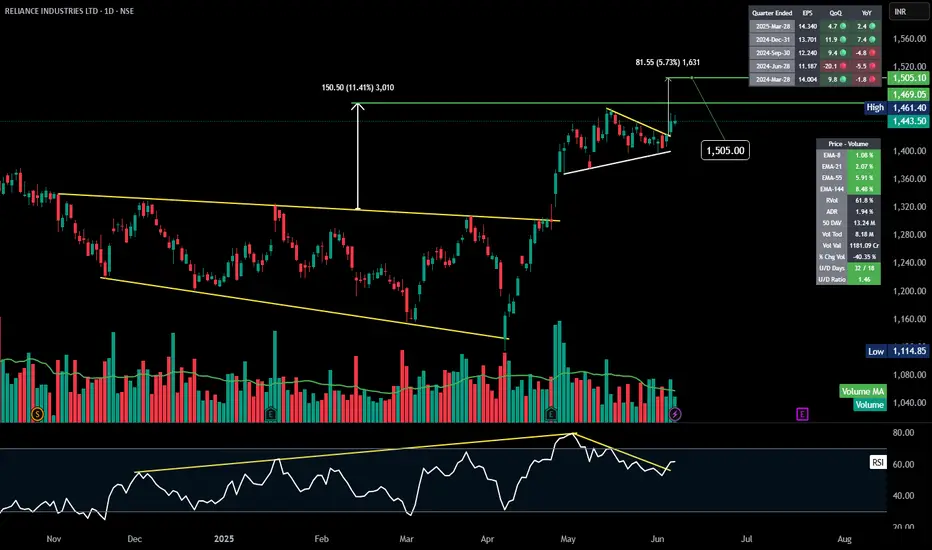
RELIANCE | Symmetrical Triangle | Breakout | Daily Hereโs a detailed technical analysis of **Reliance Industries Ltd (RELIANCE)** based on the images you provided:
---
### ๐ **1๏ธโฃ Pattern Overview:**
* **Falling Wedge Pattern:**
* A large falling wedge spanning several months from 2024 to early 2025, clearly visible in the first set of images.
* The stock broke out of the wedge in April-May 2025, leading to a significant up-move.
* **Continuation Triangle Pattern:**
* Post breakout, the stock formed a symmetrical triangle (or continu
Gold Uptrend Continues June 6, 2025As yesterday Gold made high of 3403, I was expecting to cross upto 3430 but it dropped sharply. News was strong and as it made cautious to investors and safe heaven asset declines moved back to riskers market to 3340.
Now today you can check a pattern and gold is moving in that support and resistance, expecting it to move upward. Currently the situation is unexpected as gold may come down to 3340 and then move upward or directly upward from 3358. Our target is 3375-3389-3400.
Key point.
Resist
HINDZINC | Rectangular Consolidation | Breakout | DailyHereโs a detailed **technical summary and analysis** of the Hindustan Zinc Ltd. (HINDZINC) chart you shared:
---
### **Chart Pattern & Setup:**
โ
**Rectangular Consolidation / Range Breakout:**
* The stock has been trading within a range (rectangle) from approximately **378.15 (low)** to **479.00 (resistance)** for several months (since December 2024).
* This consolidation pattern signifies **accumulation**.
โ
**Breakout:**
* Price action has decisively broken out of the **rectangleโs uppe
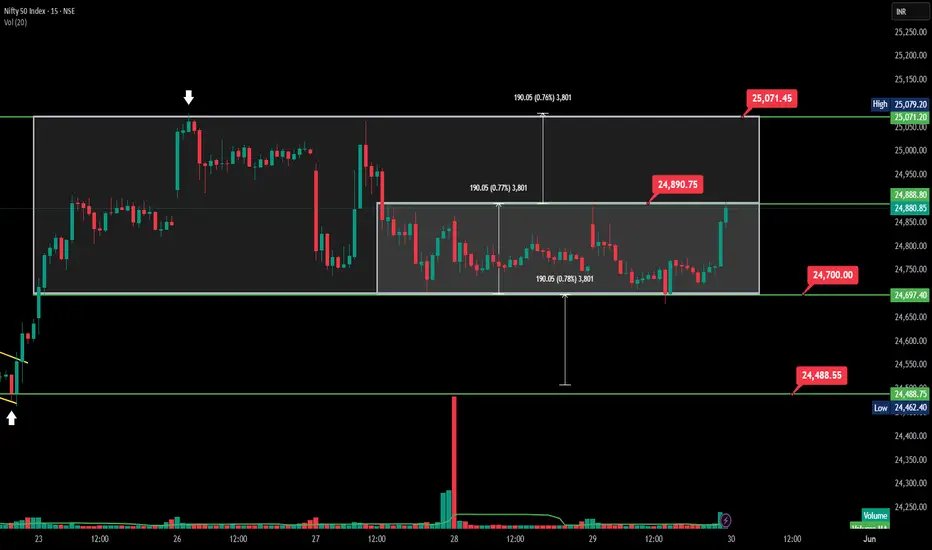
Nifty 50 Consolidation Zone โ Ready to Explode?Here's a **brief high-level analysis** of the **Nifty 50 Index (15-min chart)**:
---
## ๐ **Nifty 50 โ Consolidation & Breakout Setup**
* ๐งฑ **Structure**: Sideways consolidation in a **190-point range**
* ๐ **Zones**:
* **Resistance**: โน24,890
* **Support**: โน24,700.00
* โก **Breakout Watch**: Price approaching upper range
* ๐ต๏ธโโ๏ธ **Volume**: Spikes on breakout attempts hinting smart money interest
---
### ๐ **Scenarios to Track**
* โ
**Bullish breakout above** โน24,891 could lead to a
Nifty 50 chart breakdown (15-min TF) Levels for 29th MayHereโs a breakdown of the **Nifty 50 Index (15-minute chart)**
---
## ๐ง **Intraday Technical Analysis โ Nifty 50 (15M TF)**
**Date:** May 28, 2025
**Pattern Observed:** Box Range Breakdown with Measured Move
**Timeframe:** 15-minute chart
---
### ๐ **1. Chart Structure**
* The index **broke out** of a falling wedge pattern but unable move above 24860.
* **Range formation:** A strong horizontal box range formed between **24,730 โ 25,071**, holding for multiple sessions.
* **Breakdown:** P
15-min intraday chart of Nifty 50 rectangle consolidation This is a **15-min intraday chart of Nifty 50 Index**, showing a **channel and retest**, followed by a potential **pullback setup** within a rectangle consolidation range.
---
### ๐ **Nifty 50 โ Intraday Breakdown & Range Play Analysis**
#### ๐ Chart Breakdown:
* **Range-bound Movement** between:
๐ Resistance: **25,071.45**
๐ Support: **24,730.00**
* **Breakdown from Rectangle:** Price fell sharply from range top to bottom, testing support at **24,730.00**.
* ** Flag Formation:** After
Nifty50 Chart Analysis | Watch 25026 & 24937 | Breakout or Dowwn๐ Nifty 50 Update | Key Levels to Watch! (May 27, 2025)
๐จ Technical Analysis:
Nifty 50 has formed a range after a sharp up move. We are currently seeing a consolidation between 24,937 and 25,026.
๐ Scenarios:
Bullish Breakout above 25,026 โค Target: 25,119
Bearish Breakdown below 24,937 โค Target: 24,841
Both movements are based on the range height of ~90 points, in line with the breakout structure from the previous pole-and-flag pattern.
๐ข Keep an eye on volume confirmation at the breakout/b
HDFC LIFE โ VCP Breakout Setup | ATH ZoneHDFC LIFE โ VCP Breakout Attempt | ATH Test After 44 Months
๐ Structure: Volatility Contraction Pattern (VCP)
๐ฆ Base: Tight consolidation zone (rectangle)
๐ Trend: Higher Highs & Higher Lows
๐ข Volume: Gradually picking up
๐ฅ Last Session: Wide range bullish candle
๐ ATH Zone: Testing Sep 2021 high (44-month range)
๐ Price Action: Trading above Key DMAs
The stock formed a clean VCP structure with tight contractions and shallow pullbacks. It broke out from its recent base and is now testing the al
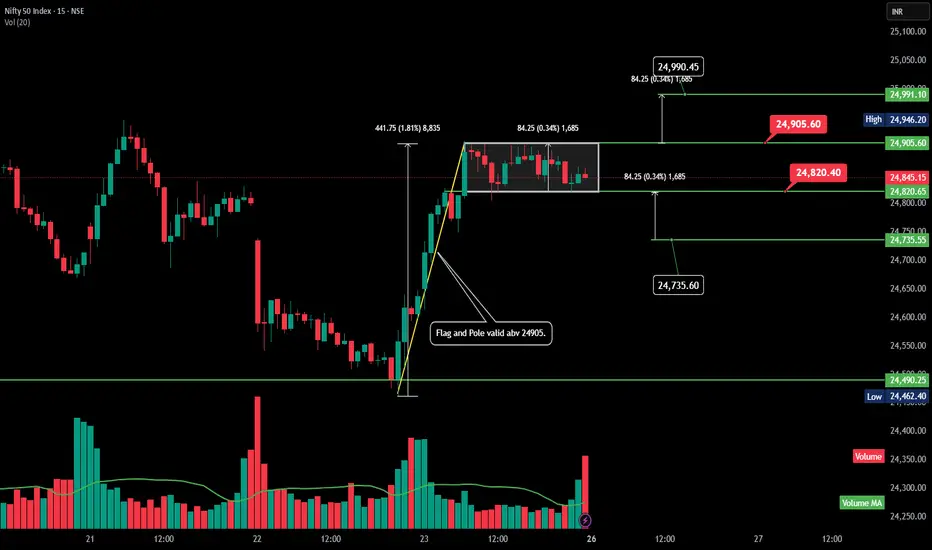
Nifty50 Intraday Setup โ BO Above 24,905 or BD Below 24820Technical analysis of Nifty for 26th May - Summary with both breakout and breakdown scenarios
---
### ๐ **Nifty 50 (15-Min Chart) โ Flag & Pole Pattern Analysis**
**Pattern**: Bullish Flag & Pole
**Pole Height**: \~442 pts
**Flag Range**: โน24,820 โ โน24,905
---
### โ
**Scenario 1: Breakout**
* **Breakout Above**: โน24,905
* **Target**: โน24,991
* **Stop Loss**: โน24,905
* **Comment**: Valid **flag & pole continuation** only if price sustains above โน24,905 with volume.
---
### โ **Scenario 2
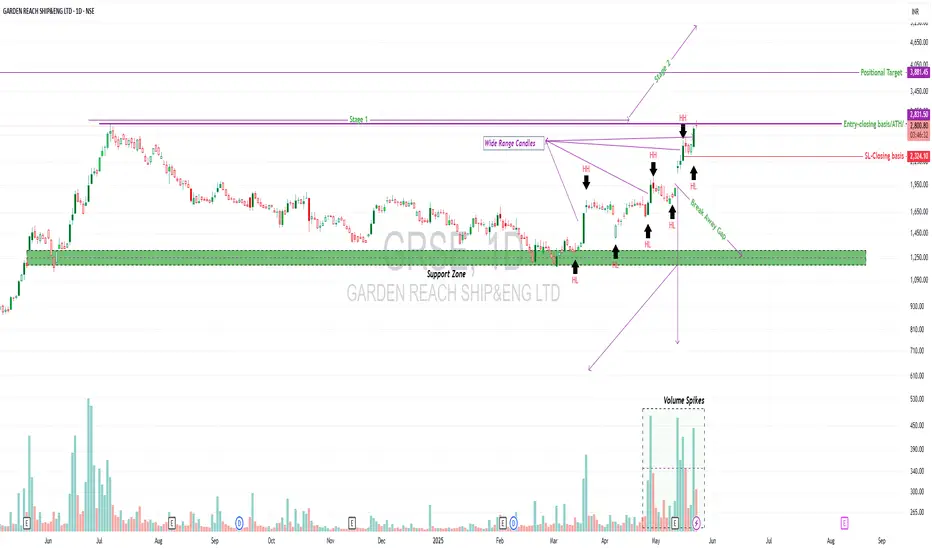
GRSE โ Stage 2 Breakout WatchGRSE โ Stage 2 Breakout Watch ๐ข๐
CMP: โน2,816
Structure: HH-HL forming | Wide Range Candles | ATH Zone
Stage: Transitioning from Stage 1 to potential Stage 2
Support Zone: โน1,200โ1,300
Breakout Trigger: โน2,851+ (All-Time High zone)
๐ง Technical View
GRSE is attempting a breakout from a long consolidation base of nearly a year. The structure has turned constructive:
โ
Trading above all key DMAs
โ
Forming Higher Highs & Higher Lows
โ
Wide-range candles on upmoves, shallow pullbacks
โ
Breakawa
APOLLO rectangular consolidation Breakout - Good volumeHereโs a **technical analysis summary for APOLLO MICRO SYSTEMS LTD** based on the chart you provided:
---
### ๐ **APOLLO MICRO SYSTEMS LTD โ Weekly Chart Summary**
* **Trend:** โ
**Breakout Confirmed**
* Price has broken out above the rectangular consolidation zone after nearly a year of sideways movement.
* **Breakout Zone:**
* Resistance broken: **โน140.45**
* Consolidation range: โน92.87 to โน140.45
* **Target Projection (based on rectangle height):**
* Rectangle height = โน47.58
Gabriel India -Double Bottom Breakout!๐ Gabriel India - Positional Breakout Trade
๐ Technical Overview:
โ
Trend: Strong uptrend, followed by a 32% correction and a double bottom formation .
โ
Breakout Confirmation: Cleared โน565 resistance with strong volume.
โ
Key Levels:
Entry: Above โน600 (Earlier breakout was at โน565)
Stop Loss: โน475 (Closing basis) ๐ป
Positional Target: โน824 (Tentative) ๐ฏ
โ
Moving Averages: Trading above key DMAs, indicating strength.
โ
Market Condition: Stock is breaking out early as markets show signs of re
BASF- Rectangle Pattern Breakout๐ Breakout Stock Alert: BASF India Ltd (BASF)
๐ Price: โน4,902.90โโ๐ Volume: 138.03Kโโ๐
Date: 19-05-2025
โ Pattern Name, Timeframe, Structure & Explanation
Daily Timeframe: Rectangle Base Pattern (5 Months)
Weekly Timeframe: Base Formation in Uptrend
On the daily chart, BASF has been coiling inside a rectangle consolidation pattern between โน4,300โโน4,800 for nearly 5 months. The base is tight, with volatility compression and a subtle rounding shape at the lower support, hinting at accumulatio
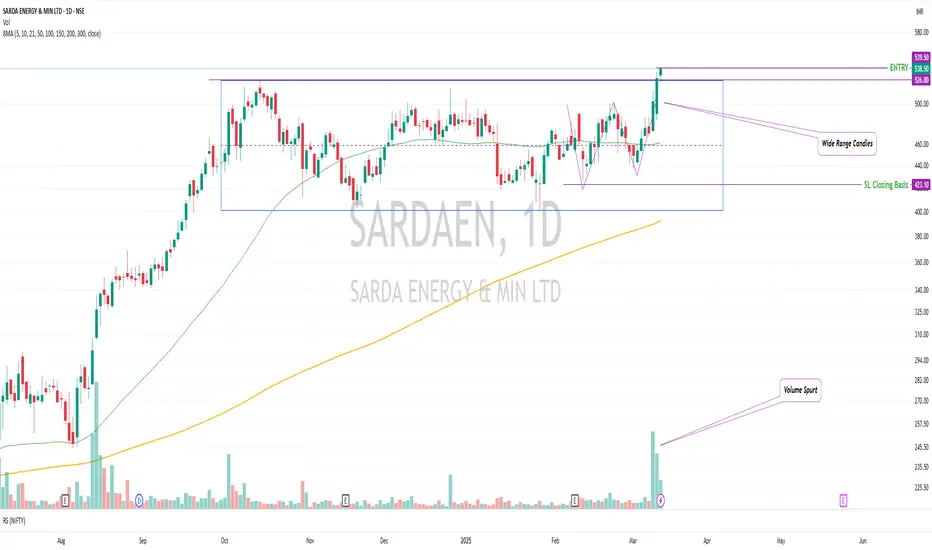
SARDAEN - Breakout WatchlistWhy This Stock?
โ
Base Breakout โ Breaking above โน526.2 with strong volume confirmation (4-5x past trading sessions).
โ
Trading Above Key DMAs โ Strong price structure with good RSI.
โ
No Left-Side Resistance โ Clean chart structure with potential for an uptrend.
โ
Formation of W Pattern + VCP โ Classic bullish continuation setup.
โ
Resisted Market Fall โ Showcasing relative strength despite overall weakness.
Safe traders wait for a weekly close above the break-out level โน526.2.
Key Levels
BDL โ Weekly W-Pattern + Sector Strength + Volume Surge ๐ BDL โ Weekly W-Pattern + Sector Strength + Volume Surge = High-Potential Positional Setup
BDL is showing textbook technical confluence at the right time:
Sector: Defence index at all-time highs
Stock: BDL forming a clear double bottom (W-pattern) over several months
Weekly breakout underway with strong green candle and volume confirmation
Structure: Rounded base, higher lows, long support holding strong
Price just broke key levels with momentum โ setup for multi-leg positional rally
๐ง T
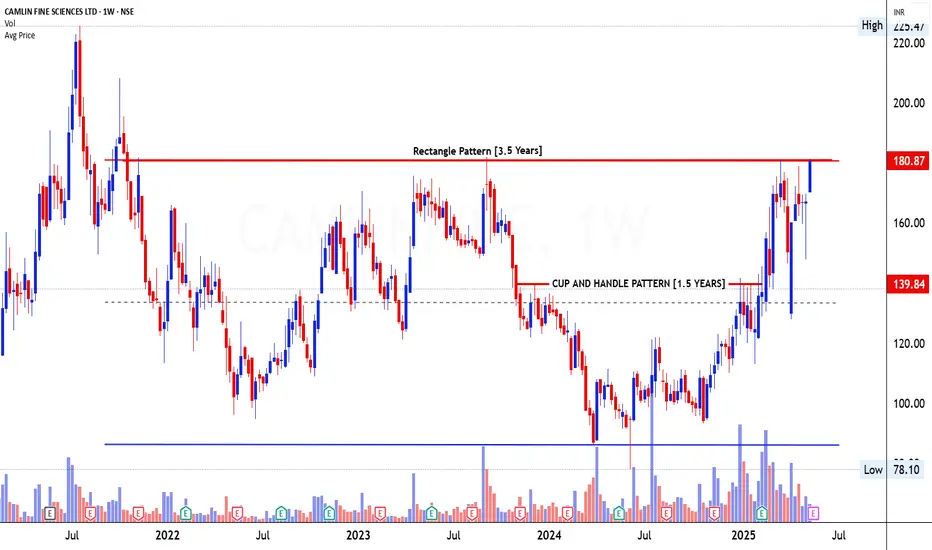
CAMLINEFINE- Rectangle Pattern๐ Breakout Stock Alert: Camlin Fine Sciences Ltd (CAMLINFINE)
๐ Price: โน179.00โโ๐ Volume: 2.91Mโโ๐
Date: 13-05-2025
โ Pattern Name, Timeframe, Structure & Explanation
Rectangle Pattern (3.5 Years) on Weekly Chart
The stock of Camlin Fine Sciences Ltd has been coiling inside a broad Rectangle Pattern for over 3.5 years, bounded by a solid support near โน78 and resistance near โน181. This long consolidation phase indicates prolonged accumulation, marked by multiple failed attempts to cross the
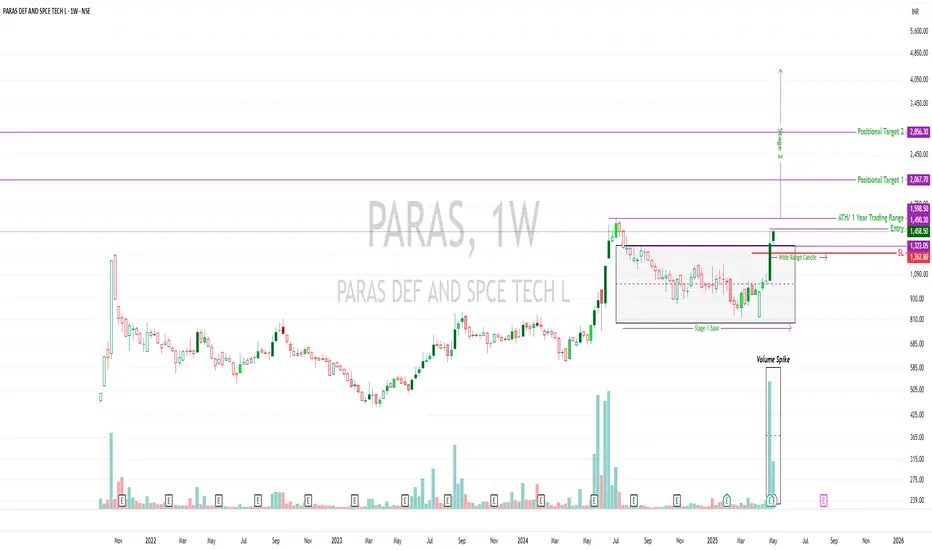
PARAS | Stage 2 Setup in Motion | ATH Watch๐ PARAS | Stage 2 Setup in Motion | ATH Watch
Paras Defence & Space Tech Ltd | Weekly Chart
๐ Technical Overview:
Stock has broken out of a Stage 1 base spanning nearly a year ๐ฆ
Printed a wide-range breakout candle with a massive volume spike โ signs of institutional accumulation
Currently trading above all key DMAs, including the 50D, 200D, and 30W averages
Cleared the โน1,490โโน1,598 zone (1-year range high), but...
โ ๏ธ ATH Not Yet Broken
โน1,598.5 remains the all-time high (ATH)
A clea