APL APOLLO TUBES LTD - Consilidation- Cup and HandleAPL APOLLO TUBES LTD - Daily Chart
Pattern: The chart shows a period of Price Consolidation from June 2024 within a broad range, roughly between 1,300 and 1,640. Within this larger consolidation, a "Cup and Handle" pattern has formed more recently.
Cup: Formed from approximately mid-February 2025 to mid-April 2025, with the low around 1,272.70.
Handle: A smaller consolidation (handle) formed in late April/early May 2025.
Neckline/Breakout Level: The price is attempting to break out above the
Rectangle
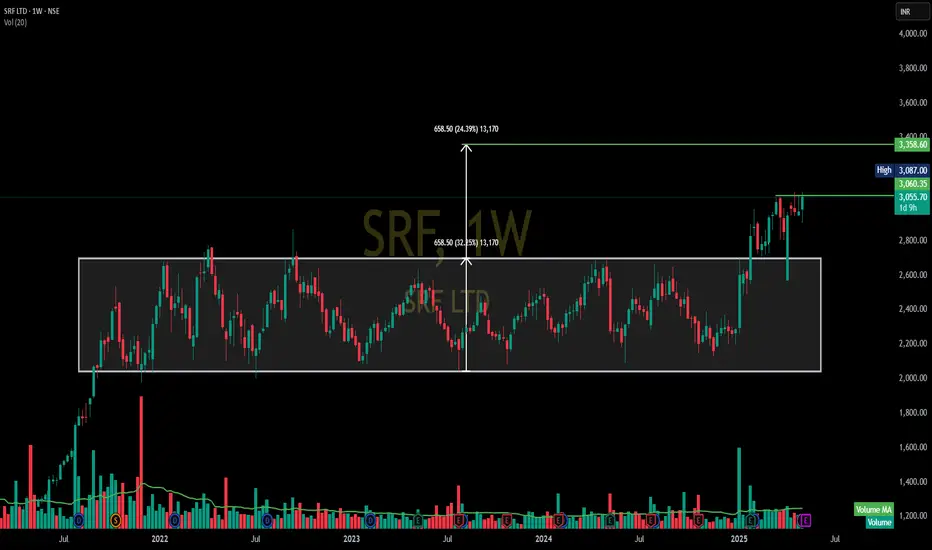
SRF LTD - Weekly
Pattern: The chart shows a very long period of Box Consolidation or a Rectangular Range. The price has been trading within a broad range roughly between 2,060 and 2,700 from late 2021/early 2022 until early 2025.
Breakout: In early 2025, the stock has decisively broken out above the upper boundary of this multi-year consolidation range (around 2,700).
Volume: There's a significant increase in volume accompanying the breakout, which is a strong bullish confirmation.
Target: The height of the
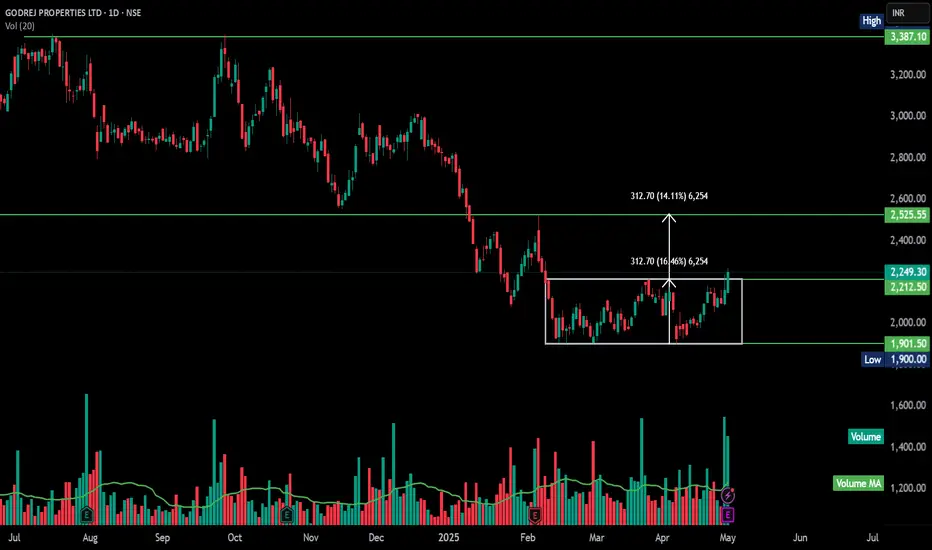
GODREJPROP - Rectangle -BO -DailyGodrej Properties Ltd (GODREJPROP) has recently released its Q4 FY25 results, revealing a mixed performance.
📊 Financial Highlights (Q4 FY25)
Net Profit: Declined by 19% year-on-year to ₹382 crore, compared to ₹471 crore in Q4 FY24.
Revenue: Increased by 49% year-on-year to ₹2,122 crore.
EBITDA: Slightly decreased by 2% to ₹634 crore.
Expenses: Overall expenses rose by 54%, primarily due to increased material consumption costs.
Bookings: Achieved record-high quarterly bookings of ₹10,1
ICICI Bank-Aiming for Double Bottom Breakout?ICICI Bank – Technical Analysis & Trade Plan
📈 Trend Analysis:
Stock is in a strong uptrend with a higher high, higher low (HH-HL) structure intact.
Consolidating since September 2024, forming a base.
Double bottom formation visible, with a potential VCP (Volatility Contraction Pattern) at play.
Trading above key DMAs, confirming strength.
Sectoral strength: Finance & banking showing momentum and could lead the next market move.
📊 Market Context:
Broader market is showing slight improvem
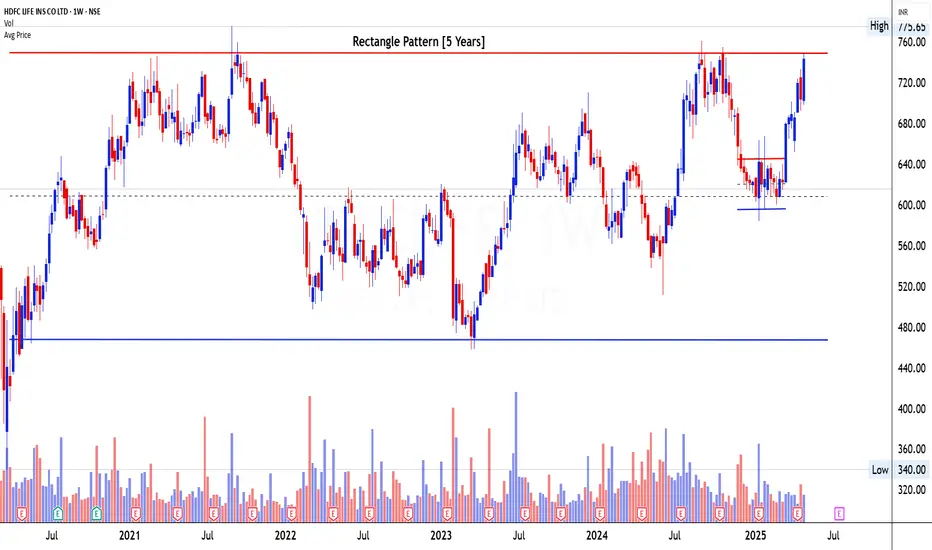
HDFC LIFE INS CO LTD – Rectangle Pattern at All TIme High
1. Pattern Analysis
The chart exhibits a Rectangle Pattern that has been developing over the last 5 years, making it a valid and high-conviction structure. The price has moved within a well-defined horizontal range, with resistance at around ₹775 and support near ₹475. This long consolidation zone indicates a prolonged phase of accumulation, where buyers and sellers have been in equilibrium. The price is currently hovering just below the upper boundary of the rectangle, and a breakout from thi
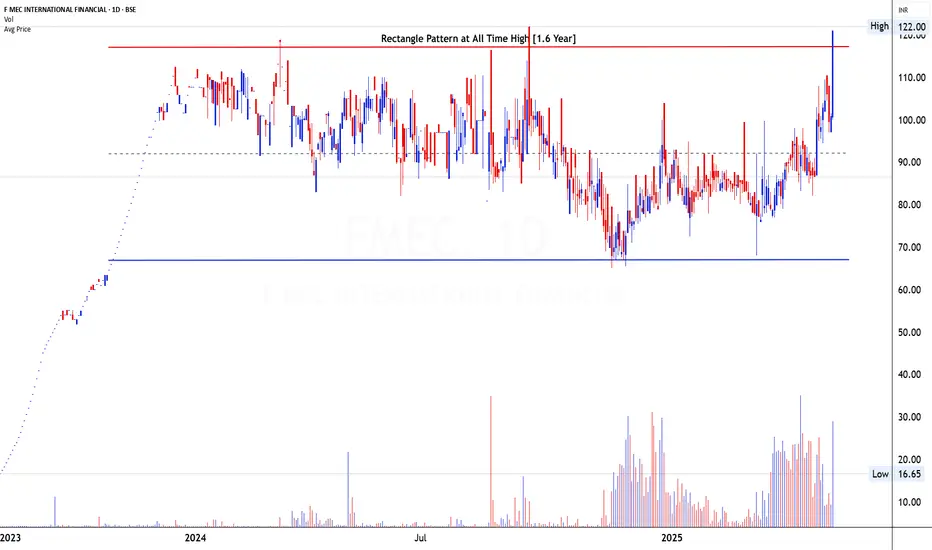
F MEC INTERNATIONAL FINANCIAL LTD – Penny Stock- Rectangle Patte1. Pattern Analysis
The stock has formed a textbook Rectangle Pattern at All-Time High spanning approximately 1.6 years. This long-term rectangle represents a classic consolidation phase after a sharp price expansion seen earlier in 2023. The price oscillated between a strong resistance near ₹120 (marked in red) and support near ₹70 (marked in blue), establishing a broad sideways base. The current breakout from this consolidation zone, especially at all-time highs, signals a powerful continuatio
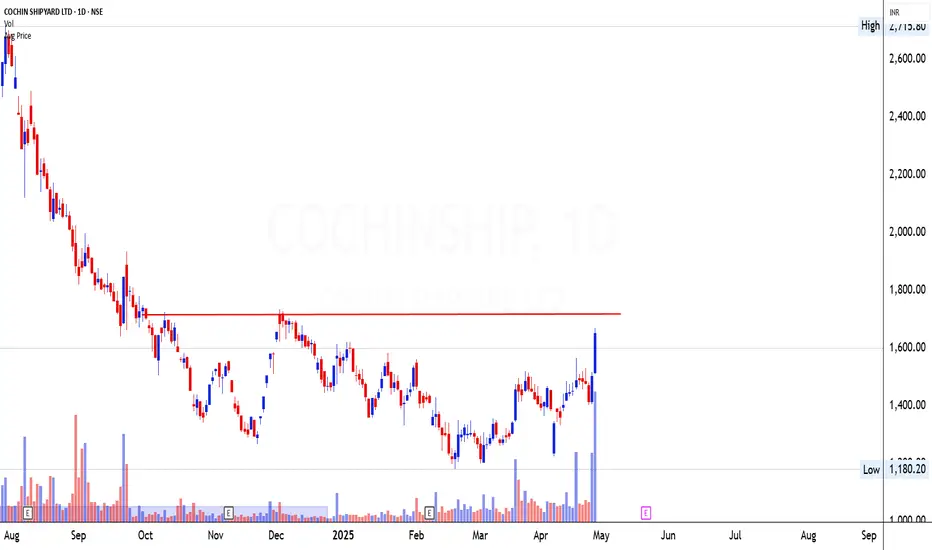
Cochin Shipyard Ltd bullish breakout -COCHINSHIP The chart of **Cochin Shipyard Ltd** shows a **bullish breakout from a consolidation zone**, with the following technical insights:
### 🔍 Key Observations:
1. **Rectangle Consolidation Breakout**:
- Price was trading in a sideways range between **₹1,180 – ₹1,520**.
- A strong breakout occurred above ₹1,520 with a close at **₹1,652.40** (▲+10.01%).
2. **Volume Confirmation**:
- Breakout is backed by **very high volume**, clearly indicated on the chart – a strong bullish sign.
3. **Ta
Cochin Shipyard Ltd - Rectangle Pattern at Support1. Pattern Analysis
Cochin Shipyard is currently exhibiting signs of a strong structural setup on the daily timeframe. A broad Rectangle Formation is visible, where price has been oscillating between two key horizontal levels for the past 7 to 8 months. The lower base has consistently provided support near ₹1,200–₹1,250 levels, while the upper boundary near ₹1,700 has acted as a resistance cap for multiple attempts.
The most critical observation is that price had approached the upper resistance
GODREJAGRO – Base Breakout Attempt | Sector Tailwind📈 GODREJ AGROVET (GODREJAGRO) – Base Breakout Attempt | Sector Tailwind
🔍 Technical Overview:
Attempting a breakout from a broad base structure.
Entry: Above ₹814 only if accompanied by strong volume.
Current volume is picking up, but a decisive spike is still awaited for confirmation.
A VCP (Volatility Contraction Pattern) was forming earlier, but recent market volatility disturbed the structure — hence, wait for a clean breakout.
📊 Price Levels:
📍 Entry Trigger: ₹814+
📍 Stop Loss: ₹734
ERIS Life Science - Rectangle Pattern near All Time High1. Pattern Analysis
ERIS Lifesciences is currently presenting a compelling bullish structure through the formation of a Rectangle Pattern that has evolved over a 10-month period. This horizontal consolidation structure is formed by consistent reactions from the upper resistance zone around ₹1,510 and lower support near ₹1,130. These two parallel horizontal levels have served as critical price barriers over the past several months, indicating a phase of accumulation and range-bound action.
The
MAXHEALTH Price Chart Analysis**Current Price and Recent Performance**
- As of the latest available data, Max Healthcare Institute Ltd (MAXHEALTH) is trading around ₹1,084.40, showing a 0.64% increase in the past 24 hours
- The stock hit a high of ₹1,095.00 and a low of ₹1,066.50 in the most recent trading session, with an average traded price of ₹1,075.13
- Over the past week, the stock is down by 0.97%, but it has risen 8.23% over the past month and 30.78% over the last year
**Historical Price Levels**
- MAXHEALTH reac
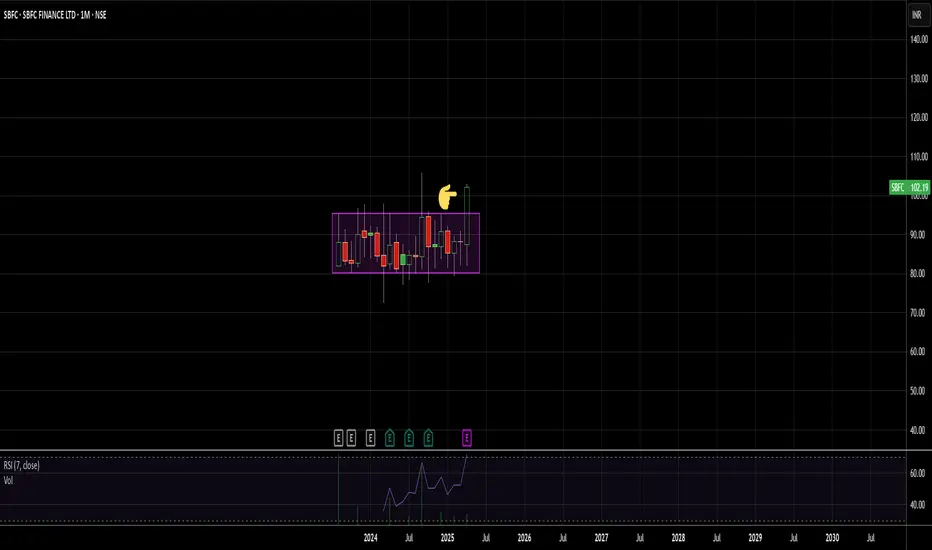
SBFC Finance Ltd – Breakout Watch (Positional Setup)🟩 SBFC Finance Ltd – Breakout Watch (Positional Setup)
📈 Price: ₹102.42 | 🏛 Market Cap: ₹10,970 Cr
🔍 Sector: NBFC | 📆 Timeframe: Daily
🧱 Structure Overview
Consolidating in a tight range since listing (Aug 2023), forming a solid base box between ₹77–₹106.
Approaching All-Time High zone (₹106.5) again.
Stock is trading above all key DMAs, showing strength relative to broader market.
📌 Entry Criteria (Breakout Plan)
🟢 Buy only on breakout above ₹106.50, if and only if:
✅ Volume spike — mi
Bajaj Finserv Cup & Handle at Play! Will It Break Out?📌 Setup Overview:
Stock in a 4-year trading range 📊 and currently trading just below this range.
Cup and Handle formation ☕ along with a potential VCP setup (Volatility Contraction Pattern).
No left-side resistance—unlike stocks that fell 40-50%, there are fewer trapped buyers here.
Volume gradually increasing 📈, a necessary condition for a strong breakout.
Finance sector showing strength 💰—index is trading above key DMAs and broke out of a base first.
Stock is trading above key DMAs, adding t
ADANI PORTS & SEZ LTD – Rectangle PatternADANI PORTS & SEZ LTD – Technical Chart Analysis
(As of April 16, 2025)
1. Pattern Structure and Breakout Observation
Adani Ports has formed a Rectangle Pattern over the last 4 months, consolidating between the ₹1200 resistance zone and the ₹1050 support zone. This pattern reflects a period of indecision and accumulation, typically resolved by a directional breakout.
- The stock has successfully broken out above the key horizontal resistance near ₹1200 on increased volume.
- This breakout
NACL Industries - Range Breakout Trade Setup🔥 NACL Industries - Range Breakout Trade Setup 🚀
📍 Breakout Level: ₹116
📍 Current Market Price (CMP): ₹121
📍 Stop Loss (SL): ₹96.5 (📉 Closing basis)
📍 Target 1 (T1): ₹166 🎯
📍 Target 2 (T2) (Positional): ₹255 🎯🎯
🔍 Why This Trade?
✅ Range Breakout 📈: Stock has broken out of a 3-year-old consolidation range!
✅ Big Money Inflow 💰: Breakout supported by high volume, indicating institutional buying.
✅ Bullish Pattern 📊: Formation of 3 White Soldiers on March 25 in DTF– a strong bullish signal! 🚀
✅
ANUP - Smart Money Inflow NSE:ANUP
ANUP Day Chart
logic - Earlier it was in a correction mode with major market but comparatively it has fallen very less to the major indexes and also maintained its major uptrend so we can say that it have not attracted heavy sellers during fall.
Then it went into a consolidation and formed a horizontal resistance zone.
Recently it have broken out with good volume and also formed a retest of 5EMA
on low volume showing low selling.
Now What?
To qualify this Setup We need a few more d
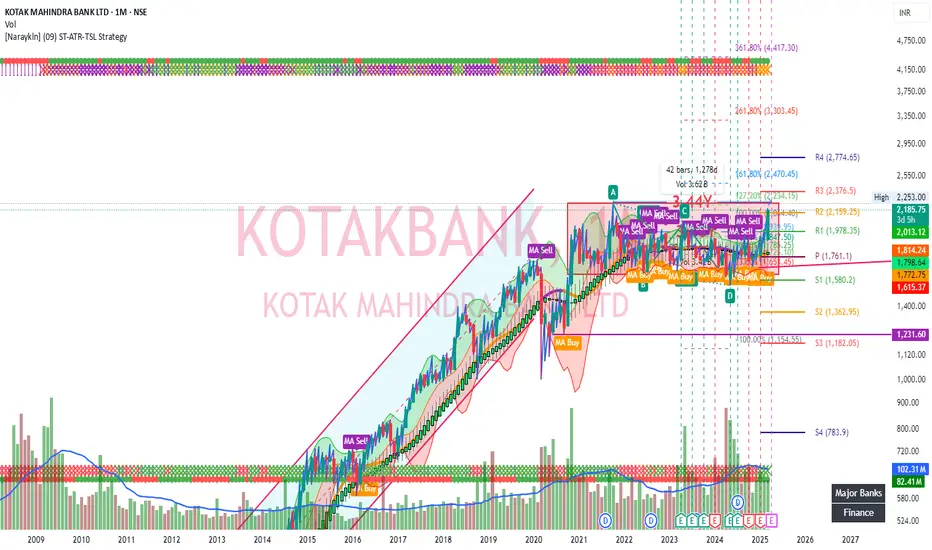
Kotak bank consolidation breakoutKotak bank breaking out from consolidation rectangle pattern of about 3.18Y. Rectangle is a continuous pattern and likely to continue the uptrend. Soon ATH breakout and would reach 161.8% fib level after pivot target of 2376.5. RSI also had a clear breakout in weekly timeframe. Also higher timeframe looks good.