BTC: AT DESICIVE POINT!!Hello everyone, if you like the idea, do not forget to support it with a like and follow.
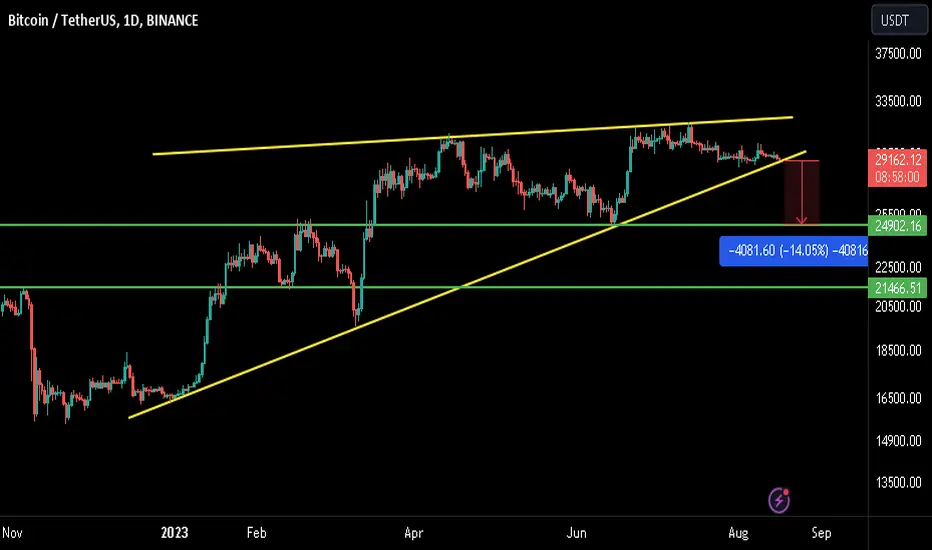
Welcome to this quick BTC update. BTC is still at the same range of FWB:29K level.
It is forming a rising wedge-like structure in the daily time frame and currently, at the lower trendline of the wedge. If it breaks down from here then expect a big dump in the next month.
If it holds the lower trendline and bounce then we might see another small pump up to FWB:31K -$32k but this scenario is less lik
Rising Wedge
EUR-JPY Bearish Wedge Pattern! Sell!
Hello,Traders!
EUR-JPY is trading in an
Uptrend but the pair has
Formed a bearish wedge
Pattern and is trying to make
A bearish breakout so I think
That If the breakout is confirmed
Then we can expect a local
Bearish move down
Sell!
Like, comment and subscribe to help us grow!
Check out other forecasts below too!
XRP - Time to buy for a 500% profit! (now)
XRP is currently retesting a major trendline from 2022, and this retest is exactly where you want to buy this coin! This trendline is also part of an ascending parallel channel on the daily chart, which strengthens the support.
What's more, we have had a strong 0.618 FIB retracement on the LOG scale. We hit this level almost to the dollar, so if you bought at this level, congratulations! I share my trades transparently and post trade setups privately.
We also need to take a look at the volum
HDFC BANK pattern breakdown?A rising wedge type of pattern can be observed in the weekly chart of HDFC Bank. Price has failed to breakout above the 1750 level 4 times in the past 2 years. Price seems to have broken down on the weekly chart from the pattern.
Supports at 1580, 1530.
Good medium to long term buying opportunity if it reaches around 1410 which is the 200 EMA on the weekly.
💱USDJPY - Bounce from the level before resistance breakout USDJPY is testing the resistance of the ascending channel and the resistance of the 144.897 range. On the local timeframe, the price is preparing for a breakout and further growth
TA on the high timeframe:
1) A retest after a month, and a quick approach to the level may give a bounce down, for example to 143.7
2) Price has stopped and is forming a decrease in volatility, most likely the consolidation phase begins, another retest of resistance may follow.
TA on the low timeframe:
1) Price is s
XAUUSD - Waiting for a Breakout 📈📉Hello Traders!
On The Daily Time Frame, The EURUSD Reached a Srong Support Level and formed a Falling wedge Pattern!
so, we have 2 scenarios!
Scenario 1
if the Resistance Line will broke, i will buy in retest 📈
TARGET: 1972.000🎯
Scenario 2
the support level will be broken .
then, we will see a huge bearish move📉
TARGET: 1911.200🎯
___________
if you agreed with this IDEA, please leave a LIKE, SUBSCRIBE or COMMENT!
EURUSD - Huge uptrend is ready! (prepare longs)
EURUSD is still extremely bullish because the price is above the 200-day daily moving average and also above the major white trendline. Trend is your friend, so we want to take only longs!
The price is also inside this ascending parallel channel, and I expect another push to the upside to test the upward trendline of the channel. It's possible to bull-break this channel!
In the last 2 weeks, EURUSD has been going down, but it's just a re-test of the previous 2 trendlines. We needed this pull
Bitcoin prediction 2028 (Fibonacci channel, must know)!
This is my projection for the next 5 years. Bitcoin always rapidly grows after the halving event. But around 16 months after the halving event, Bitcoin started to crash significantly.
On the chart, we can see a very important Fibonacci channel on the LOG scale. The 0.618 FIB is always a strong level, and bitcoin hit it almost to the dollar in 2022. Take a look at it! We deeply need to keep this Fibonacci channel in mind. The strongest FIB levels are 0.618 and 0.382. 0.618 + 0.382 = 1. Bitcoin
Bitcoin - Bart pattern + Comment your altcoin!Make a comment with your altcoin below this idea, and I will give you my opinion/analysis of it in reply! Make sure you hit the boost button as well to participate. I will answer your comment with an analysis for you on the weekly/daily chart (long term). I start my analysis with Bitcoin:
The bart pattern is a new type of chart pattern that occurs specifically on Bitcoin but sometimes also on other coins. It's something like pump and dump, but at the top of the pattern we have a sideways pr
ETHUSD → Correction, after which growth to 2000 may be formedBITSTAMP:ETHUSD continues to form a bullish price channel, as evidenced by the MA-200, which accompanies the trend support. The price is forming a correction and breaking the support of 1846, thus marking the next target before further growth
Ethereum is forming a global flat 2021 - 1700. Support 1728 plays an important role for us and there is a high probability that the price may test it in the near future. But we are primarily interested in the support of the ascending channel.
The crypt
Rising Wedge | $380Chart 4H Timeframes
Nvidia NASDAQ:NVDA is in Rising Wedge and reached to the resistance of Fibo Projection around $480
So I expect NVDA will reverse soon after it break down the lower line of Rising Wedge
NVDA has two support at 420 and lower at 370. It's over 10%, can consider use DCA strategy to join AI's race
Wait for next move
Bitcoin - Huge alt-season is starting! (buy altcoins)
Bitcoin dominance is going down, and in confluence with this sideways price action, I expect a huge alt-season! It's a great time to buy some altcoins.
We can clearly see that the price of Bitcoin is stuck in this rising wedge pattern. Because of it, generally, there is a higher probability of the price going down, but we still have plenty of time, and the price can stay inside for another 30 or 50 days.
We need to wait for the rising wedge pattern to show us the direction. The trendline of
BTCUSD → Price is forming a consolidation. Retest of 0.382 fiboBITSTAMP:BTCUSD is in the correction phase. The market is forming a decline in volatility to the lows of the last few months. Globally we still have an ascending price channel and a bullish trend.
The price is declining to the limits of 0.382 fibo. Consolidation is formed above this line, in this case if the price continues to consolidate near 0.382 in the absence of a bounce, a breakout may follow and the price may decline to 28474 for a retest.
A positive sign for us will be a rebound fr
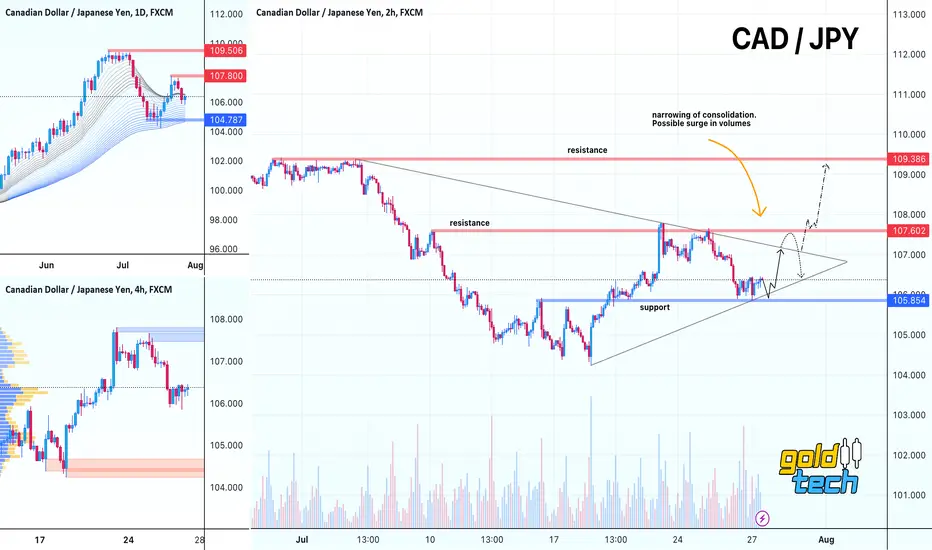
💱CADJPY - We expect resistance retest CADJPY is forming a narrowing range. The outline of a triangle is being formed. The global trend is bullish and prioritizing price may break resistance
TA on the high timeframe:
1) 109-104 range is forming. False break of 104 sends price to 109
2) The liquidity area that the market is interested in is above 107.8, most likely price can reach this area
TA on the low timeframe:
1) Downside resistance and upside support is forming a narrowing consolidation that is beginning to form a symmetrical
ZENUSDT → Exiting a bearish trend. Growth potential by 15.00BINANCE:ZENUSDT is forming a prolonged bearish wedge. Numerous resistance retests are inconclusive except for the last one. Against the backdrop of falling bitcoin, ZEN is showing strength.
The price after testing the bearish trend support consolidates and stops under the resistance at 9.66, forming an ascending triangle. Over the course of several weeks, price consolidates and continues to push up against resistance.
At the moment of volume surge, the price moves from the accumulation pha
Bitcoin - Bearish 21k target confirmed! (Bart pattern)
The Bart pattern is now confirmed, and it doesn't look good at all for the price of Bitcoin! We need to react to the recent price action, and this pattern is breaking down. I would not be surprised if we woke up in the morning and saw a big red dildo!
You can say that Bitcoin is still inside the major parallel channel and that we are still bullish, but I can tell you that the trendline has already touched three times, and only a small bounce is expected on the fourth touch. This channel is st
🥇GOLD - Wedge breakout and resistance retest Gold is breaking support of the rising wedge and is getting sell signals. On D1, price bounces off range resistance and likely gets downside potential
TA on the high timeframe:
1) False breakout of 0.5 fibo gives a sell signal. The price continues to fall
2) During the European session, the price tries to buy back some of the decline, but the resistance area may stop the price
TA on the low timeframe:
1) Wedge support breakout. A correction is formed
2) The correction reaches 0.236 fibo and t
BTCUSD → Expected correction within consolidation BITSTAMP:BTCUSD forms a false breakdown of the key resistance after which the format of the movement passes into the correction phase. The price is consolidating between 0.236 and 0.382 fibo
Paying attention to the chart we see the continuation of the ascending price channel formation. The price indicates a rather high interest on the part of buyers, as the price after long consolidations continues to strengthen and does not give deep corrections.
A correction is forming within the new move
ETHUSD → Global ascending triangle. Retest 2020BINANCE:ETHUSDT is forming an interesting situation. For more than a year the price has been trading under the strong resistance of 2020. After a while we begin to realize that this level is the upper boundary of the ascending triangle.
This pattern can be interpreted as consolidation of potential by dynamic buyers with the purpose of possible overcoming the resistance and reaching new tops.
A symmetrical triangle has been forming for several months as well.
The price is in consolidation
Bitcoin - Pump to 39k! But then, crash to 21k (juicy)
We have had a lot of bullish news in recent days, and that's why Bitcoin is going to reach up to 39k this summer, but do not be too excited because I am expecting a huge crash to 21k later this year!
39K is an extremely strong resistance for the bulls, mainly because of the 0.618 FIB retracement and point of control of the previous market structure. Also during the downtrend in 2022, the price created an unfilled fair value gap, which acts as resistance as well. We can fill this gap and start
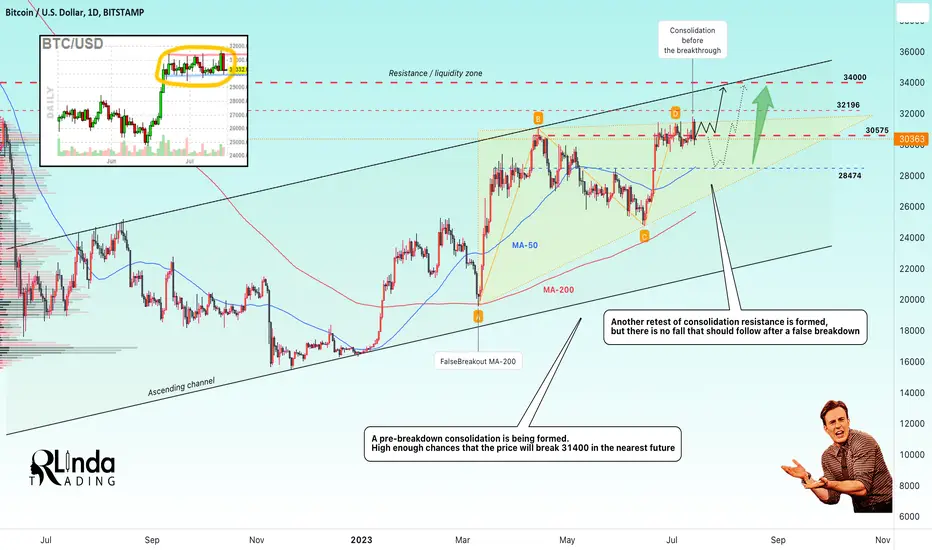
BTCUSD → Pre-break consolidation and flat at resistance BITSTAMP:BTCUSD continues to forge an uptrend and also gives us preconditions that the growth will continue. The price is forming consolidation before the breakout and is confidently forming another bullish wave
On the chart we see an ascending triangle, the key resistance area that holds the price is the area of 31500. The price continues to ford retests against resistance and forms a pre-breakout consolidation.
Within the flat 31500 - 29700, a retest of 0.382 fibo and a false breakdown ma
AUDUSD - BULLISH FALLING WEDGE📈Hello Traders👋🏻
On The Daily Time Frame The AUDUSD Formed a Falling Wedge Pattern📉
Currently, The Price Broke The Resistance Line of The Wedge
So, I Expect a Bullish Move📈
-----------
TARGET: 0.69545🎯
___________
if you agreed with this IDEA, please leave a LIKE, SUBSCRIBE or COMMENT!
🥇GOLD - False break of channel resistance Gold is breaking through global channel resistance, but is also bumping into a strong horizontal level.
TA on the high timeframe:
1) The trend is still bearish, price is under strong resistance
2) Price is discovering a new range. But if price consolidates below 1930, a bearish potential will form
TA on the low timeframe:
1) A bullish wedge is forming. A breakout of the figure's boundaries will form a strong impulse
2) The price inside the ascending price channel makes a false breakdown of