Approach towards AUDUSD Short.Hello Traders!
1. We see an Elliotical rising wedge completed.
2. A clear impulse down . We can expect at least one more impulsive wave even if it happens to be a zigzag correction and not an impulse down.
3. A retracement of 61.8%.
4. The invalidation level and target levels have been marked on the chart .
5. This is not a very long term trade . Though, it is not expected for AUDUSD market to touch the invalidation level even after our trade is complete, we will still not go short
Rising Wedge
Elliotical Approach to US30 Short.Hello Traders!
1. The US30 market is on the verge of completing its 2nd wave of Wave C of the complex correction as originally published in a prior idea (link attached).
2. We see an ending diagonal forming in the 1hr tf at the moment.
3. Also, wave 4 often divides an impulse into harmonic ratios. There can be that possibility with the division of 61.8% and 38.2% (total 100%). We take this possibility into picture because we also have the retracement level of 78.6% of wave 1 at almost
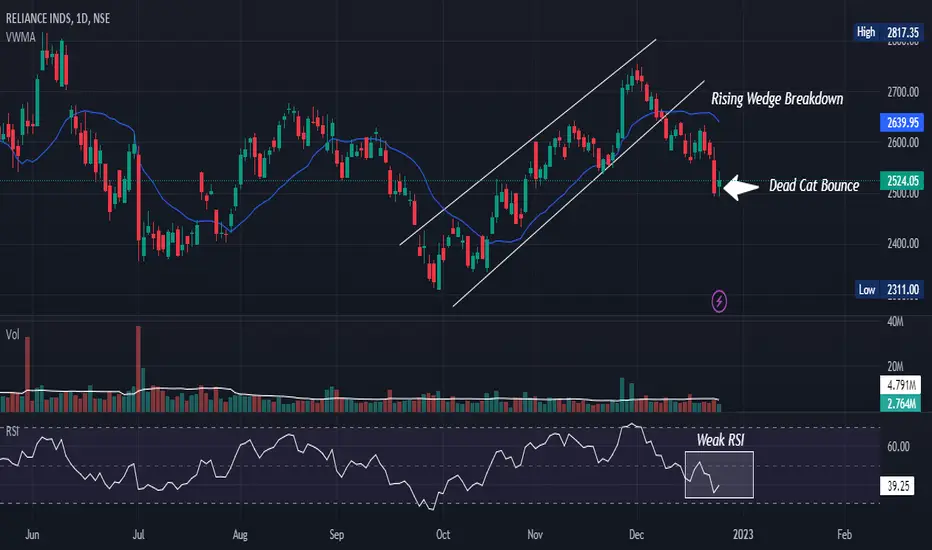
Relience Short term Swing trade with rising wedge pattern...here is the chart which is explaining us the pattern named rising wedge and it already had given us a good breakout with some good volume and also retested it's trendline in lower time frames.so here we can go short if it gives us a move towards downside......
Asian Paints: Is it Losing it's shine?
Diwali season is considered one of the best season to get your house painted. With festive season gone behind us, is Asian Paints losing it's shine ?
Let us look at what chart has to tell us...
We are looking at daily charts of Asian Paints
The stock is seeing a lot of selling since it made a high of 3582 on September 28
- the stock is trading below it's 21 day, 50 day and 252 day EMA
These are not the signs that a strong bullish stock will show...
Going forward 3112 -3260 may potentiall
BATAINDIA Rising Wedge Pattern BreakdownIn today's session, BATAINDIA gives breakdown of Rising Wedge pattern at 1795 level. After this breakdown expected downside target 1775 to 1730+ level in next few trading session according to chart pattern. Can short BATAINDIA below 1795 with stop loss of 1820 for this target.
DJI Seems Weak! S1-30520 & S2-29589 may act as supports.DJI's significant "Strong Weekly Closing" confirmed breakdown. Besides this, extreme volatility spurt in VIX too signaling the weakness. Although i am a learner. But this is somewhat remarkable. So sharing this view!
Thanks
DShort
SHORT AU BANK for target of probable 400Couple of things seen on Charts. Rising Wedge pattern on weekly and monthly charts. Also a failed breakout on daily charts.
Bearish divergence seen on weekly charts. Indicating sell at higher level. Be careful with this stock. Also same is seen with other Ultratech.
Shorting is risky option so wait for a solid confirmation to enter the stock is not resistant to interest rates hikes.
If rising wedge is followed then target of 400 can be seen. trade with strict Stop loss on weekly closing bas
P
HSCL { rising wedge pattern }
rising wedge pattern downtrend continuous pattern
waiting for confirmation candle
If You LIKE MY Idea ……like its
“Disclosure : I am not Sebi-registered.” This channel is for only educational purpose. Any profit/loss, I am not responsible. Before taking any trade on our calls please consult your financial advisors. Thanks
HCL tech multi timeframe analysis for swing trading in hindiHCL tech multi timeframe analysis for swing trading in hindi
in this video i have shown, 15 minutes & daily chart analysis of HCL tech.
and trade setup for next day 08/08/2022.
you will get idea of where to short sell & where to put stop loss.
i have shown practical use of reversal pattern such as triple top, H&S, double top & rising wages pattern.
i have also discussed about trendline, RSI diveregence & wyckoff method in real life example.
basically i have shown, how to use technical analys