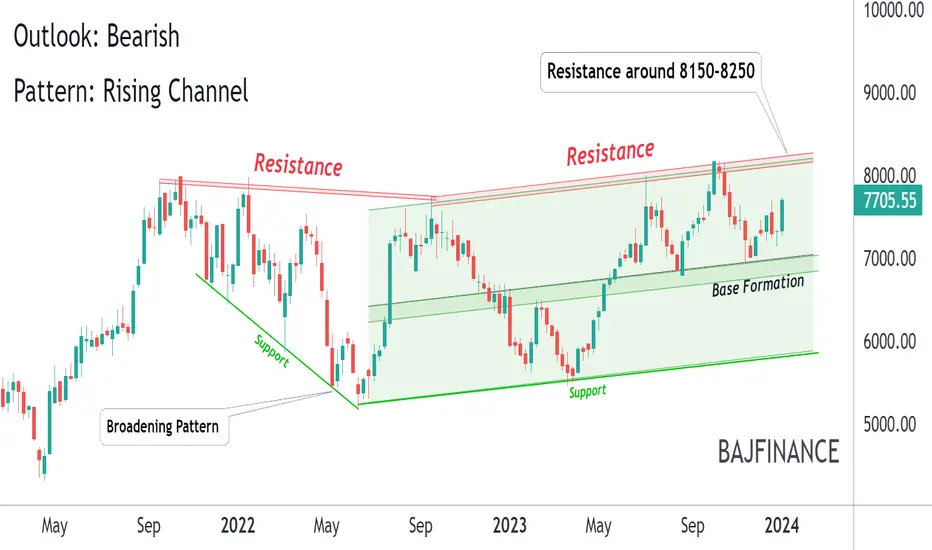
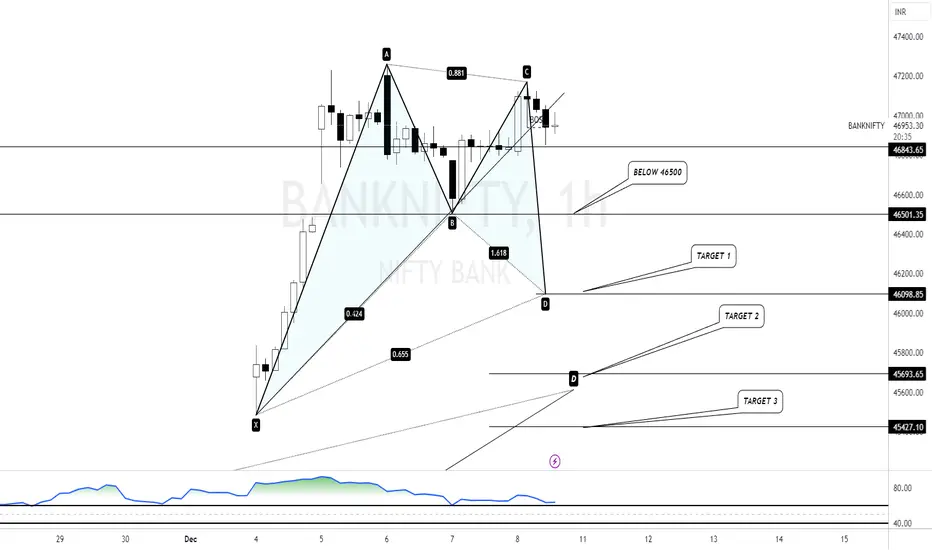
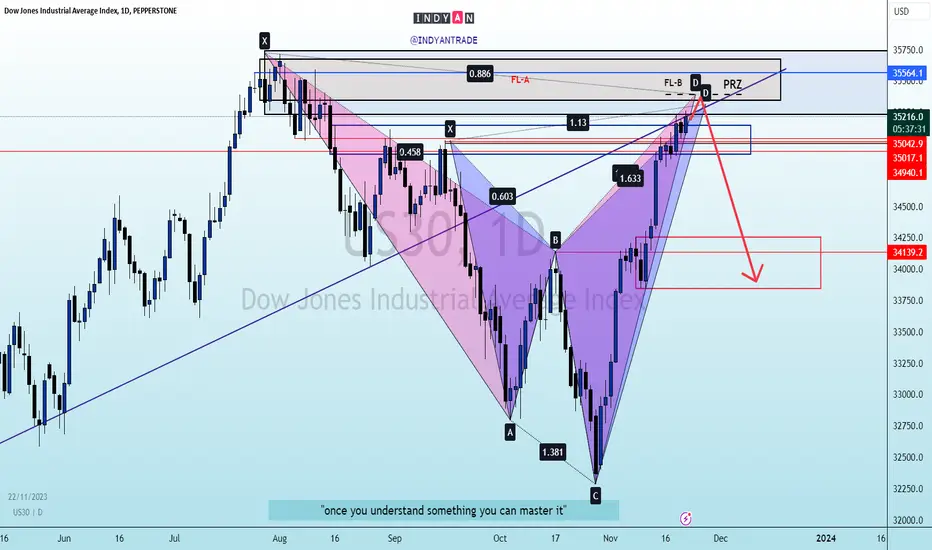
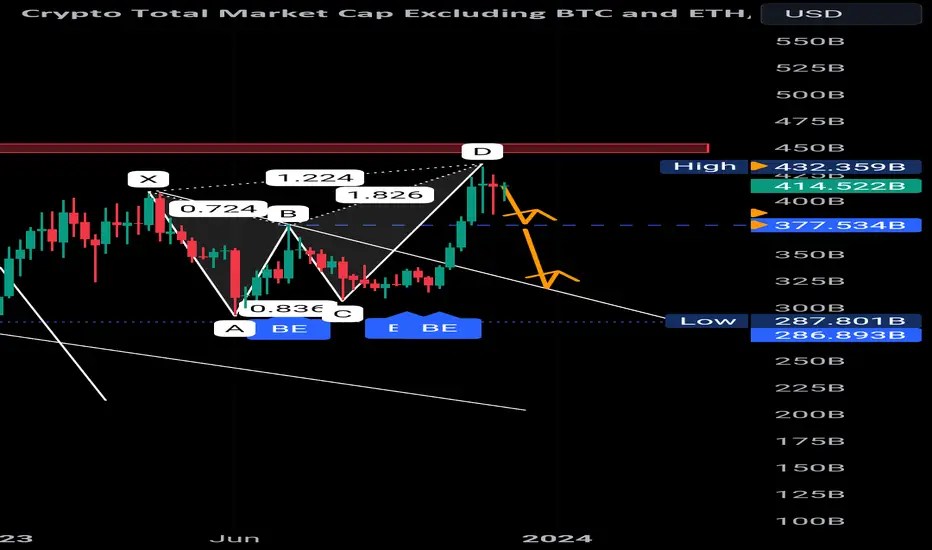
Bajaj Finance : Free fall on the way ?? Alert! Bearish Pattern Spotted! 🐻
📊 Pattern: Rising Channel
📌 Symbol/Asset: BAJFINANCE
🔍 Description: Stock has made Broadening pattern and then not able to cross the resistance.
Now stock is making Rising channel and its near to the resistance.
If resistance is not broken then
We can see fall from 8250-8350 levels.
👉 Disclosure: We are not SEBI registered analysts, this is not a buy or sell recommendation.
Shark
Take DIVGIITTS for 30% upsideStock with medium financial performance and average valuation, but technical indicator shows weak price momentum but still sector is bullish so this is very good price to entry .
take entry at cmp 966
Target 1266
Next average at 800 and 596 ( at this level you have to invest same amount again)
BGRENERGY Falling Trendline BreakoutIn this analysis, we will delve into the technical aspects of BGRENERGY's weekly chart. We'll explore significant patterns and indicators that suggest potential trading opportunities.
1. Breakout of Weekly Falling Trendline:
The most prominent feature on the chart is the breakout of a weekly falling trendline. Such breakouts often indicate a shift from bearish to bullish sentiment. This is a significant technical development, as it suggests a potential reversal or continuation of the trend.
Bullish Harmonics In Nifty Be CarefullBullish Harmonics
1. Bullish Cypher - PRZ - 18951
2. Bullish Shark - PRZ - 18818
SL - 18666 ( Day Closing Basis )
Bullish Cypher Target - 19450 / 19600
Bullish Shark Target - 19375 / 19550
3. Bullish Alt Shark - PRZ - 18493
SL - 18300 ( Day Closing Basis )
Target - 19174 / 19385
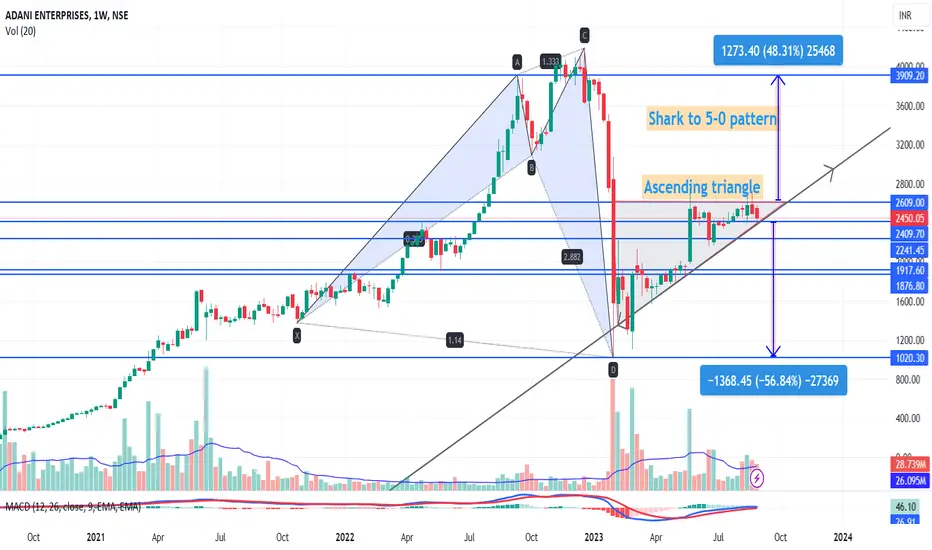
Adanient important levels are "2610" and "2410''
**Fundamental Analysis**
Company overview: Adani Enterprises is the flagship company of the Adani Group, one of the largest conglomerates in India. The company is involved in a wide range of businesses, including energy, ports, logistics, and infrastructure.
Financial performance: Adani Enterprises has been profitable in recent years, with net income of INR 12.2 billion in fiscal year 2022-23. The company's revenue has grown at a compound annual growth rate (CAGR) of 20% over the past five yea
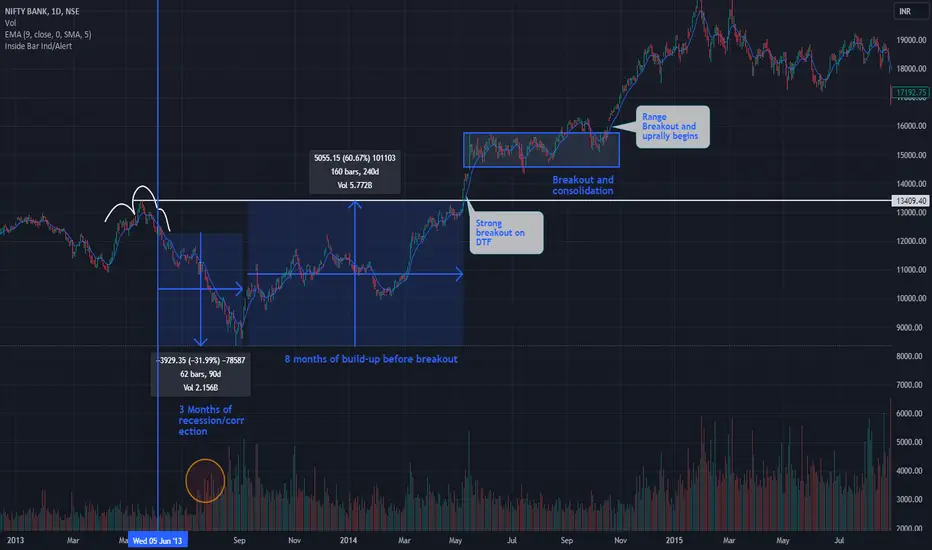
Cracking the Code: Unveiling BANKNIFTY's Present Echoing June 5,By Surendra
Greetings, astute followers of the financial landscape. Today, let's embark on a journey that delves into the captivating parallels that have unfurled within the Indian equity market. As of August 26, 2023, we stand witness to a scenario that appears to mirror a pivotal day from the annals of history – June 5, 2013. Strap in as we dissect the tale of BANKNIFTY, its interconnectedness with the broader market, and the invaluable lessons history beckons us to learn.
Deciphering the Da
Bandhan Bank is moving upThe Bandhan bank is looking good at this level and sustaining well above the resistance zone. keep on the radar.
Disclaimer - I am not a SEBI-registered technical analyst and advisor so contact your financial advisor and make a self-decision. I will not be responsible for any profit or loss.
Nifty At Extreme Shark LevelScript Name - Nifty 50
Time Frame - Weekly
.
.
Name of the Pattern - G2 Bearish Extreme Shark Harmonic Pattern (1.414 Level)
PRZ 1 - 19522.75, PRZ 2 - NA, PRZ 3 - 19411.15
.
.
Name of the Pattern - G2 Bearish Extreme Shark Harmonic Pattern (1.618 Level)
PRZ 1 - 19835.75, PRZ 2 - NA , PRZ 3 - 19754.70