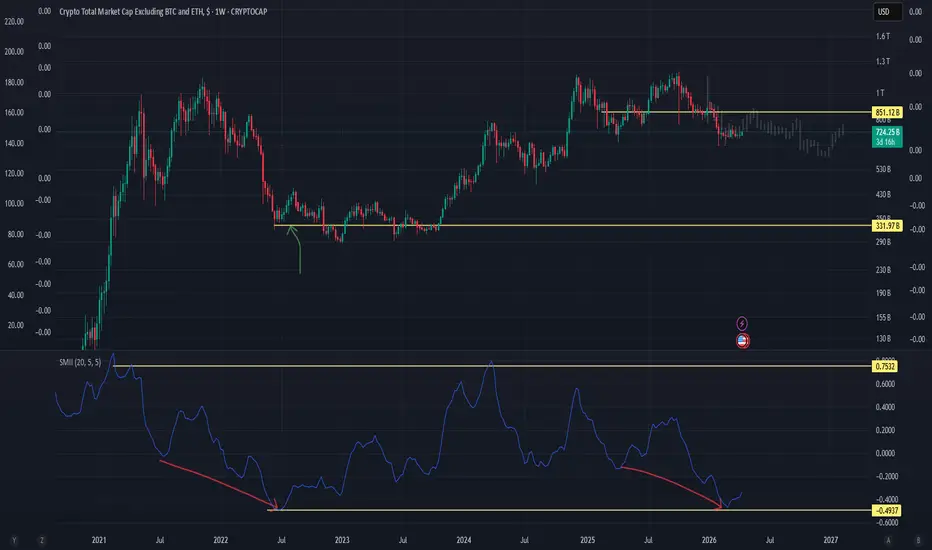
Current altcoin bear market is extremely mild compared to priorIn prior bearmarkets, TOTAL3:
- 92% decline, 26 months
- 75% decline,23 months
Current bear market, TOTAL3:
- 46% decline, 9 months
The current bear market for altcoins is very mild and roughly halfway of the % decline and duration of prior bear markets.
The 2nd bear market does include, durati
Crypto Total Market Cap Excluding BTC and ETH, $
No trades
No trades
Key data points
Previous close
—
Open
—
Day's range
–
Profile
Bitcoin and Ethereum are such major players and so popular among investors that when you enter the market, they draw all the attention to themselves leaving other coins in their shade. It's not that they do not deserve this attention, but without their colossal figures, investors could take a healthier look at the crypto market to define its overall state and direction. Following this logic, we've calculated total crypto market capitalization excluding BTC and ETH market caps and displayed how the final number changed over time on the chart. Hope it proves useful in your analysis of crypto markets.
TOTAL3 may drop up to 50%Despite TOTAL3's weakness this cycle and continuous decline, it has yet to enter oversold territory on the weekly chart. If this support breaks, TOTAL3 could decline up to 50%. This means many microcap, lowcap, midcap, and largecap altcoins may see declines far exceeding that amount.
Market Update / No ALT szn Yet𝕄𝕒𝕣𝕜𝕖𝕥 𝕊𝕥𝕣𝕦𝕔𝕥𝕦𝕣𝕖 𝔹𝕪 𝕁𝕠𝕠𝕡
—————
Market Update / No ALT szn Yet
I Only trade Bitcoin, but when I don’t understand what exactly is going on or I wanna double check my thesis, I check other charts for hints
Ex: Total3 (crypto total ex BTC & ETH) → Also used for ALT szn
The Chart looks very similar to
TOTAL3
I warned about this months ago and it played out, and now two scenarios can play out, TOTAL either reclaims 680 and it moves up (690B)
it fails then 670B can be a good support and a possible bounce can happen from there. breaks below the neckline then it might form a double bottom around 666B with
TOTAL 3 Preparing for a Major Bullish Move (1D)TOTAL 3 is a crypto market index that represents the total market capitalization of all cryptocurrencies excluding Bitcoin (BTC) and Ethereum (ETH).
It appears that TOTAL 3 is forming a bullish triangle, and we are currently in Wave D of this pattern. If the price gets rejected again from the red b
TOTAL3 Update: Relief Bounce or Another Trap?Total3 continues to be one of the cleaner ways to track the health of the altcoin market since it measures total crypto market cap excluding Bitcoin and Ethereum.
Right now the key thing I'm watching is the ~$700B area. So far we're seeing signs of support forming there, which could give alts room
TOTAL3: Confirmation of support leads to resistance, back to ATHI noticed all cycles are different. While we always expect the same, it is always different. This chart here shows three complete bullish cycles.
The first one is really steep and ends with a blow-off top. The second cycle was also really steep and ended with a long-term double-top, quite different
ALTS - 3 more weeks?ALTS - 3 more weeks?
same old bs, different day?
if so your looking at a 3 or so more weeks of 'we are so back' then another mega dump to solidify the cycle repeat.
im just not sure about this. the last bull thesis on this one over time was a complete fail, and thats when i would have expected it
Early Alt Rotation Signal – TOTAL3 + ETHBTC Alignment
TOTAL3 (total crypto market cap excluding BTC and ETH) and ETHBTC on the 4H timeframe.
Early signs (not confirmation) of rotation from BTC dominance into the broader alt market.
TOTAL3 has just printed a strong expansion move after a prolonged period of compression. The move is impulsive, but mo
See all ideas
Summarizing what the indicators are suggesting.
Oscillators
Neutral
SellBuy
Strong sellStrong buy
Strong sellSellNeutralBuyStrong buy
Oscillators
Neutral
SellBuy
Strong sellStrong buy
Strong sellSellNeutralBuyStrong buy
Summary
Neutral
SellBuy
Strong sellStrong buy
Strong sellSellNeutralBuyStrong buy
Summary
Neutral
SellBuy
Strong sellStrong buy
Strong sellSellNeutralBuyStrong buy
Summary
Neutral
SellBuy
Strong sellStrong buy
Strong sellSellNeutralBuyStrong buy
Moving Averages
Neutral
SellBuy
Strong sellStrong buy
Strong sellSellNeutralBuyStrong buy
Moving Averages
Neutral
SellBuy
Strong sellStrong buy
Strong sellSellNeutralBuyStrong buy
Displays a symbol's value movements over previous years to identify recurring trends.
Frequently asked questions
Today, crypto market cap excluding Bitcoin and Ethereum is 675.15 B USD.
Track its historical performance on crypto market cap charts.
The crypto market cap excluding Bitcoin and Ethereum represents the combined market value of all cryptocurrencies except BTC and ETH. It is calculated as:
Total crypto market cap − BTC market cap − ETH market cap.
On TradingView, we calculate total market cap using the top 125 coins. This helps us reduce noise created by tokens with potentially shorter lifespans. As a result, we have more stable data, which can help you better understand real market trends.
Total crypto market cap − BTC market cap − ETH market cap.
On TradingView, we calculate total market cap using the top 125 coins. This helps us reduce noise created by tokens with potentially shorter lifespans. As a result, we have more stable data, which can help you better understand real market trends.
A rising value may signal increasing investor interest in altcoins, a shift in market sentiment, or the early stages of an altcoin-driven market phase.
No matter the reason for this market behaviour, stay on top of market trends with the latest crypto news and watch our crypto market cap charts to be the first to catch shifts.
A decline in this market cap metric can indicate risk-off behavior, capital moving back into BTC or ETH, or weakening demand for higher-risk crypto assets — investors turn back to more reliable OGs, now you need to find out why.
No matter the reason for this market behaviour, stay on top of market trends with the latest crypto news and watch our crypto market cap charts to be the first to catch shifts.
The highest crypto market cap excluding Bitcoin and Ethereum peaked on Oct 7, 2025 at 1.19 T USD.
Track its historical performance on total crypto market cap charts.
Any metric is important when it helps you achieve your trading and investment goals. This particular one can help you understand how well the crypto market performs without its major movers. Since BTC and ETH often drive overall market direction, excluding them provides a clearer view of capital flows, growth, and sentiment across altcoins and decentralized finance assets.
This metric is particularly useful for traders who focus on altcoins, DeFi, and higher risk–reward opportunities. Changes in the market cap excluding Bitcoin and Ether can signal shifts in market sentiment, emerging trends, or periods of increased activity outside the largest coins.
To identify new opportunities, explore the DEX Screener and read what other traders think in crypto trading ideas.
This metric is particularly useful for traders who focus on altcoins, DeFi, and higher risk–reward opportunities. Changes in the market cap excluding Bitcoin and Ether can signal shifts in market sentiment, emerging trends, or periods of increased activity outside the largest coins.
To identify new opportunities, explore the DEX Screener and read what other traders think in crypto trading ideas.
As a broad market metric, it can serve as a trend indicator. A growing crypto market cap excluding Bitcoin and Ether may signal several things:
- Bullish cycle: Usually, Bitcoin and Ethereum start to grow first, but other cryptocurrencies follow shortly after.
- Market correction during a bearish trend: Small capital inflows into altcoins can trigger a short-term uptrend, but watch out for a dead-cat bounce.
- Altcoin season: As a bullish cycle starts to slow, funds often shift from Bitcoin to smaller cryptocurrencies.
To apply this in practice, compare various coins’ dynamics on our crypto market cap charts. For more detailed analysis and trading insights, explore the Crypto Coins Screener.
- Bullish cycle: Usually, Bitcoin and Ethereum start to grow first, but other cryptocurrencies follow shortly after.
- Market correction during a bearish trend: Small capital inflows into altcoins can trigger a short-term uptrend, but watch out for a dead-cat bounce.
- Altcoin season: As a bullish cycle starts to slow, funds often shift from Bitcoin to smaller cryptocurrencies.
To apply this in practice, compare various coins’ dynamics on our crypto market cap charts. For more detailed analysis and trading insights, explore the Crypto Coins Screener.
It may — sustained growth in the crypto market cap excluding BTC and ETH often accompanies periods when altcoins outperform these two coins.
But you shouldn’t make your decisions based on only one metric. Explore more crypto market cap charts and find out what other traders think with crypto trading ideas before you leap.