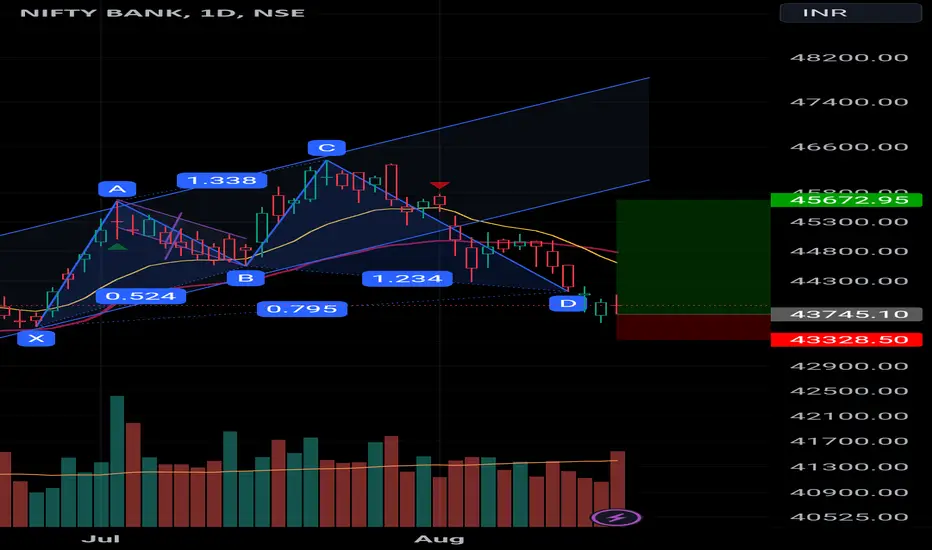
Bank nifty Cypher patternBank nifty formed a decent Cypher pattern, setting up for long trade near 44100 with SL at 43300. Longby anyg00
VETO: Breakout and Harmonic PatternsThis analysis will provide an in-depth examination of the technical aspects of VETO's weekly chart, focusing on the recent breakout of a falling trendline, potential RSI resistance breakout, and the formation of harmonic patterns. Additionally, a potential trade opportunity will be explored based on these technical signals. Chart Analysis: Analyzing the TradingView chart of VETO offers insights into the stock's current technical conditions and possible price movements. Breakout of Falling TLongby yaashul1
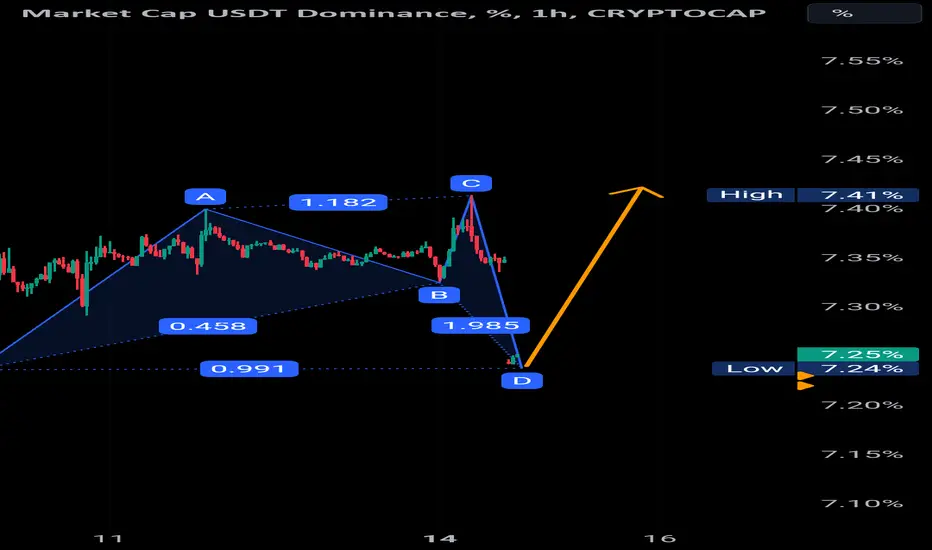
USDT.D FORMED BULLISH SHARK USDT.D formed bullish shark with gap down and also having bullish divergence along with that it is over sold region which leds to massive rise, if it rises crypto will bleed. Becareful guys , have a good trading day.Longby crypto_vulture_signals1
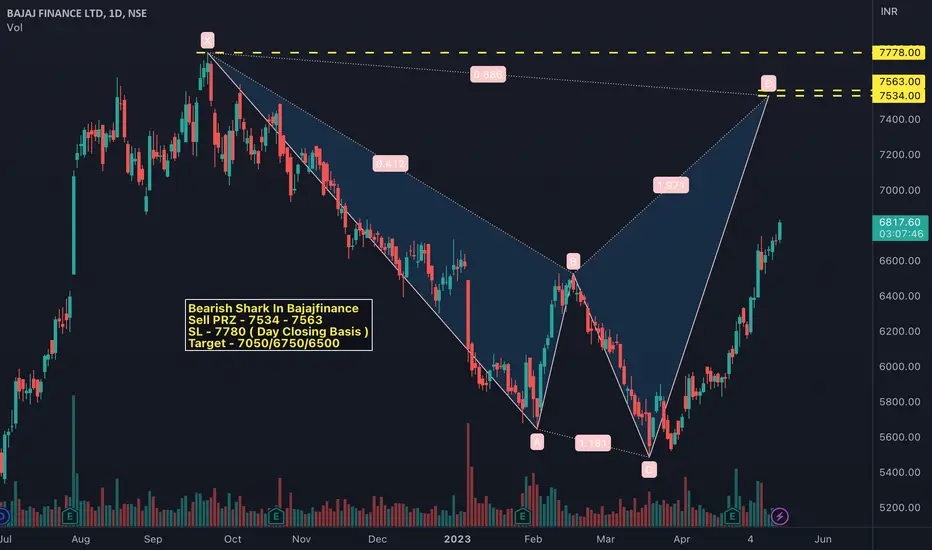
Bearish Shark In BajajfinanceBearish Shark In Bajajfinance Sell PRZ - 7534 - 7563 SL - 7780 ( Day Closing Basis ) Target - 7050/6750/6500Shortby ShareMarketCoachUpdated 2
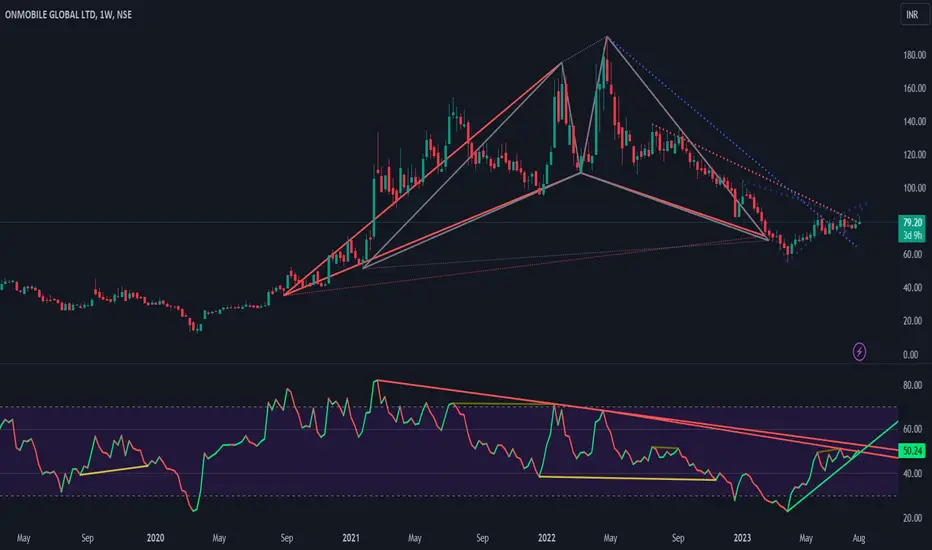
ONMOBILE's Chart: Bullish Breakout and Harmonic PatternsIn this analysis, we will delve into ONMOBILE's weekly chart, focusing on the breakout of the falling trendline and the presence of both Shark and Cypher Harmonic Patterns. We will assess the potential buying opportunity for ONMOBILE based on these technical signals. Let's proceed with the analysis. Chart Analysis: The TradingView chart for ONMOBILE reveals important technical factors that could influence the stock's price action. Breakout of Falling Trendline: ONMOBILE's weekly chart exhiLongby yaashulUpdated 2
RPSG Venture Flag & Pole BOA bullish flag and pole structure is completed on Weekly chart of NSE:RPSGVENT One can create a fresh position at CMP of Rs. 467 or Below with a stop loss of Rs. 440 and for target of rs. 494/521/538. Exit the position if the stop loss is triggered on WCB. DO YOU WANT ALL MY RESEARCH FOR FREE THEN DON'T FORGET TO FOLLOW ME. I AM EAGERLY WAITING FOR YOUR COMMENTS ON THE STUDY... Disclaimer: Content shared is for information and education purposes only and should not be treated as investmentLongby raigvivekUpdated 6
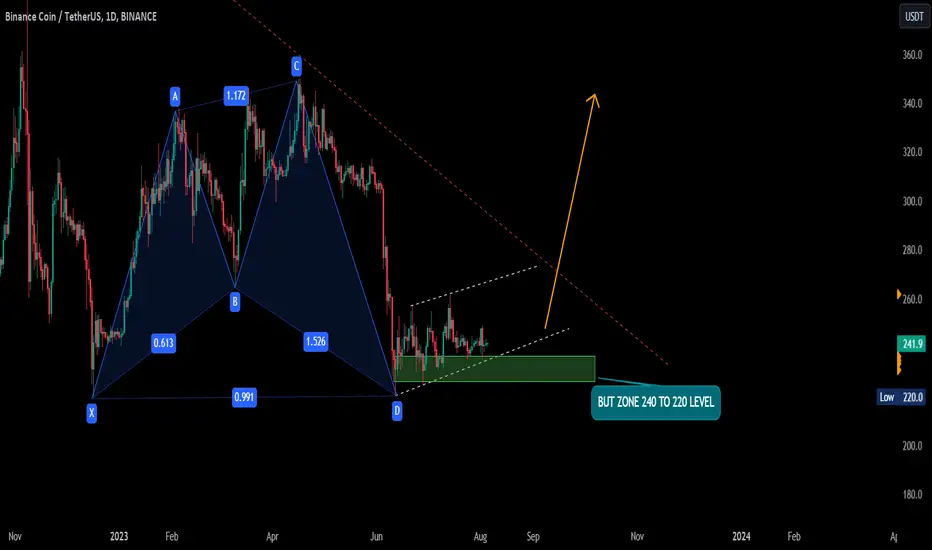
BNB CLEARLY FORMED BULLISH SHARKBNB is accumulating phase now, clearly bullish shark pattern and imp resistance trend line if it breaks the conformation of bullish shark that will hits huge targets like 400$ level. Longby crypto_vulture_signals11
IGL's Chart: Support at Rising Trendline and SharkIn this analysis, we will thoroughly examine the technical aspects of IGL's chart, focusing on the support at the rising trendline and the presence of a Shark Harmonic Pattern on the daily timeframe. We will assess the potential buying opportunity for IGL based on these technical signals. Let's proceed with the analysis. Chart Analysis: The TradingView chart for IGL reveals significant technical factors that may impact the stock's price action. Support at Rising Trendline: IGL's candlesticLongby yaashul0
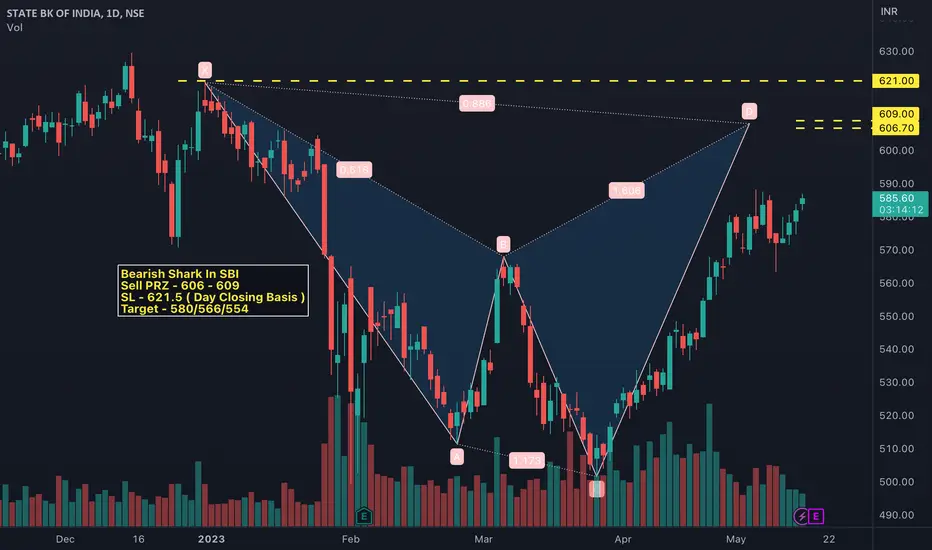
Bearish Shark In SBINBearish Shark In SBI Sell PRZ - 606 - 609 SL - 621.5 ( Day Closing Basis ) Target - 580/566/554Shortby ShareMarketCoachUpdated 11
TOTAL 3 BEARISH SHARK PATTERN TOTAL3 clearly bearish and chance to loose support or can bounce till 380B level. in case bad economy with high interest rates can break support and next support will be 290B. #Bitcoin #nft #bnb #eth #btc #BSC #Binance #trading #altcoins #cryptocurrency #cryptoby crypto_vulture_signals1
SP500 INDEX FORMING BEARISH SHARK SP500 index moved rapidly upwards now it need correction and same time we can observe proper double top and bearish shark is forming and RSI also over bought region which indicates next month we can expect some bleeding till November it may also continue if FED increase interest rates becoz of inflation. #Bitcoin #nft #bnb #eth #btc #BSC #Binance #trading #altcoins #cryptocurrency #cryptoShortby crypto_vulture_signals16
Analyzing CUB's Harmonic Shark Pattern, Trendline SupportIn this post, we will conduct a comprehensive analysis of Cub's weekly chart, focusing on the formation of the Harmonic Shark pattern based on Fibonacci levels. Additionally, we will explore the presence of trendline support, the demand zone, and the RSI indicator. By examining these technical aspects, we aim to gain insights into the potential direction of the stock. Let's delve into the analysis and explore the situation. Chart Analysis: Upon reviewing the provided TradingView chart for CubLongby yaashulUpdated 5
JACKPOT BUY IN GOLDBullish Alt Shark Cmp - 58055 Buy PRZ - 58019/58126 SL - 57700 Target - 58900/59475/59900Longby ShareMarketCoachUpdated 5
DON'T MISS THIS ONE - SENSEXBearish Shark Level - 62932 - 63026 SL - 63601 Target - 61550 / 60700 / 60000 Bearish Alt Shark Level - 64217 - 64523 SL - 65300 Target - 62500 / 61500 / 60650Shortby ShareMarketCoachUpdated 147
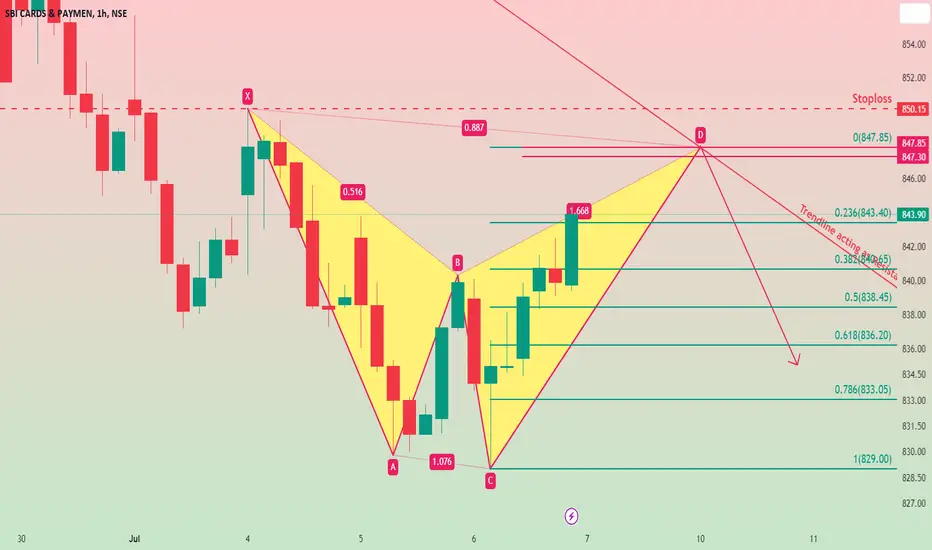
Be Ready for another retracement in SBICARDSName of the Stock - SBICARDS Time Frame - Hourly . . Name of the Pattern - G2 Bearish Shark Harmonic Pattern . PRZ 1 - 847.85, PRZ 2 - NA , PRZ 3 - 847.30 . Stoploss - 850.15 . Additional Signal - Trendline acting as Resistance is near PRZ Zone . . . Note : Previously I have Posted Harmonic Analysis on Higher Time Frame including Daily, Weekly and Monthly. Some user asked me, try to post Harmonic Analysis on Smaller Time Frame. So I am posting this first analysis on smaller Time Frame.Shortby VIJAY_ARUN_SURYAWANSHIUpdated 87
After Bullish Rally Nifty is near Extended Extreme Shark LevelNifty 50 Time Frame - Daily . . Name of the Pattern - G2 Bearish Extended Extreme Shark (2.24) Harmonic Pattern . PRZ 1 - 19256 PRZ 2 - 19234.65 . . . Name of the Pattern - G2 Bearish Extended Extreme Shark (2.618) Harmonic Pattern . PRZ 1 - 19347.75 PRZ 2 - 19334.30Shortby VIJAY_ARUN_SURYAWANSHIUpdated 24
Bearish Alt Shark In PowergridBearish Alt Shark In Powergrid Sell PRZ - 251.9/253 SL - 257.1 Target - 244/240Shortby ShareMarketCoachUpdated 5
Bearish Alt Shark In NiftyBearish Alt Shark Sell PRZ - 18795 SL - 18831 Target - 18744/18715Shortby ShareMarketCoachUpdated 2
Bullish Harmonic In NasdaqNasdaq may fall 1.2-2% from Cmp Bullish Shark PRZ - 12952/12969 Bullish Alt Shark PRZ - 12848 SL - 12760 Target - 13108/ 13160Longby ShareMarketCoachUpdated 2
JKLAKSHMI's Anti-Shark and Bat Patterns, Potential TargetsIn this post, we will conduct a comprehensive analysis of JKLAKSHMI, focusing on the formation of the anti-shark and bat patterns on the chart. Additionally, we will consider the impact of a rumored reduction in Goods and Services Tax (GST) on cement products, which could potentially influence the stock's performance. Let's delve into the analysis and gain insights into the situation. Chart Analysis: Upon examining the provided TradingView chart for JKLAKSHMI, we can observe the formation of Longby yaashulUpdated 0
CanFinHome: Weekly Chart Analysis Signals Bearish MomentumIn this technical analysis article, you can examine the CanFinHome weekly chart and evaluate various indicators and patterns to gain insight into potential price movements. We focus on horizontal resistance, Elliott wave theory, daily RSI, anti-shark patterns and price action to estimate the future direction of the stock price. Weekly horizontal resistance: The first significant observation on the Can Fin Homes weekly chart is the presence of a pronounced horizontal resistance level. This leShortby yaashulUpdated 0
Bearish Alt Shark In SGX NIFTYBearish Alt Shark In Nifty Sell PRZ - 18756/18790/18813 SL - 18822 Target - 18690/18620Shortby ShareMarketCoachUpdated 311
Bearish Harmonics In NasdaqBearish Shark Sell PRZ - 14625/14791 SL - 15275 Target - 13125/12600 If Breaks 15275 Bearish Alt Shark Sell PRZ - 15765/15826 SL - 16400 Target - 13765/13100UShortby ShareMarketCoach5
Nifty is in strong resistance zoneNifty is in strong resistance zone and might be a reversal from this zone as Nifty has achieved 78.2% retracement from the bottom i.e. 16828 and also 5th wave is about to complete in this zone. Short Nifty positionally also for the mid term (approx. upto July) target 16400-15800. for short term :- Short Nifty @ 18328-18486 SL 18588 (SL on 15 min. candle close) Target 17709-17780Shortby UnknownUnicorn8777733Updated 1218
 LongLong
 Long
 Long
 Short
 Long
 Long
 Long
 Long
 Short

 Short
 Long
 Long
 Short
 Short
 Short
 ShortShort
 Long
 Long
 ShortShortShort