GLong
Shooting Star

DXY - Weekly bearish divergence! + Elliott Wave + PIN BAR!- As per my Elliott Wave technical analysis - it looks like the massive impulse wave can be completed and we are now headed to a retracement.
- On the weekly chart we have a shooting star - bearish candle with a long wick ( PIN BAR )!
- If we take a look at the RSI indicator on this chart, we can see a bullish divergence , which is a pretty strong bearish signal.
- We don't really know how deep the retracement will be, but we can go back down to the acceleration point + 0.618 FIB.
- MACD his
 Short
Short
POWERFUL PIN-BAR SHOOTING STAR. BELOW THE ICHIMOKU , LONG WICKS Powerful Pin-bar Shooting Star.
Price Below The Ichimoku Cloud - Tested Return To Cloud And Was Rejected.
A Veritable Forest Of Long Upper Wicks.
Bear.
Drop Of Price Imminent.
 Short
Short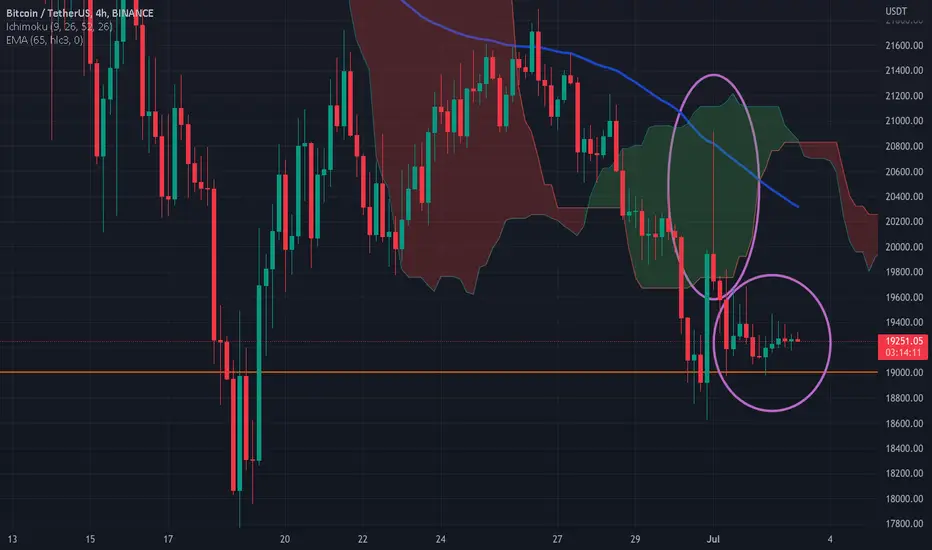
LEO USD "Bull" AlertDaily Chart
Above 200 moving average
Trending up GANN Angle channel
Previous Shooting Star All time high is retest target
Next Fib extension level is 0.78 (second target)
Breaks the 6.30 resistance possible further uptrend to ATH again.
 Long
Long
SHOOTINGSTAR CANDLE IS GOOD WAY TO SHORT ETH. JAPANESE homageWell, high tide followed by low tide, followed by high tide...
The market always in motion - it is , as Japanese say 'A floating world'
A pin-bar top candle is aptly named Shooting Star in Japanese candle formations.
As we owe the invention of candles themselves to the Japanese, and specifically the shooting star, it brings Japanese ideas of the world.
Such as the EPHEMERAL state of everything , including prices.
Beautiful art.
The term Ukio-e translates as "picture of the floating world".
 Short
Short
Don’t shoot the messenger!While there has been much commentary about the US Dollar Index hitting 100.00, we note two things from a technical perspective – the first is a shooting star pattern on the candlestick charts and the second is that the daily RSI has yet to confirm the recent high.
This happens when price makes a new high, but the oscillator does not – it is otherwise known as bearish divergence.
It generally denotes a loss of upside momentum.
The shooting star however is a bit more serious this is a bearish

AUDUSD shortOANDA:AUDUSD
Expecting a bearish movement on AUDUSD with price breaking structure on the 1H. On the DAILY and WEEKLY timeframes a long wick(shooting star candlestick) formed on a major/key level of resistance. Price also broke support and is making a retest

 Short
Short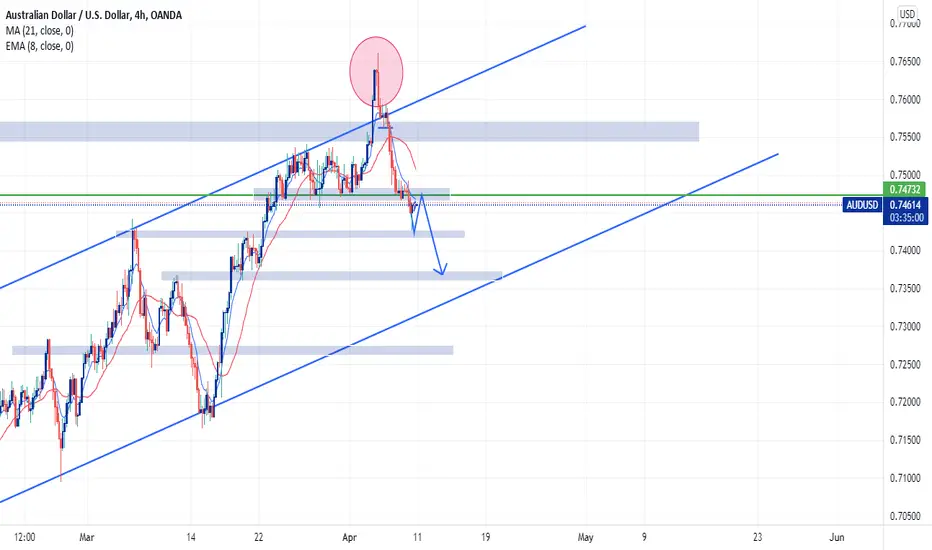
CPO Unstoppable Rocket? Or…. Ranging?What’s other factors would continue to move palm oil prices?
1. India imports hit 12-months low on sky high prices in CPO. This may led to demand further decline as buyers are price sensitive as it relies on imports for 60% of its needs. Currently, India rely on existing stockpiles and incoming domestic rapeseed crop to meet domestic demand
2. Revision of export restriction from Indonesia as food protectionism grows. Companies need to allocate 30% of exports for home market. Government are takin

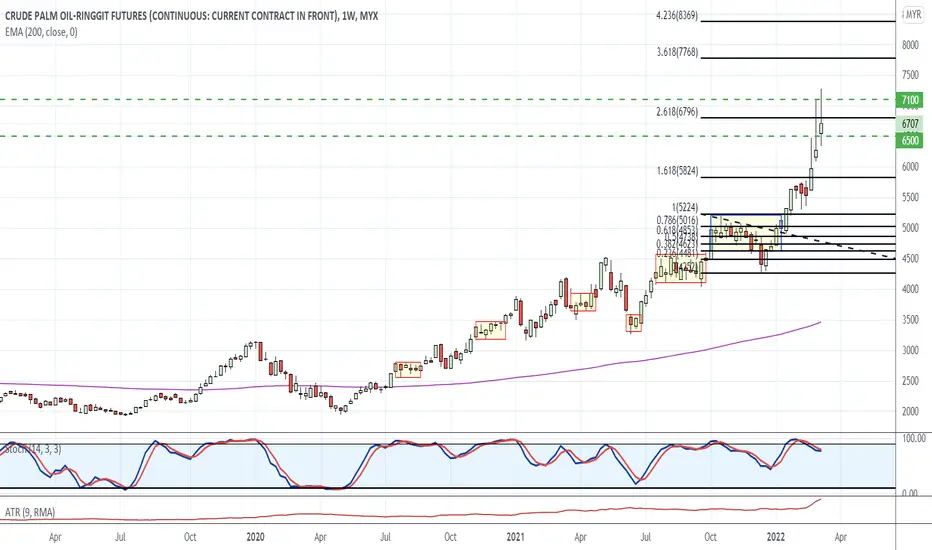
CPO Continue above 7000? Or Ready for Correction?FCPO declined by nearly 8% on last Friday and closed at 6276 as profit taking took place, but posted 2nd weekly gains after touched on historical high at 7108.
So, what’s make palm oil now the costlier edible oil among the 4 major edible oils?
Global commodities rallied following EU bans certain Russian banks from SWIFT bank payment system which aimed to stuttering the Russia economy and introduces further restrictions.
The war expected to disrupt the processing and export of Ukraine oilseeds

AUDUSD GOING DOWN FROM HERE - GREAT SWING TRADEI take short trade here from the following reasons:
1.Bear flag (the last wave before breakout)
2.Resistance
3.Supply candle (marked with yellow TL)
4.Bear Shooting star candle
5.200ema
6.Entry the Fib golden zone
7.50,100,200 EMA Weekly just above the price.
Just look nice for me
Short
Gold Prices End on Uncertain Footing as Ukraine Tensions SimmerOn the weekly setting, gold has left behind a Shooting Star candlestick pattern, showing signs of indecision following gains since earlier this year.
Ukraine geopolitical tensions cooled into the end of the week, resulting in a long upper wick on the weekly candle.
Further escalation could easily bring back upside momentum in the yellow metal, while cooling tensions may do the opposite.
Extending a turn lower would place the focus on rising support from the middle of 2021 before the 1750 infl


AUDUSD SHORTDaily chart making series of LH- lower highs suggesting price is in its continuation pattern to the downside.
Inner trendline on daily with 3 touches and candlestick reversal pattern infers price is already looking to short.
On the 4HR lookout for more confluence such as MA crossovers, counter trendline break and candlestick pattern which will give an opportunity for entry.
A good reward to risk is expected from this opportunity. 100 to 150 pips is a possible scenario here given that price is l
Short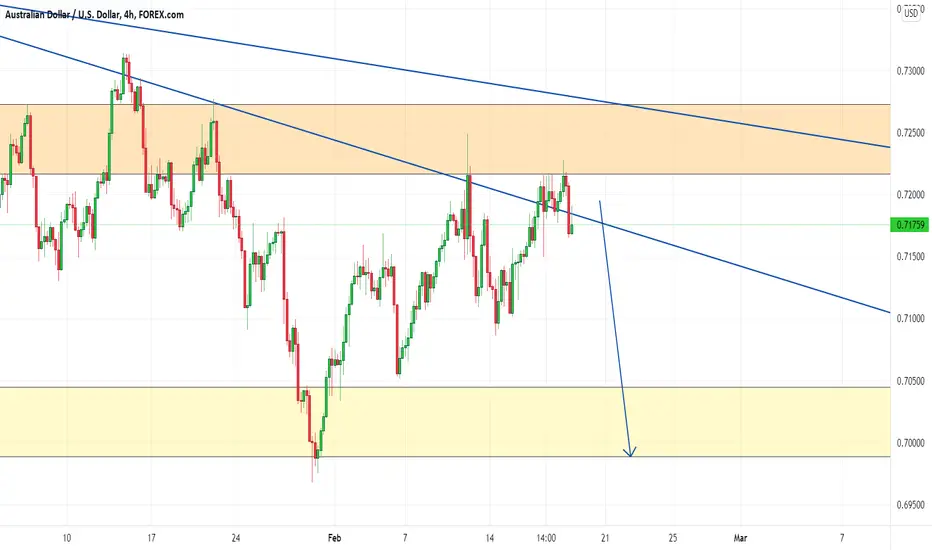
BTCUSDT Shooting Star Candlein BTCUSDT weekly timeframe, last week candle closed as we call it "shooting star" candle. this is not a good news because after such candles we usually have a bearish market for some weeks. so watch your long positions.

Bearish Wedge ~ Short SetupAfter the Shooting Star we had on a weekly, and the continuation of this ending this week before a long weekend on the NYSE, I believe the short-position could play out well.
The bearish wedge formed has a measured move to a 30K; which is coincident with 2021 heavy support. If we can see a test of 28K to freak people out and a close (weekly basis) above 30K. The momentum may shift back. For now, I am bearish.
Short
#Bitcoin and the Weekly Shooting StarHi everyone,
Thank you for considering reading my idea. Please note that this is just my opinion, and I'm not saying that this is going to happen.
Note that I'm mid-term bearish on Bitcoin but long-term bullish. See related ideas below. My down candle is color green while the up candle is color red .
Who wants to see a shooting star? Well, just last week, we printed a shooting star. Let's go back to the basics! A Shooting Star is a bearish candle stick pattern; a sign of reversal. Ther
Short
Shooting star candle on Bitcoin weeklyReversal candle forming on BTC weekly chart. Expecting red week downt to next support areas around 37k.

Bitcoin Shooting Star Weekly chart of BItcoin shows a shooting star.
BTC could not get out of the upper range. We should see some selling to test 33K.
Short
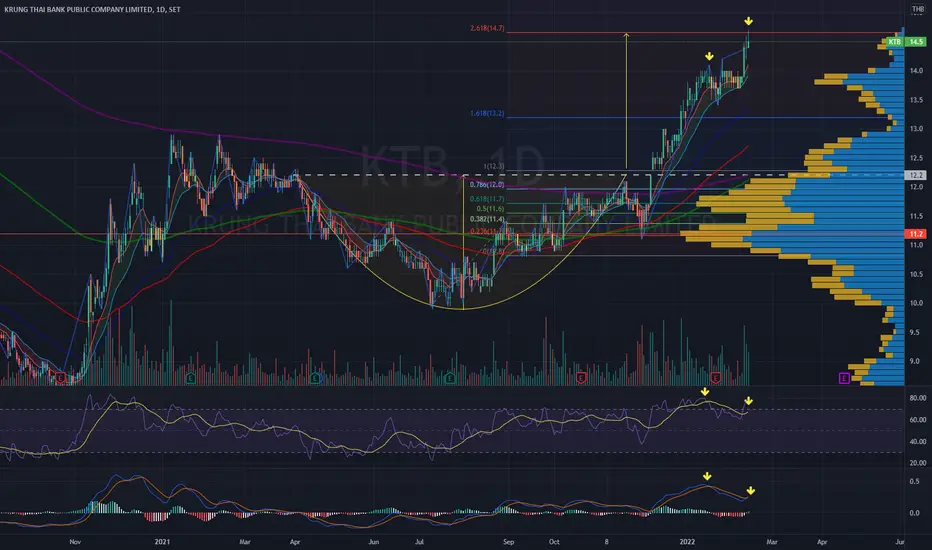
KTB | Saucer uptrend target | Bearish Divergence | Take Profit?Price Action & Chart Pattern Trading
> Saucer uptrend target zone 2.618 Fibonacci extensions
> Slight RSI and MACD bearish divergence
> Time to start taking some profits
> Shooting star candlestick - bearish pattern
Good Luck

UJ shortWe have a shooting star on a resistance level on a daily time frame! Sell opportunity for intraday traders!
 Short
Short
+3.45% ROI thanks to a simple Daily Shooting Star reversal stratHi Traders,
STATEMENT
Let’s keep diving into the daily time frame to build an expectation of the direction the market could be heading to on the FX:AUDUSD pair.
A directional bia s is a powerful tool that can facilitate your trading journey when executing on lower time frames.
RATIONALE
Analyzing the daily time frame before thinking on taking a trade on a lower time frame can help you to:
1. spot robust areas of support and resistance ,
2. Avoid fading strong daily candles (high pr
Short
FTM . . . THE ENDHi guys
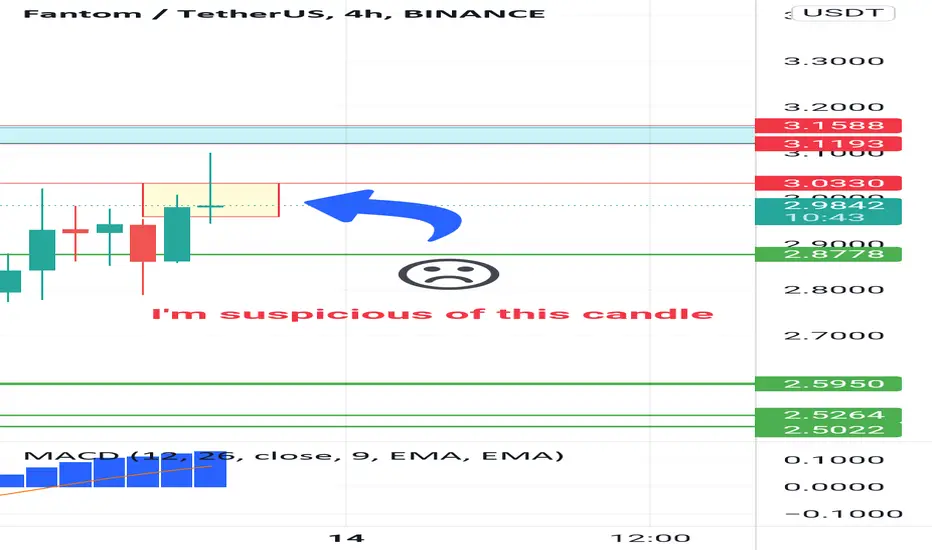
I am suspicious of this candle , if this candle be a shooting star , this point is the end of ftm bulish trend ...
Dont forget to like
FShort
YES! WE'RE SURE, ABSOUTELY CERTAIN, WE SHOULD SHORT NOW!!!LOL, follow-up to a recent post. We got a shooting star Doji on the daily 30 Dec at ATH retest and fierce EOD sell.
Looks like Thursday's gap was Exhaustion, filled EOD and sold lower. I be Shorting any subsequent rally into the New Year!
This ain't advice, you could lose a lotta damned money doing this! Trade at your own risk, GLTA!!
UShort

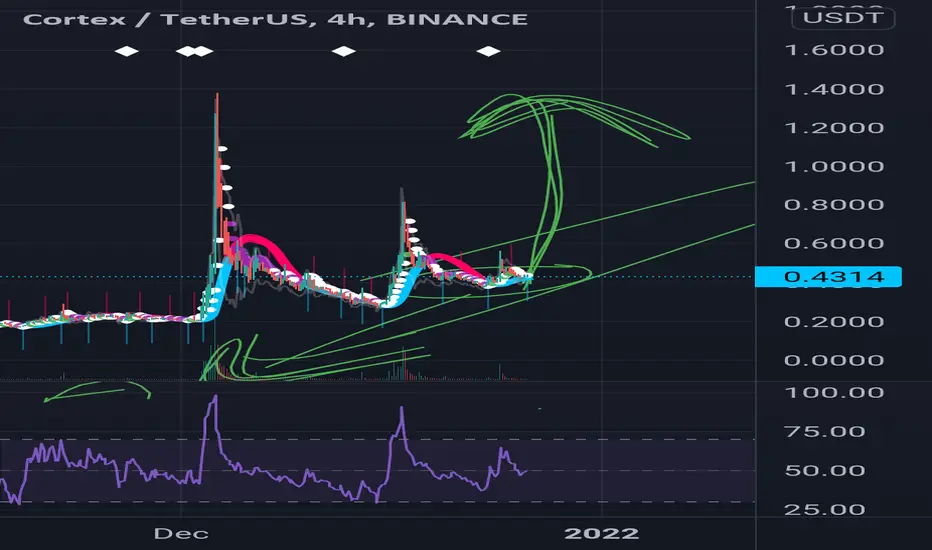
CTXC/USDTPerfect accumulation all time frames are bullish !
Invest in early gift me back then 🎁
Will soon pump here to ATH !
Good upgrades coming for Ctxc and will make a pumo here !
See all times frame perfect accumulation !
CLong
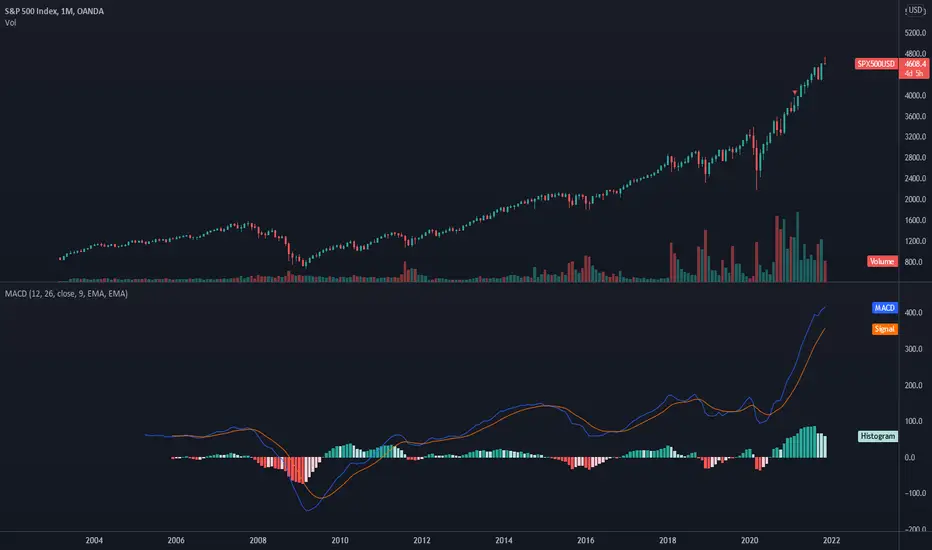
Shooting Star on SPX MonthlyThere is a shooting star candlestick developing on the SPX monthly chart (I use SPX500USD for my charting here).
Because we are at the end of november, unless we have significant amounts of upward momentum soon (I.e. on Monday and Tuesday) then this will leave a shooting star as November's candlestick.
This is a very bearish signal.
You can see from here that MACD is very toppy.
However, if we zoom out to put this into context....
MACD is significantly more overbought than it was dur
 Short
Short