Spinning Top
XAU/USD- Daily overviewhello everybody!
-On a daily time frame chart, we can see that the price reached a solid area of resistance.
-The price formed a spinning top pattern which shows us indecision in the market so that means that the bears and bulls are in similar control but in this case, we can see that at the end of the day the price closed in a bearish form.
-The price moves in a descending channel so if the price breaks the resistance line we can expect that the price is going to reach the upper trend line o
MULTI-TIMEFRAME ANALYSIS - DXY1W Analysis
The pair closed its previous candle below the 1W trend line support and seems to be testing the 1W support zone. A break below the support zone could indicate a further sell towards the next zone. A break above the trend line support turned resistance could see the price rally towards the 1W support turned resistance zone.
1D Analysis
The pair recently broke out of a pennant and previously closed within the 1W support zone. A rejection from the 1W support zone could see the pai
NIO: What could cause a pullback now?Hello traders and investors! Let’s see how NIO is doing today!
First, we have a Double Top chart pattern in the hourly chart, and if triggered, it could be the start of a pullback in the daily chart. The $ 39.74 is the resistance NIO must defeat to cancel this pattern, and it is at the same time a Pivot Point, that could resume the bull trend. So, the $ 39.74 is a quite important point to keep in mind.
What’s more, we have a strong support zone that could hold the price if NIO drops, at
UBER vs LYFT: A technical comparison.Hello traders and investors! Let’s see what’s going on with UBER and LYFT today. Both stocks are doing some impressive movements, so it is a good time to study them.
First, let’s start with UBER. The stock is doing a phenomenal movement today, but if we look at the charts, it just hit a resistance zone today, the black line at $ 41.86, and now it is doing what it seems to be a Spinning Top candlestick pattern .
Either way, UBER must keep trading above the yellow line at $ 38.59, because i
MULTI-TIMEFRAME ANALYSIS - GBPUSDGBPUSD recently broke out of its 1D descending parallel channel, which seems to be a bullish flag, it then re-tested the channel thrice with the last 1D candle closing as a bullish spinning top.
1D Analysis
The Friday candle closed as a bullish spinning top after its retest of the 1D descending parallel channel, this could be a possible indication for a reversal to the sell trend prior to the bullish spinning top.
A successful bullish spinning top might create a possibility where the pair
Formation of Spin Top in Golden Level This candlestick pattern (Spin Top) represents indecision about the future direction of the asset. Neither the buyers nor the sellers could gain the upper hand.
COVID Vs Us Election and News
U
SPX: Weekly outlook and Multi Time Frame Analysis.Hello traders and investors! Let’s see what’s new on SPX, and since it is Friday, let's do a complete MTFA by studing all our main time frames (H,D and W).
First, the hourly chart is inside a Descending Channel , and now it is struggling a lot to defeat its resistance at the upper purple line. Also, it has a clear pivot point at 3,466, and if triggered SPX would finally escape from this bearish trend in the short-term, and it would seek further resistances.
Meanwhile, it seems the price f
Bitcoin: weekly timeframeAfter a long time I finally noticed this. Something made me BC before I spotted the pattern and then it just jumped out of the screen... Maybe I have spotted it and forgot about it lol idk. someone let me know in the comments below 😂
''Took you long enough'' they say! Hehe good one!!
Here we see a cypher pattern.. Hanging man / spinning top can be spotted at the reversal zone. Notice last week price action formed another hanging man giving the bearish signal after hitting the fibonacci circle
BAND- Just got listed on Coinbase! Another oracle play like LINKThere is no denying that LINK's first mover advantage in Oracle space, amplified by the DeFi gold rush, has resulted in its tremendous surge recently.
Another reason is that many of its competitors such as BAND, TELLOR, DOS and NEST can only be traded on Dex (decentralized exchange), centralized exchanges such as Polonix (who still use it?) and foreign exchanges that don't take U.S residents (Binance and many other obscure exchanges)
That changed today when Coinbase added BAND! With the incre
Spinning Top Reversal ? BTC/USD #btc #crypto #reversalWell , seems we have a classic spinning top candlestick on the Bitcoin 1 day chart . I recently did a chart showing the Gann Fan as well as the CME futures gap on Bitcoin near 118xx which already filled . But now we have what looks like a reversal candlestick . When a candlestick has a very small body evenly in the middle of two long wicks it's called a spinning top - and if it comes after an uptrend then it usually signals a reversal of that trend ( and that we would see some downside .) Same
AMD - bearish wedge & spinning top reversal. P/E 167 says it allFor any professional trader the situation is obvious:
1) Rising (bearish) wedge
2) Spinning top candlestick
3) Overbought RSI on both, Daily and Weekly
4) Low volume compared to the previous bullish candle
5) Overinflated P/E
At this point, I can actually finish describing my call since it's more than enough to explain why "short" is the only way to go right now.
However, I would like to go a little bit further: Bulls have to understand, that the only reason for AMD's "bullishness" is the d
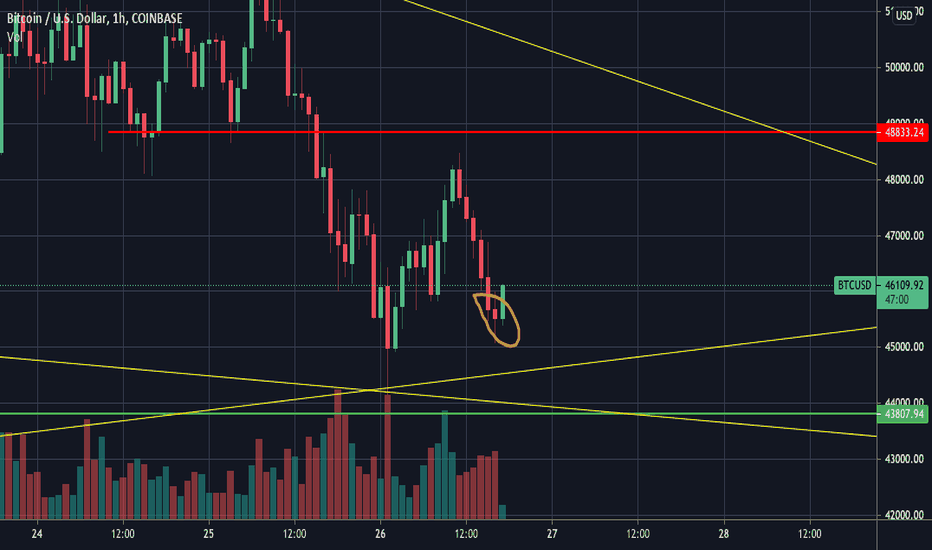
Bitcoin may be Loading Its Guns!!Hello Traders! I've analyzed btcusd & found many Time-frame formations & Patterns. Here is Bitcoin zoomed in on a 15minute Time-frame. Notice to the left I've identified a possible Spinning Top Pattern & its Local Support. Price is currently battling areas inside of a Descending Channel. Once again, it tests Resistance. Possible breakout Area is Highlighted in circle. I'm waiting for a smooth entry... Whats your thoughts on btcusd?