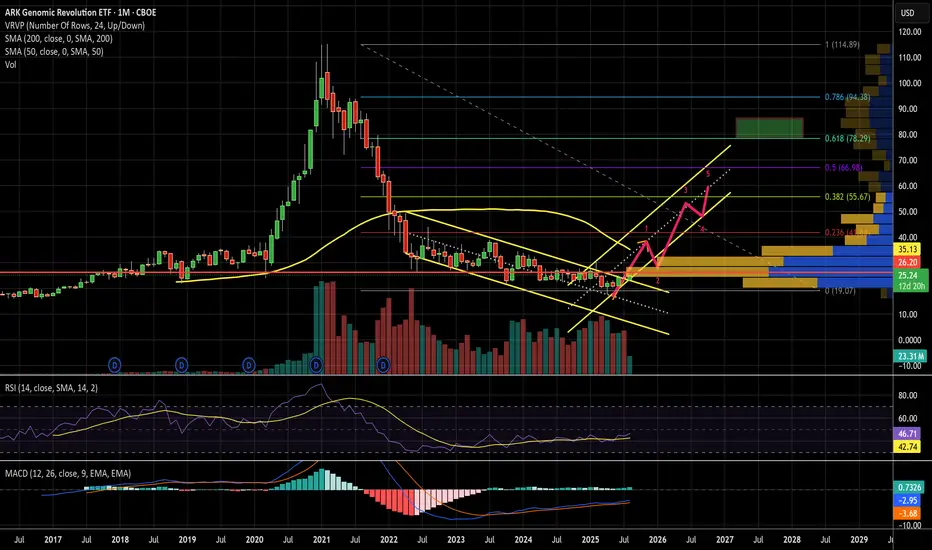
ARK Genomic Revolution ETFARK Genomic Revolution ETFARK Genomic Revolution ETF

ARK Genomic Revolution ETF

No trades
No trades

Compare with ARK Genomic Revolution ETF


Key stats


Assets under management (AUM)
‪2.09 B‬ USD
Fund flows (1Y)
‪261.08 M‬ USD
Dividend yield (indicated)
—
Discount/Premium to NAV
−0.1%
Shares outstanding
‪43.30 M‬
Expense ratio
0.75%

Fund info


Issuer
ARK Invest LLC
Brand
ARK
Home page
Inception date
Oct 31, 2014
Structure
Open-Ended Fund
Index tracked
No Underlying Index
Replication method
Physical
Management style
Active
Dividend treatment
Distributes
Distribution tax treatment
Qualified dividends
Income tax type
Capital Gains
Max ST capital gains rate
39.60%
Max LT capital gains rate
20.00%
Primary advisor
ARK Investment Management LLC
Distributor
Foreside Fund Services LLC
ISIN
US00214Q3020
CUSIP
00214Q302
FIGI
BBG007FJPCB0
Identifiers
ISIN US00214Q3020
CFI code
CEOGLS
ARKG reaches across multiple sectors and geographies for companies that the advisor believes will benefit from innovations in the genomics-related industry. Such companies are those that may develop, produce or enable targeted therapeutics, bioinformatics, stem cells or molecular diagnostics. The reality is almost all of its holdings are in US healthcare-related companies, with biotech naturally leading the way. This is a niche fund which employs an actively-managed strategy, hence investors should look closely at where the fund makes its bets before investing.

Classification


Asset Class
Equity
Category
Sector
Focus
Theme
Niche
Genomic advancements
Strategy
Active
Geography
Global
Weighting scheme
Proprietary
Selection criteria
Proprietary
What's in the fund
Exposure type
StocksBonds, Cash & Other
Health Technology
Technology Services
Breakdown by region
92%7%
Top 10 holdings

See all ideas 

Summarizing what the indicators are suggesting.
Oscillators
Neutral
Oscillators
Neutral
Summary
Neutral
Summary
Neutral
Summary
Neutral
Moving Averages
Neutral
Moving Averages
Neutral
Displays a symbol's price movements over previous years to identify recurring trends.

Frequently asked questions


An exchange-traded fund (ETF) is an investment product that holds a basket of assets such as stocks, bonds, futures, or other instruments, and trades on an exchange like a regular stock.

Why investors use ETFs:
– Easy way to gain exposure to sectors like stocks, bonds, real estate, or crypto
– Lower barrier to entry compared to buying individual assets
– Can help reduce volatility through diversification

Explore the largest ETFs: they are considered the most trusted and secure and will help you start your journey on the ETF markets.
ARKG net asset value (NAV) is 49.57 USD. It represents the total value of the fund's assets less liabilities.

Other key metrics:
– ARKG AUM — ‪2.09 B‬ USD
– ARKG discount/premium to NAV — −0.13%
– ARKG expense ratio — 0.75%

Explore more funds in our list of largest ETFs.
To put today's price into context, compare ARKG's performance across different time periods:
– 1 day — +0.36%
– 1 week — −3.50%
– 1 month — −7.86%

ARKG's all-time low was 15.00 USD on Feb 11, 2016, while its all-time high was 115.15 USD on Feb 10, 2021.

For a deeper look at market activity, explore the ETF Heatmap and the ARKG price chart.
The safest way to buy ARKG is through a reliable broker. Create an account, fund it, and place a buy order.

You can trade ARKG directly from TradingView:
– Choose a broker: Explore our supported trading partners and pick one that fits your needs
– Compare options: View available brokers side by side to evaluate fees and features
– Connect your account: Open Supercharts, click “Trade”, select your exchange, and log in
– Start trading: Place orders directly from the chart

Tip: If you’re new to trading, try paper trading first — it lets you practice strategies in real market conditions without risking funds.
ARK Genomic Revolution ETF expense ratio is 0.75%. It represents the annual cost of managing the fund, expressed as a percentage of its assets.

Other key metrics:
– ARKG AUM — ‪2.09 B‬ USD
– ARKG NAV — 49.57 USD
– ARKG discount/premium to NAV — −0.13%

Explore more ETFs with highest expense ratio and find even more stats in the ETF Screener.
Before making an investment decision, it's important to understand how the ETF works and whether it aligns with your goals and risk tolerance. Consider factors such as:
– The ETF's holdings
– Whether it is passively or actively managed
– Whether it uses leverage
– Its costs, performance, and other characteristics relevant to your strategy

You can also use technical analysis to assess current market conditions. Our summary Technical Ratings for ARKG are:
– Today — sell
– 1 week — buy
– 1 month — buy

For a deeper analysis, explore other ARKG technicals and follow the latest ETF news.
ARKG trades at a discount (0.13%).

Premium/discount to net asset value (NAV) expresses the difference between the ETF's price and its NAV value.
– A positive percentage indicates a premium, meaning the ETF trades at a higher price than the calculated NAV.
– A negative percentage indicates a discount, suggesting the ETF trades at a lower price than NAV.

You can find more funds in the list of highest discount to NAV.
The fund's management style is active, meaning its holdings are selected and adjusted at the manager’s discretion to try to outperform the market.

What it means:
– Active selection: Managers choose securities based on research and market outlook
– Flexible allocation: Holdings can change frequently in response to opportunities or risks
– Goal: Beat a benchmark index rather than track it

Combine this knowledge with other metrics:
– ARKG AUM — ‪2.09 B‬ USD
– ARKG NAV — 49.57 USD
– ARKG expense ratio — 0.75%

Explore more details in the Profile section and follow more actively managed funds on TradingView.
ARKG assets under management (AUM) is ‪2.09 B‬ USD. It represents the total market value of all assets held by the fund.

Other key metrics:
– ARKG NAV — 49.57 USD
– ARKG expense ratio — 0.75%
– ARKG premium/discount to NAV — −0.13%

Explore more funds in our list of largest ETFs. For deeper analysis, check the ETF Screener.
ARKG fund flows account for ‪261.08 M‬ USD, showing the net amount of money entering or leaving the fund over 1 year. Many traders use it to get insight into investors' sentiment and evaluate whether it's time to buy or sell the fund.

Other key metrics:
– ARKG AUM — ‪2.09 B‬ USD
– ARKG discount/premium to NAV — −0.13%
– ARKG expense ratio — 0.75%

For broader market analysis, read the latest market news and read the ETF trading ideas.
ARKG invests in stocks. See more details in our Profile section.
No, ARKG isn't leveraged, meaning it doesn't use borrowings or financial derivatives to magnify the performance of the underlying assets or index it follows.
ARKG shares are issued by ARK Invest LLC.
ARKG started trading on Oct 31, 2014. The launch date marks the fund's first day on the exchange and the start of its publicly available price history.

The age of a fund can be useful when evaluating its track record, as older funds typically provide more historical data for analyzing performance across different market conditions.