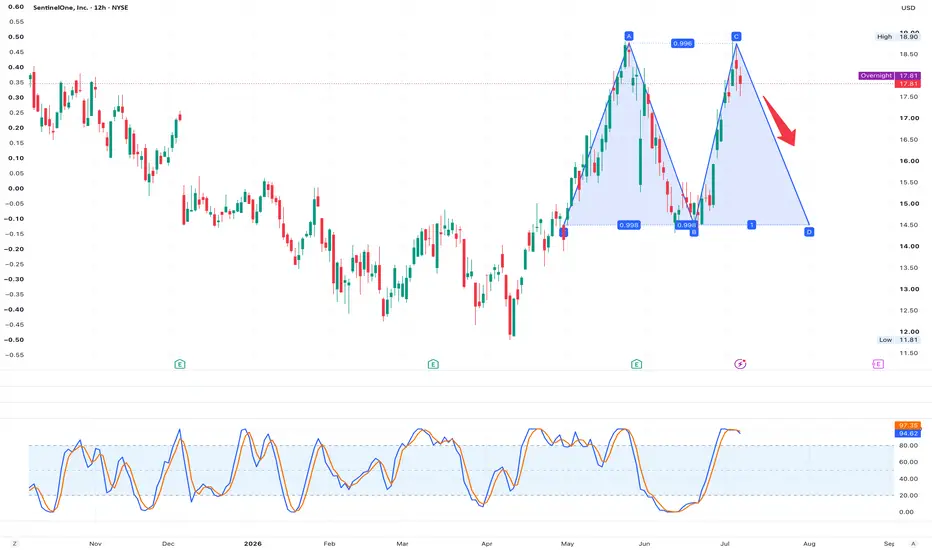
The stage is set for xrp to break up from the bullflag Lots of bullish confluence at the moment on XRPUSD’s 1 day chart here. First off we just closed our 1st daily bullish candle above the top trendline of the bullflag. Secondly the stochrsi has been in the fully reset / oversold zone for over a week now and has just now dipped back up into the bullish zone. Thirdly, the golden cross is likely to occur sometime this week and price action is still relatively close to the 200ma which increases the probability of a sustained golden cross. Lastly tomor
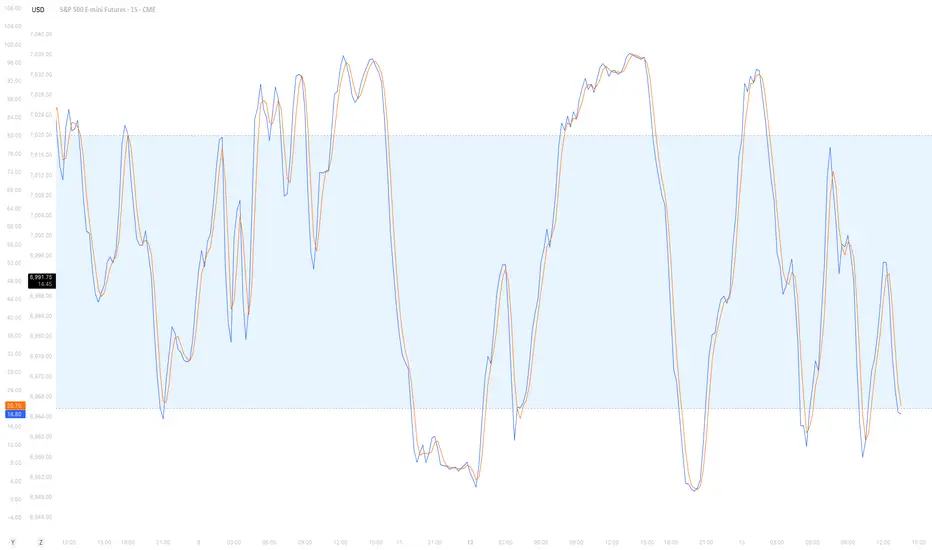
Stochastic Oscillator
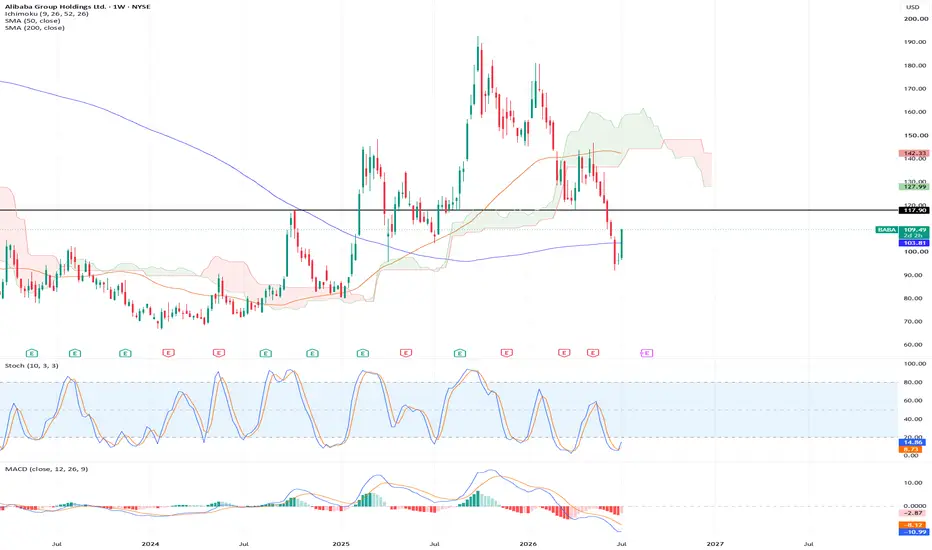
BABA showing signs of life.BABA, Alibaba, 1W / 1D
(AI summary of my analysis)
China internet has quietly started to turn up this week (KWEB, MCHI, FXI all curling higher on relative strength for the first time in a while). BABA is the name I want inside that. This is an early one, so I'm treating it like a probe, not a conviction long.
The setup:
- Fresh 52-week low, one week of consolidation, and now a big thrust week. Daily is up double digits on the heaviest volume in months and reclaimed the 21 EMA and 10 SMA. Weekl
Ethereum weekly: RSI, STOCH & MACD, all bullishEthereum's weekly RSI produced a lower low in March-Feb 2026 vs March-April 2025. We know that ETHUSDT produced a very strong higher low. Here we have a hidden bullish divergence, this is a very strong signal.
At the same time, the RSI hit the lowest level since July 2022, the previous bear market bottom. This happened in early March.
Here is the chart:
There is a delay with the signals coming from the oscillators so it is good that the RSI is already rising.
The STOCH has been oversold sin
Caution needed for Tesla, Heres the Macro TA reason whyHello.
Tesla on the 1 month timeframe warrants caution. Larger timeframe always dictate larger % moves for longer periods of time. And its something to always consider when trading and investing, i know i do.
Tesla has made strides as one of the best performing companies ever to exist. Thats a given and no one can say other wise. Evaluated at 1.5 Trillion.
But regardless no company, no asset is exempt from the grasps of market uncertainty created by human psychology and market algos. We mus
Kraft Heinz Signs Point to Bearish Trend Flipping BullishHi,
So this is a 3 Day analysis on Kraft Heinz.
Notice our Downtrending Bearish Channel that we've been bound to since September 2024.
Current Candle is in a clear breakout above the Upper border of Channel.
It still not set in stone exactly where we go from here and chances of fakeouts exist early into moves. Look for the next couple candle prints for more clues.
We are also currently above the 21 EMA, looking at past data, it has indicated further upside in many cases
With that the most
KLong
Apple Bearish Macro May Warrant Caution in Coming MonthsThis is a Macro technical analysis of Apple. Its on the 1 Month timeframe.
So note that February candle just began and will close 28th of Feb so we still have long ways to go.
And note moves on 1 Month are usually powerful ones indicating Macro trends.
So starting off, notice the Ascending Channel i've lined out.
We've been bound to this channel since 2020. Therefore the channel has a Macro hold on price action. And we can use previous interactions with channel as reference.
So previous to
Don't Sleep on UPWK Macro signs for UpsideMACRO Technicals on UPWK as long as the developments continue, showcase UPSIDE.
This analysis is on 1 Week.
So if today showcases a positive day, a Bullish weekly close would be in the cards for UPWK.
So important to note and observe.
What i want to highlight is the almost 3 year Consolidation zone or in other words rectangle pattern UPWK managed to breakout and confirm in Sept 2025.
I like to look at consolidation zones as a thing that builds up pressure for assets and breakouts are always
MACRO Bullish Case for GBCI on 1 MonthGlacier Bancorp (GBCI) has some Macro develops that have caught my eye on the 1 Month timeframe.
With the right lower timeframe signals, there may be a trade at some point.
Ill be looking at price action, chart patterns, indicators, candle configurations and more to continue my assessment on this.
NOTE: Being that this initial assessment is on 1 Month, keep in mind we still have 8 days for this month's candle close.
Also being that this is on 1 Month, price movements can showcase strong macro
Understanding Stochastic Oscillator In TradingThe Stochastic Oscillator is one of the most widely used momentum indicators in technical analysis. It helps traders identify potential trend reversals, overbought and oversold conditions, and momentum shifts before price reacts.
Unlike trend-following indicators, Stochastic focuses on price momentum , making it especially useful in ranging or consolidating markets.
What Is the Stochastic Oscillator?
The Stochastic Oscillator compares the current closing price to the price range (hig
INTC – What Price and Volume Are Telling Us ?INTC - CURRENT PRICE : 37.40 - 37.60
INTC is currently undergoing a controlled pullback within a broader rising structure, as indicated by the rising trendline support (white dashed line). Notably, the recent price decline is accompanied by diminishing volume, which suggests that selling pressure is losing momentum rather than aggressive distribution.
This type of price-down / volume-down behavior typically reflects profit-taking and short-term exhaustion by sellers, often seen during health
Possible Falling Wedge Reversal +90% run – 4H Setup - Worldcoin BINANCE:WLDUSDT could gain 90%
⚙️ Setup
Price has been trending down within a well-defined falling wedge since the local high.
Currently, it’s testing the lower trendline with Stochastics oversold and curving up, suggesting waning bearish momentum.
Volume has compressed, which is typical before a breakout.
We’re now at a decision point: either a bounce and breakout or a confirmed wedge failure.
Stochastics: Oversold (<20) with a possible bullish cross forming.
Volume: Decreasing — co
NASDAQ: PLTR – Strong Trendline & SMA Confluence SupportNASDAQ: PLTR Palantir remains in a clear uptrend with the moving averages aligned (SMA 50 > SMA 100 > SMA 150 > SMA 200). Since April, price has consistently traded above the 50-day SMA, finding support on each pullback to the trendline (green line). This trendline has been tested four times over the past six months, the latest on August 20.
On August 20, PLTR formed a hammer candlestick while testing multiple key supports simultaneously:
1) Horizontal support (red dotted line)
2) Cut Lower B
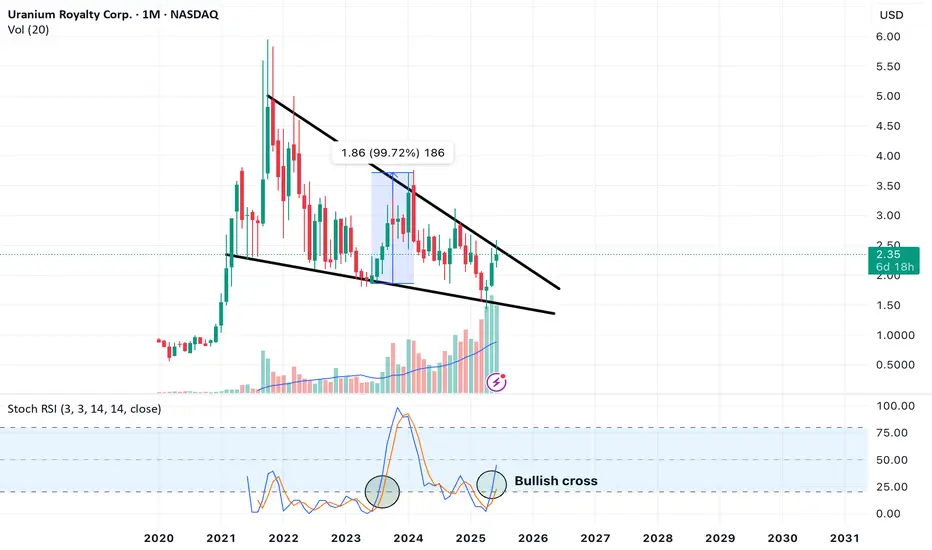
News mentions of Nuclear this & Uranium that, whats the Macro?This is a look into the macro developments happening currently in UROY.
This is strictly a TA look into the big picture. We zoom out to Timeframes bigger than 1W.
At times zooming in to check (3 Day, 5 Day, maybe 1D) for potential swing trades.
I tend to look into things like price action, indicators, volume and other data to sway probabilities of where an asset may go and determine best opportunities of supply and demand zones based on my interpretations.
So jumping right in this is a look in
Is Altseason Around the Corner? BTC.D looks tired AF!BTC dominance just hit the top of a rising wedge that has been building for over a year. Price is stalling at 65.64 percent, sitting right against long-standing resistance.
Momentum is weakening. Stochastic RSI is at 72 and starting to roll over. RSI is sitting just under 70 and showing early signs of fading.
The structure suggests we are close to a decision. If BTC dominance starts to fall from here, the conditions for an altcoin run are in place.
Key levels to the downside are already mappe
DXY, bullish or bearish?Welcome back!
Today i'm posting a small idea on the DXY. Usually i cover crypto but the macro is important. A weak dollar correlates with more risk being taken and a strong dollar with less risk being taken. Hence my analysis of the DXY.
In the above chart a couple of things can be seen which makes the outlook hard to predict.
On one side there is a bullflag on the monthly timeframe with a target of 130!
On the other side, looking under we can see a bearish MACD cross and a bearish stoch RSI.
ETH - On which side will it break-out?Today, the FED will decide on the interest rate in the USA. It is almost certain (99% probability) that the rate will remain unchanged. The most important aspect to focus on in this meeting’s minutes is the FED Balance Sheet. Will they stop tightening the balance sheet this month, or will they wait until mid-year as stated in January?
Leading up to the FOMC meeting, ETH is squeezing within its 4-hour pattern, forming equal highs and higher lows. This suggests a potential breakout to the upside.
AAVE Retests Key Support – Bullish Reversal Ahead?CRYPTOCAP:AAVE is currently retesting a rising support line after breaking through a key resistance zone, which has now turned into support.
This structure suggests that the uptrend remains intact, and the recent dip could be a healthy pullback before a continuation to the upside.
DYOR, NFA
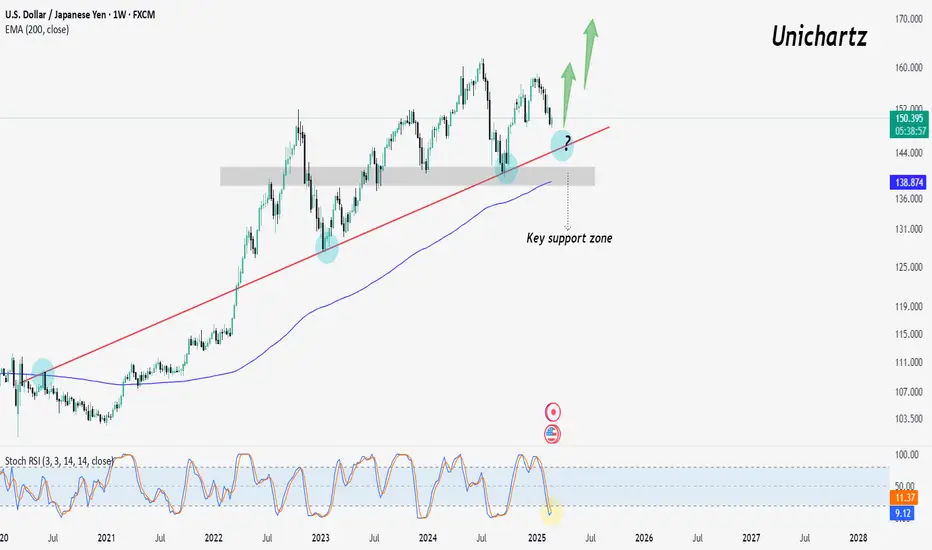
USD/JPY Setup – Buy the Dip or Wait for Confirmation?The USD/JPY pair is testing a long-term trendline support, which has held multiple times in the past, signaling a critical decision point.
The price has bounced off this level before, suggesting strong buyer interest in this zone. Additionally, the Stochastic RSI is oversold, hinting at a potential reversal.
If the price holds above this trendline and key support zone, we could see a bullish continuation toward new highs.
MCHP Long Setup: Oversold Rebound w/ Rising Volatility & VolumeMicrochip Technology (MCHP) is presenting a promising long opportunity for a temporary rebound, supported by three strong technical factors:
Slow Stochastic in Extreme Oversold Territory : The indicator is below 20, signaling excessive selling pressure, often linked to potential short-term recoveries.
Rising Volatility Index (LSVI) : The significant increase in volatility suggests the market is entering a phase of larger price movements, increasing the probability of a sharper rebound.
Inc
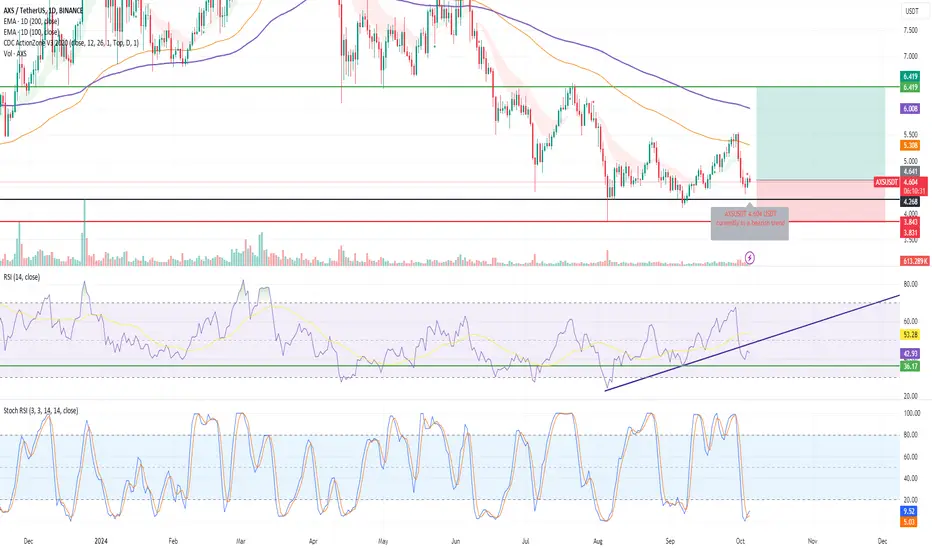
I have bought AXS From the AXSUSDT chart, it shows:
Market Trend: The chart is currently in a clear downtrend along the EMA (Exponential Moving Average) line, with the 100-day EMA and 200-day EMA still above the price chart, indicating strong resistance.
Important Support: The support area around 4.145 USD has been tested several times. If the price breaks this support level, it may see a continued correction to the 3.843 USD and 3.831 USD areas, which were previously rebounded.
Stochastic RSI: It is in the ov
Bullish Alert: Tata Technologies|Strong Swing Trade Potential!📈 Bullish Alert: Tata Technologies Ltd. Shows Strong Swing Trade Potential! 🚀
Stock Analysis Report
Stock Name : Tata Technologies Ltd.
Timeframe: Daily
Current Market Price (CMP) : ₹1068
________________________________________
Trade Type
• Trade Type: Swing Trade
________________________________________
Technical Analysis
1. Trendline Breakout:
The stock has recently broken above a key trendline with increased volume, indicating a strong bullish signal.
Following the breakout,