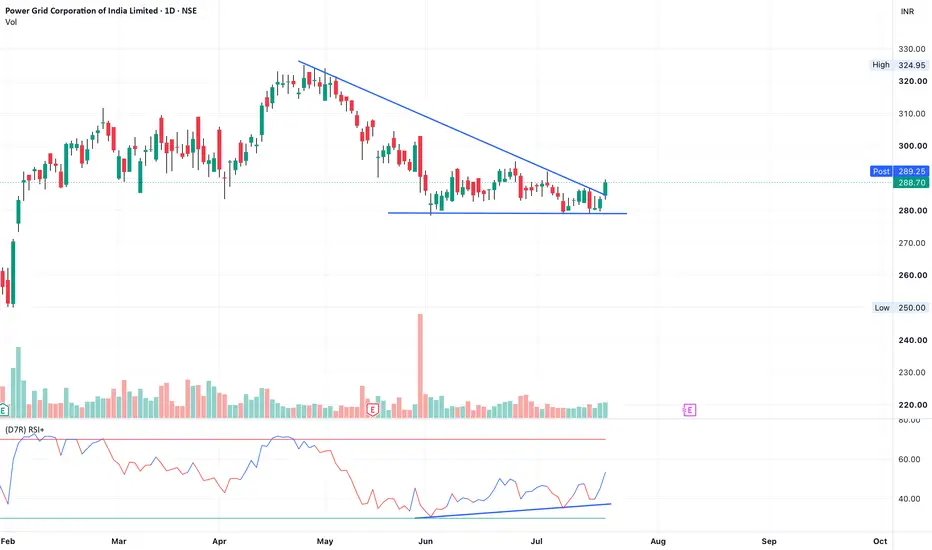
PowerGrid - RSI Bullish DivergencePowergrid has shown up move based on RSI bullish divergence. What this means is, the price was at the same level but the RSI was making higher lows. This is a long setup. Moreover, the price has broken descending triangle.
Note: I am not a registered SEBI member. Hence, please do not consider this as an investment advice. This is just for educational purposes.
Supply and Demand
Bajaj Healthcare: Multi-Year Base Breakout SignalsNSE:BAJAJHCARE
Bajaj Healthcare Ltd. has shown a strong recovery from its long-term support zone around โน260โ280, an area that has been defended multiple times on the weekly chart.
The recent move above the previous swing high has resulted in a clear Break of Structure (BOS), indicating that the stock may be transitioning from a prolonged corrective phase into a new bullish structure.
Key observations:
โข Multi-tested weekly demand zone remains intact.
โข Price has reclaimed the high-volu
BTC ROADMAP FOR COMING WEEKS๐ BTC Update for the week
BTC has been chopping inside this range for quite some time now, exactly as mentioned in my previous updates. The market continues to sweep liquidity on both sides, making it a difficult environment for traders chasing every move.
๐ด Short Plan
As price is currently trading near the range highs, Iโm leaning bearish in the short term.
Iโll be looking for a liquidity sweep above the previous highs around $65.4K, followed by rejection. The $66Kโ$67K region remains my ke
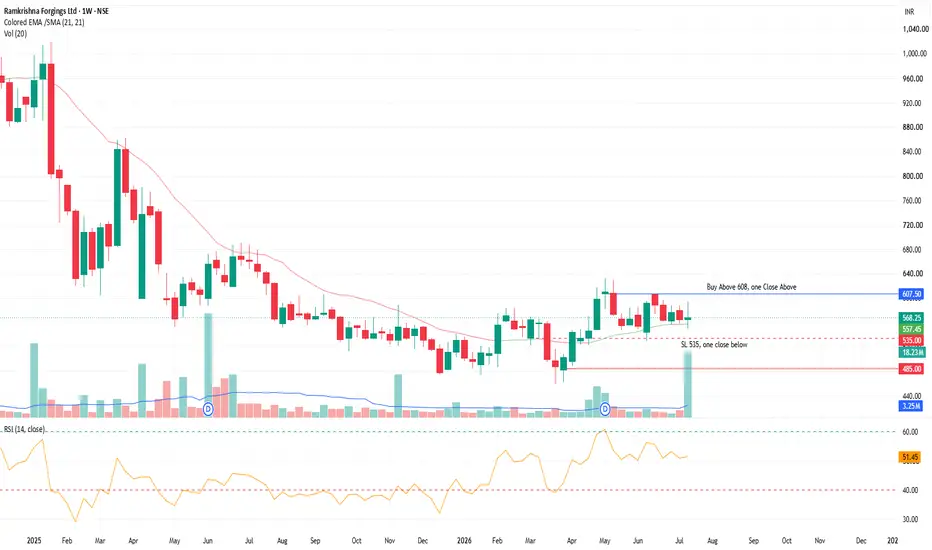
RKFORG: Trend reversal pattern, good volume in weekly candleFew Points observed from last few weeks -
From the last few weeks RKFORG stock is trading in a very narrow range.
In last week good volume build up, gives good signal of trend reversal.
Also, stock trading near 21 SMA.
Good buying opportunity above 608 on one week close, with SL 535 on one close below.
NOTE : This is not investment advise, only for education purpose.
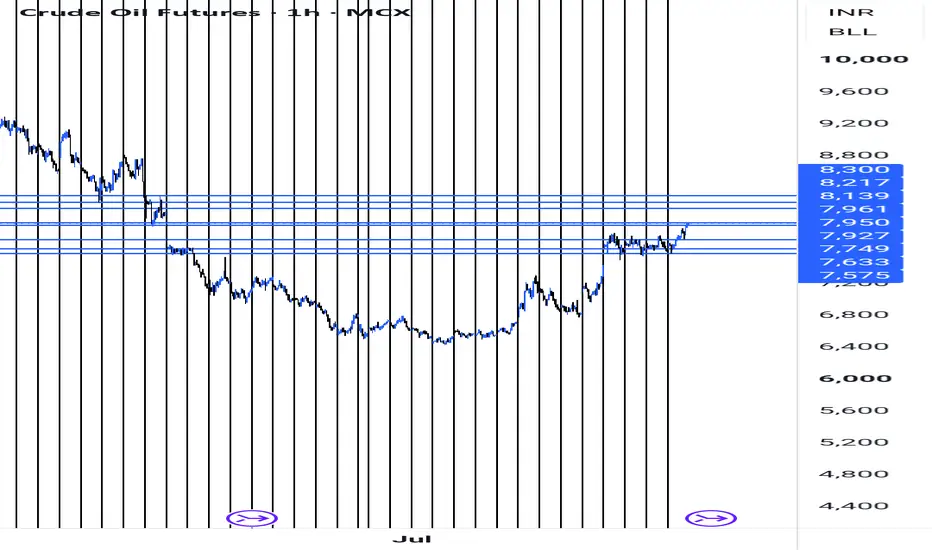
MCX Crude Oil Analysis (20-07-2026)Crude Oil Outlook for Monday
If Crude Oil opens above 7920 on Monday, it can be considered bullish. The first major psychological resistance is 8000, which is very close and could be tested first.
Upside Targets:
- 8000 โ First psychological resistance
- 8150 โ Second target
- 8220 โ Third target
- 8350 โ Fourth target (Possible Top)
The 8350 zone could act as a possible top, and it may be difficult for the price to sustain above this level.
On the other hand, if Crude Oil opens below 7920
RELIANCE 1D Bearish Confirmation After Short Term Bullish RunThe move higher was helped by optimism around the proposed Jio Platforms IPO, which could unlock value for Reliance shareholders, alongside expectations around its AI, new-energy and digital businesses. More recently, Reliance also reported stronger than expected quarterly results, with strength in its O2C and Jio businesses.
But despite the fundamental strength and the recent rally, my technical bias is still bearish on the higher timeframe.
Reliance has been in a broader downtrend after r
JIOFIN: Tight Consolidation Near Monthly DemandNSE:JIOFIN
Jio Financial Services has been consolidating for several months after a healthy correction from its previous swing high. Rather than showing aggressive distribution, the decline has been accompanied by relatively lower selling pressure, suggesting a phase of absorption near an important higher-timeframe demand zone.
Price is currently trading inside a well-defined consolidation while respecting the Monthly Demand Zone, with a descending trendline acting as dynamic resistance. Su
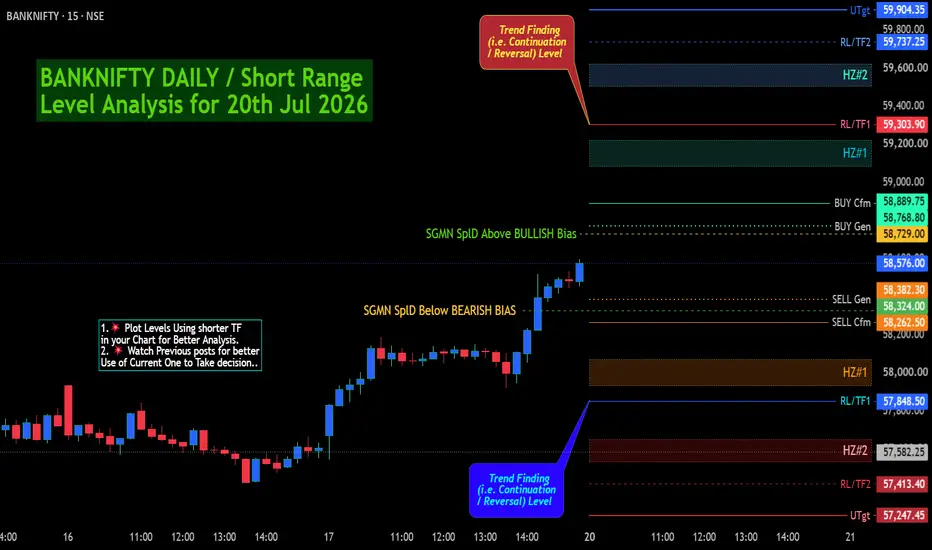
BANKNIFTY DAILY / Short Range Level Analysis for 20th Jul 2026BANKNIFTY DAILY / Short Range Level Analysis for 20th Jul 2026
๐ SGMN SplD BULLISH Above => 58729.
๐ SGMN SplD Bearish BELOW => 58324.
Mentioned analysis based on 2 consecutive candle close in 15 min Time Frame.
โโโโโ๐ฅ๐ง๐จ๐ฉ๐ฆ๐ชโฌโโโโโ
๐ฅLevel Interpretation / description:
โ๐ปL#1: If the candle crossed & stays above the โBuy Genโ, it is treated / considered as Bullish bias. Cfm=> Confirmation.
L#2: Possibility / Probability of REVERSAL near ๐RL/TF1 & ๐RL/TF2
L#3: If the candle stays above โS
BANKNIFTY WEEKLY / POSITIONAL Level Analysis: 20th-24th Jul 2026๐ SGMN SplWP BULLISH Above => 59257.
๐ SGMN SplWP Bearish BELOW => 57686.
Mentioned analysis based on 2 consecutive candle close in 15 min Time Frame.
โโโโโ๐ฅ๐ง๐จ๐ฉ๐ฆ๐ชโฌโโโโโ
๐ฅLevel Interpretation / description:
โ๐ปL#1: If the candle crossed & stays above the โBuy Genโ, it is treated / considered as Bullish bias. Cfm=> Confirmation.
L#2: Possibility / Probability of REVERSAL near ๐RL/TF1 & ๐RL/TF2
L#3: If the candle stays above โSell Genโ but below โBuy Genโ, it is treated / considered as
NIFTY DAILY / Short Range Level Analysis for 20th Jul 2026.๐ SGMN SplD BULLISH Above => 24413
๐ SGMN SplD Bearish BELOW => 24287.
Mentioned analysis based on 2 consecutive candle close in 15 min Time Frame.
โโโโโ๐ฅ๐ง๐จ๐ฉ๐ฆ๐ชโฌโโโโโ
๐ฅLevel Interpretation / description:
โ๐ปL#1: If the candle crossed & stays above the โBuy Genโ, it is treated / considered as Bullish bias. Cfm=> Confirmation.
L#2: Possibility / Probability of REVERSAL near ๐RL/TF1 & ๐RL/TF2
L#3: If the candle stays above โSell Genโ but below โBuy Genโ, it is treated / considered as Si
NIFTY WEEKLY / POSITIONAL Level Analysis: 20th-24th Jul 2026.๐ SGMN SplD BULLISH Above => 24570.
๐ SGMN SplD Bearish BELOW => 24109.
Mentioned analysis based on 2 consecutive candle close in 15 min Time Frame.
โโโโโ๐ฅ๐ง๐จ๐ฉ๐ฆ๐ชโฌโโโโโ
๐ฅLevel Interpretation / description:
โ๐ปL#1: If the candle crossed & stays above the โBuy Genโ, it is treated / considered as Bullish bias. Cfm=> Confirmation.
L#2: Possibility / Probability of REVERSAL near ๐RL/TF1 & ๐RL/TF2
L#3: If the candle stays above โSell Genโ but below โBuy Genโ, it is treated / considered as S
Investing:Nifty IT is looking good for long term accumulation!If you have been following the tech related news lately, it has been about the new AI "revolutionary" tool named Anthropic.
And the same is visible on charts of Nifty IT.
TCS is available at a price at which it was trading in December 2020.
Infy has just broke a crucial support.
Wipro has always been the weakest of 3.
So what next?
My opinion is that the fall is now almost in the end stage. The accumulation has already started on Friday as we have seen some good recovery by end of the day.
Gland Pharma - Has the race to the ATH started?Gland Pharma has given a good strong weekly breakout of a supply zone and currently consolidating above the breakout zone.
As you can see, the stock has clearly formed a beautiful VCP pattern.
Key levels to watch are mentioned on the chart.
A weekly closing above 2600 will be a strong confirmation of strength of buyers.
I had previously posted ideas (check similar ideas links) of Divis Lab & Laurus Labs. They had similar pattern visible on chart and they later went on to make a new ATH .
So, c
Is it the time for CDSL consolidation breakout?CDSL has been consolidating in a descending triangle pattern since last 1.5 years.
Stock is looking ripe for a breakout now as volumes have started to rise.
This stock is driven mostly by the how the money flow happens in capital markets. If the inflow in Nifty starts in next few months, we might see a new ATH in this stock as well.
Let's see whether the breakout sustains or fails. Only time can tell.
Stock is expensive at current valuation which should also be considered.
This idea is not a re
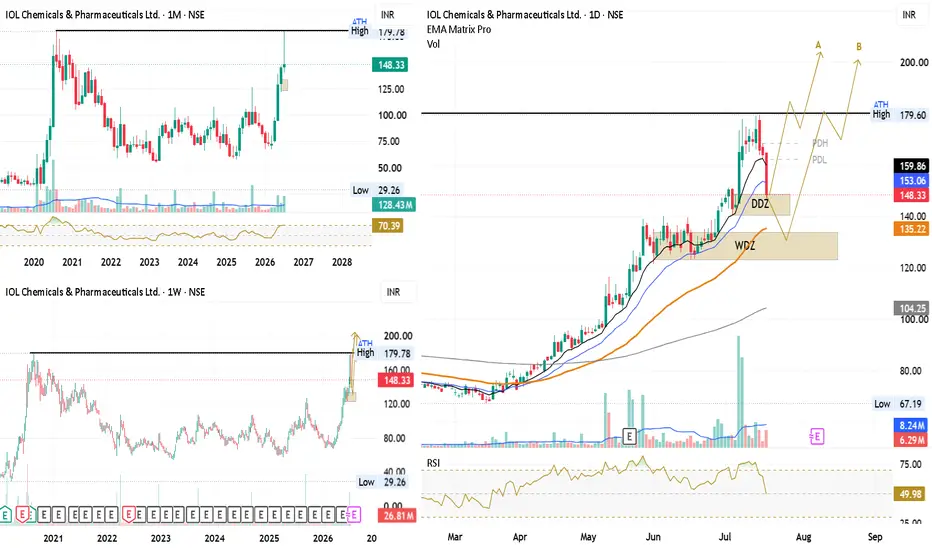
IOLCP : Multi Timeframe Analysis NSE:IOLCP
After a strong bullish rally following a long-term base breakout, price faced rejection near its all-time high, where historical supply emerged and triggered a healthy pullback. Notably, the decline has occurred without aggressive selling volume, suggesting profit booking rather than broad-based distribution.
The focus now shifts to the identified Daily Demand Zone ( DDZ ), followed by the Weekly Demand Zone ( WDZ ) if the correction extends. My preferred approach is to wait for p
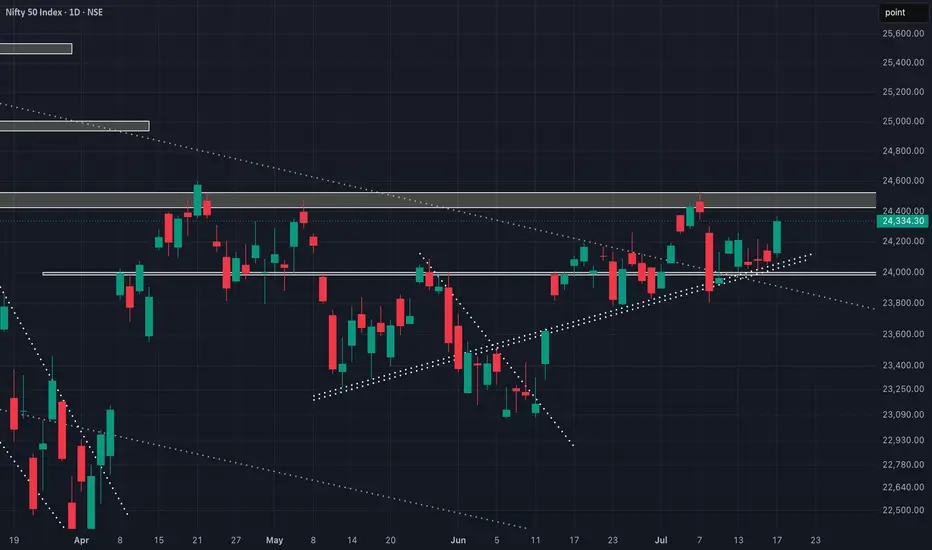
NIFTY still in a range!! NOT YET CONFIRMED!As we can see NIFTY is still in the range despite the strong upmove. Going by our analysis we can still see NIFTY has not broke the important supply zone and psychological level of 24500, which could hinder NIFTY from continuing its bullishness. Hence we can expect NIFTY to remain sideways and bulllishness will only be confirmed if NIFTY manages to close above the mentioned supply zone. So, plan your trades accordingly and keep watching everyone.
Nifty Intraday Analysis for 17th July 2026NSE:NIFTY
Index is near 24000 support and if it could not sustain then -
The downward moment may drag the Index to 23850 โ 23800 support range in downward momentum and if this support is broken then index may tank near 23600 โ 23550 range.
On the contrary, The upward movement may lead to 24300 โ 24350 resistance range and if the index crosses and sustains above this level then may reach near 24550 โ 24600 range.
Banknifty Intraday Analysis for 17th July 2026NSE:BANKNIFTY
Index is near 57250 support and if it could not sustain then -
The downward moment may drag the Index to 56900 โ 56800 support range in downward momentum and if this support is broken then the index may tank near the 56100 โ 56000 range.
On the contrary, The upward moment may lead the Index to 58300 โ 58400 resistance range in upward momentum and if the index crosses and sustains above this level then may reach near 59100 โ 59200 range.
Finnifty Intraday Analysis for 17th July 2026NSE:CNXFINANCE
Index is near 26450 support and if it could not sustain then -
The downward moment may drag the to 26300 โ 26200 support range and if this support too is broken then index may tank near 26000 โ 25950 range.
On the contrary, The upward movement may lead the Index to 26800 - 26900 resistance range and if the index crosses and sustains above this level then may reach near 27100 - 27200 range.
Midnifty Intraday Analysis for 17th July 2026NSE:NIFTY_MID_SELECT
Reversal at higher level expected and uptrend will be confirmed if Index breaks and sustains above 15000 resistance.
The upward movement may lead the Index near 14950 โ 14975 resistance range and if the index crosses and sustains above this level then may reach 15125 โ 15150 range.
On the contrary, The downward moment may drag the index to 14650 โ 14625 support range and if this support is broken then index may tank near 14475 โ 14450 range.
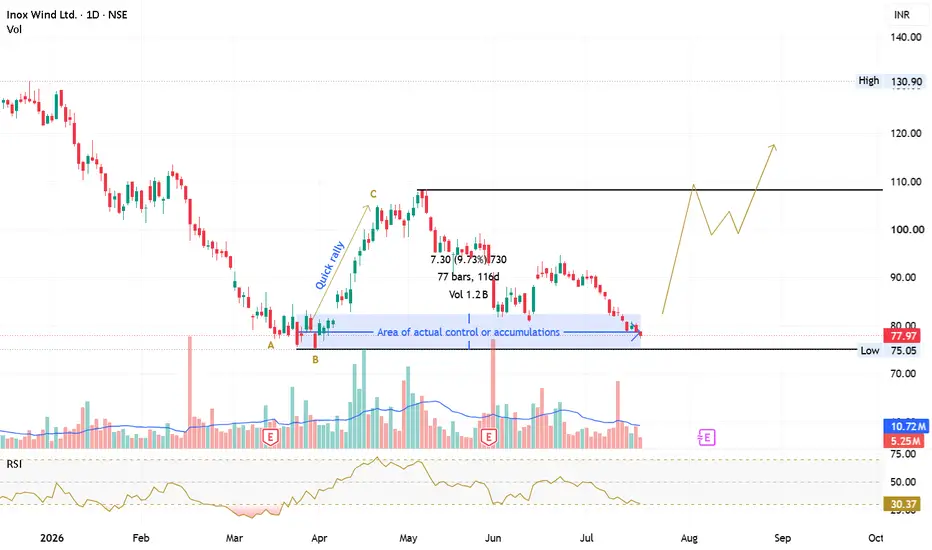
INOXWIND : Developing an Observational PerspectiveNSE:INOXWIND
Inox Wind Ltd. is one of India's leading wind energy solutions providers, engaged in manufacturing wind turbine generators while offering end-to-end services including project development, EPC, commissioning, operations, and maintenance. Backed by the INOXGFL Group, the company continues to benefit from India's growing renewable energy transition, supported by an improving order pipeline and execution capabilities.
----------------------------------------------------------------
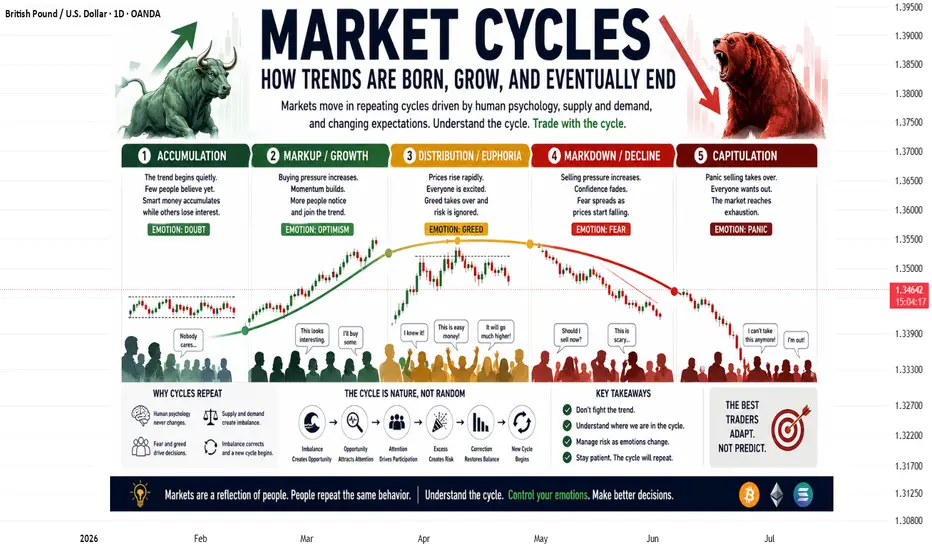
Market Cycles:Every trader has experienced it.
A market that seemed unstoppable suddenly loses momentum.
A long downtrend unexpectedly turns into a powerful rally.
News outlets search for explanations after the move has already happened, while traders wonder how the trend changed so quickly.
The truth is that markets rarely move in a straight line forever.
They evolve through cycles.
Every bull market, every bear market, and every period of consolidation is part of a repeating process driven by human be
BECTORFOOD: Demand Zone Reversal | Positional Upside Towards 263BECTORFOOD is showing signs of a strong reversal after a prolonged correction, with price currently trading near a key multi-year demand zone.
Entry Zone: 170โ173
Why I'm Bullish:
โ Strong demand zone at โน175โโน200 with multiple successful retests
โ Price finding support near long-term trendline confluence
โ Higher-low structure indicating weakening selling pressure
โ Signs of accumulation near the lows
โ Favorable risk-reward for positional investors
Targets:
๐ฏ โน202 โ โน219 โ โน237 โ โน26