H1 Major Supply Rejection Toward Lower Liquidity
XAUUSD is trading around 4,378 after extending its recovery from the lower H1 structure. Price has returned directly into the 4,385–4,405 Major Supply Zone, where the broader bearish trendline also remains relevant.
Gold reached a one-week high on Friday as easing crude oil prices reduced part of the inflation pressure that had dominated markets earlier in the week. Spot gold climbed about 1.2%, while softer energy prices helped Treasury yields retreat from their recent highs.
However, the broader macro backdrop remains restrictive. The Fed has raised rates to 3.75%–4.00% and still expects further tightening, while markets currently price roughly a 55% probability of another hike in October. The dollar also remains near a seven-week high, and the U.S. 10-year yield has recently traded above 5%, limiting the strength of gold’s recovery.
Technical View
The H1 recovery has improved after the recent MSS and rebound from lower demand, but price is now entering the main decision area.
The 4,385–4,405 Major Supply Zone aligns with the previous bearish trendline and recent swing structure. This makes the current area less attractive for chasing longs.
A rejection or failed acceptance above this supply could trigger a corrective move back toward the 4,335–4,350 Demand Zone.
If that demand fails to absorb selling pressure, the larger downside objective sits around 4,270–4,290, where the marked downside target and previous liquidity structure align.
Below that, the 4,235–4,250 Major Demand / SSL Zone remains the deeper structural support.
Key Zones
Current Price: 4,378.385
Major Supply / Sell Area: 4,385–4,405
Demand Zone: 4,335–4,350
Downside Target: 4,270–4,290
Major Demand / SSL: 4,235–4,250
Bearish invalidation: sustained H1 acceptance above 4,410–4,420
Trading Plan
Sell Priority: 4,385–4,405
Condition: wait for price to retest Major Supply and show bearish rejection, liquidity sweep, failed acceptance or lower-high confirmation.
TP1: 4,335–4,350
TP2: 4,270–4,290
TP3: 4,235–4,250
Invalidation: sustained H1 acceptance above 4,420.
Sell View
The cleaner approach is to avoid selling aggressively below current price after the recent recovery.
I prefer to let gold test 4,385–4,405 first. If sellers clearly defend the zone, the risk/reward improves for a rotation back toward demand.
A clean H1 breakout and acceptance above 4,420 would weaken the immediate bearish scenario and require reassessment.
Important Note
Lower oil prices are helping gold recover in the short term, but the Fed’s renewed tightening cycle, a strong dollar and elevated Treasury yields remain important headwinds. This creates a two-sided environment where liquidity sweeps around resistance may be aggressive.
Final View
Gold has recovered strongly, but H1 is now testing a key supply area rather than trading from clean demand.
The main scenario is a retest and rejection from 4,385–4,405, followed by a move toward 4,335–4,350 first and potentially 4,270–4,290 if bearish momentum expands.
Will H1 Major Supply stop the recovery before gold rotates back toward lower liquidity?  Short
Short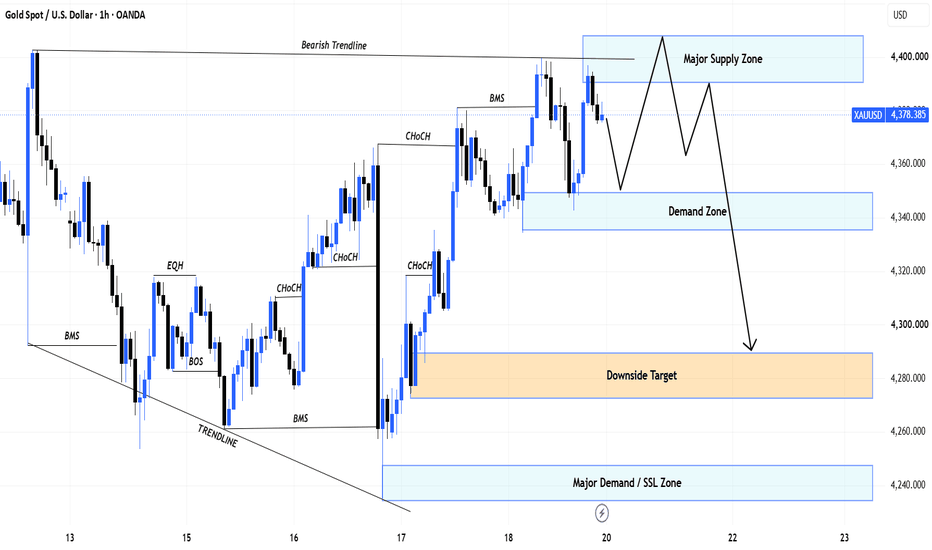
H1 Bearish Retest From Major Supply
XAUUSD is trading around 4,366 after the latest recovery stalled beneath the 4,390–4,410 Major Supply Zone. H1 structure has improved through the recent MSS and BOS, but price is still trading underneath the broader bearish trendline and a major resistance cluster.
The macro backdrop also remains challenging for gold. The Fed raised the federal funds target range by 25 bp to 3.75%–4.00% on September 16 and said inflation remains elevated. On Monday, gold eased toward $4,370, while the U.S. 2-year Treasury yield moved around 4.76% as markets continued to digest hawkish Fed guidance. Minneapolis Fed President Neel Kashkari also said inflation remains too high and supported the latest rate increase, reinforcing expectations that policy could stay restrictive.
Technical View
The H1 chart shows a strong recovery from the 4,260 area, followed by MSS and BOS as buyers regained short-term control.
However, the rally has now reached a more important structural obstacle. The 4,390–4,410 Major Supply Zone overlaps with the descending bearish trendline and previous swing liquidity.
Price is currently pulling back toward the 4,335–4,355 Demand Zone. This zone could generate another short-term recovery, but from Mason’s view, that rebound would be more interesting as a potential retest into major supply rather than a place to chase longs.
If sellers defend the upper zone, the next meaningful downside objective sits around 4,280–4,300.
Below that, the deeper 4,235–4,250 Key Support / Demand Zone remains the larger liquidity area.
Key Zones
Current Price: 4,365.750
Major Supply / Sell Zone: 4,390–4,410
H1 Demand: 4,335–4,355
Next Downside Target: 4,280–4,300
Key Support / Demand: 4,235–4,250
Trading Plan
Sell Priority: 4,390–4,410
Condition: wait for price to retest Major Supply and show bearish rejection, liquidity sweep, lower-high formation or bearish MSS confirmation.
TP1: 4,335–4,355
TP2: 4,280–4,300
TP3: 4,235–4,250
Invalidation: sustained H1 acceptance above 4,410–4,420.
Sell View
The cleaner setup is not to chase shorts around current price while H1 demand remains directly underneath.
A rebound from 4,335–4,355 into 4,390–4,410 would provide a better location to evaluate seller strength.
The bearish idea only becomes attractive after confirmation from the upper supply zone.
Important Note
Oil prices eased slightly at the start of the week as Saudi export flows recovered, which may temporarily reduce inflation pressure. However, elevated short-term U.S. yields and the Fed’s restrictive stance remain key headwinds for gold.
Final View
Gold has recovered strongly, but H1 is now approaching a major technical decision area.
The main scenario is a retest into 4,390–4,410 followed by confirmed bearish rejection, targeting 4,335–4,355 first and then 4,280–4,300 if downside momentum expands.
Can sellers defend Major Supply and rotate gold back toward lower liquidity? Short 
H2 Bullish Reclaim Toward Major Supply
XAUUSD is trading around 4,413 after recovering from the recent 4,350 area and compressing between the descending resistance trendline and rising short-term support. Price is now approaching the first resistance zone, making the next reclaim especially important.
Gold gained more than 1% on Wednesday as the U.S. dollar remained soft, while escalating Middle East tensions pushed Brent above $100. However, the U.S. 10-year Treasury yield climbed toward 4.84%, and markets are pricing roughly a 60% probability of a Fed hike next week, keeping the macro backdrop highly sensitive to inflation data.
The next catalysts are U.S. PPI today, September 10, at 8:30 a.m. ET, followed by CPI on September 11 at 8:30 a.m. ET. Both releases could materially shift Fed expectations and create sharp volatility in XAUUSD.
Technical View
The broader structure remains below the descending resistance line, but short-term price action is showing signs of recovery.
The immediate decision area is 4,415–4,445 Resistance. A clean reclaim and successful retest of this zone would strengthen the bullish structure and support continuation toward the next supply.
The first major upside objective sits around 4,490–4,515 Supply Zone.
If buyers maintain momentum above that area, the larger target becomes the 4,600–4,635 Major Resistance / Supply Zone.
Below current price, the 4,285–4,310 Demand Zone / Strong Support remains the major structural support on the chart.
Key Zones
Current Price: 4,412.820
Resistance / Reclaim: 4,415–4,445
Supply Zone: 4,490–4,515
Major Resistance / Supply: 4,600–4,635
Major Demand / Strong Support: 4,285–4,310
Trading Plan
Buy Priority: confirmed reclaim of 4,415–4,445
Condition: wait for price to break above resistance and confirm the zone as support through a retest, bullish rejection or higher-low formation.
TP1: 4,490–4,515
TP2: 4,600–4,635
Invalidation: failure to hold the reclaimed resistance structure would weaken the immediate bullish continuation setup.
Important Note
PPI and CPI are the main short-term risks. With oil above $100 and Treasury yields elevated, hotter inflation could quickly strengthen Fed-hike expectations and pressure gold.
Avoid chasing a breakout during the first reaction to the data. Confirmation after the liquidity sweep remains more important than the initial candle.
Buy View
The preferred scenario is not to buy directly below resistance.
A confirmed breakout above 4,415–4,445, followed by a controlled retest, would provide the cleaner bullish setup. If buyers establish acceptance above this area, 4,490–4,515 becomes the next liquidity objective.
Final View
Gold is attempting to transition from consolidation into a stronger recovery phase, but 4,415–4,445 remains the key gate.
The main scenario is a bullish reclaim and retest of resistance, followed by expansion toward 4,490–4,515 and potentially 4,600–4,635.
Can gold reclaim 4,445 before PPI and CPI trigger the next major expansion? Long 
NIFTY 50 Index 15M Technical Analysis – Aug 18, 2026The chart shows the Nifty 50 Index on a 15-minute timeframe, currently trading around 24,225.75. Price has experienced a sharp downward move after failing to sustain higher levels, driving directly into your purple Point of Interest (POI) zone at 24,223–24,207. A clean break below this POI will confirm continuation for your short setup toward lower support targets.
Overhead resistance zones and lines (red) are stacked above at 24,274–24,254, 24,306.45, 24,329.00, 24,357–24,343, and 24,427–24,423. Downside targets (green) line up directly below the POI starting at 24,192.35 and 24,172.35, leading down to the primary lower demand zone at 24,142–24,119.  Short
Short
 Short
Short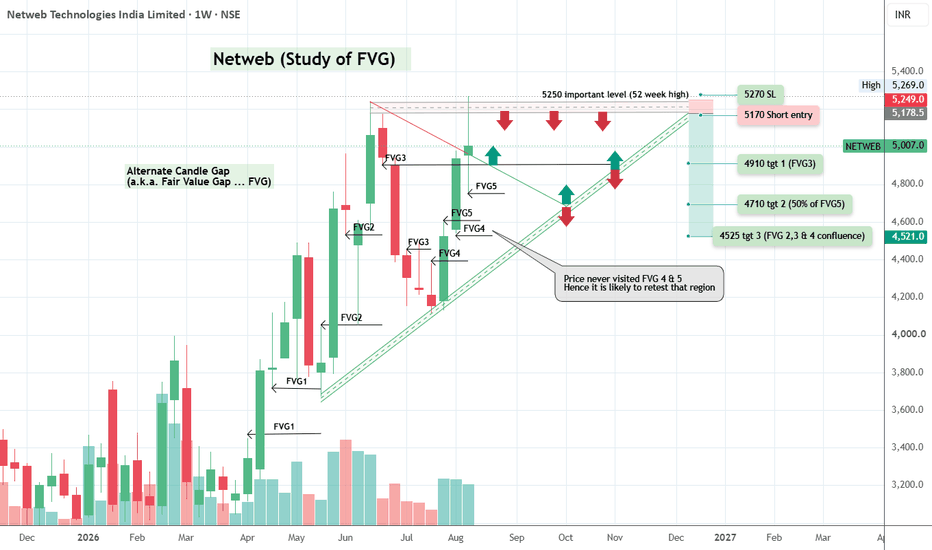
OBEROIRLTY: Supply Worked Perfectly.. Now All Eyes Are on Demand📈 Institutional Zones in Action
Oberoi Realty recently respected a higher supply zone almost perfectly, where fresh selling pressure emerged and pushed the stock lower. This is a textbook example of the Supply & Demand concept, where price moved from an institutional selling zone directly toward an institutional buying zone.
The stock has now reached a high-quality daily demand zone formed after a powerful trend reversal. The zone is backed by a strong leg-out, excellent follow-through, and a breakout that confirmed buyers had taken control. Such explosive departures often indicate institutional participation, leaving behind unfilled buy orders that may still be waiting.
Adding another layer of confidence, this demand zone also coincides with a previous resistance level that is now expected to act as support based on the principle of polarity.
🎯 Trading Plan
The current demand zone offers an attractive buying area from a risk management perspective.
• Entry is considered inside the highlighted demand zone.
• Stop loss is placed below the demand zone, where the buying thesis becomes invalid.
• The initial objective offers approximately a 1:3 risk-to-reward ratio , providing a favourable reward relative to the defined risk.
This setup allows traders to keep risk controlled while participating from a location where institutional demand has previously dominated.
💡 Final Thoughts 🌟
The best setups are not just about finding a demand zone—they're about finding multiple reasons for buyers to step in. Here we have a respected supply zone triggering the correction, a premium trend-changing demand zone, polarity support, and a well-defined risk-to-reward structure. Now it's up to price action to reveal whether institutions defend this area once again.
⚠️ No trading setup is guaranteed. Always manage your risk, place your stop loss before thinking about your target, and never risk more than you can afford to lose.
📚 This analysis is shared purely for educational purposes and should not be considered investment or trading advice. I am not a SEBI-registered Research Analyst.
🚀 "Professional traders don't chase price—they wait for price to come back to quality." 📈
Thank you for your support, your likes & comments. Feel free to ask if you have questions.
 Long
Long
 Long
Long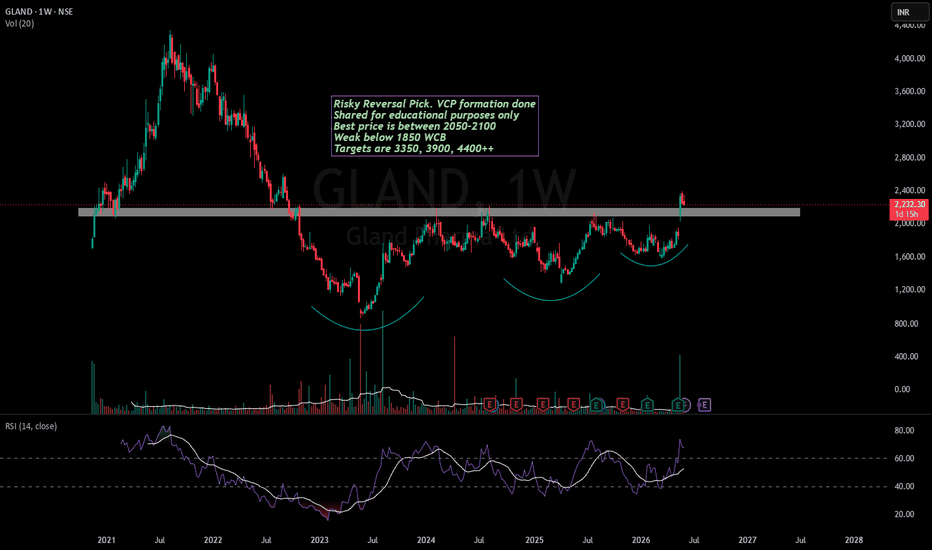
USDCHF the break is over, rally to continue ?? After making the high of 0.8130 on 24th June, which was preceded by the structural shift of the price form bearish to bullish which got confirmed after the breakout of 0.8042 level, price took most required correction & has retested the strong bullish support level of 0.8011, following to which price had started to make HH & HL formation and now has reached a breakout level denoted by a horizontal neckline at 0.8074, if price breaks above it we can take fresh long entries on USDCHF.
Price is expected to show sustained up-move, hence it's suitable for making positional bets, we see a good Up-side for short to midterm time period (Kindly Check the additional resources for the reference).
Immediate support is at 0.8054 and immediate resistance is at 0.8097
Summary: Only long Trades should be preferred, It's an opportunity to take positions before price continues in its expected direction. however waiting for the breakout of 0.8074 could be a good idea for fresh entries.
For Educational Purposes only, Not an Investment Advice, Always use strict Risk management measures.
Regards CrazyTrades247.
NIFTY: Trendline Breakout Meets Demand Zone – Bigger Move Ahead?🌍 The Bigger Picture Favors the Buyers 🌍
At first glance, NIFTY may appear to be moving sideways, but a closer look reveals an interesting story developing beneath the surface.
The most important area on this chart is the Weekly Demand Zone . This higher timeframe demand area has already demonstrated its strength by attracting buyers and preventing further downside. Recently, price revisited this zone and immediately found support, suggesting that institutional demand may still be active.
Higher timeframe zones often carry greater significance because they reflect decisions made by larger market participants. As long as this Weekly Demand Zone remains intact, the broader structure remains constructive.
📈 Daily Demand Emerging Inside Weekly Demand 📈
One of the strongest observations on this chart is the formation of a Daily Demand Zone within the larger Weekly Demand Zone.
This creates a powerful alignment between timeframes.
When a Daily Demand Zone forms inside an active Weekly Demand Zone, it often indicates that buyers are becoming active at multiple levels of the market.
The recent rally originated from this Daily Demand Zone, showing that buyers were willing to step in before price could move deeper into the Weekly Demand area.
This is exactly the type of behavior bulls want to see.
🔥 The Trendline Breakout Changes the Story 🔥
For several months, NIFTY remained under pressure from a falling trendline that guided the correction lower.
That situation has now changed.
Price has successfully broken above the descending trendline, which suggests that bearish momentum is weakening and market character may be shifting.
More importantly, after the breakout, price did not collapse back below the trendline. Instead, it has been consolidating above it.
This is often a healthier sign than a breakout followed by immediate rejection.
The Role of the Daily Supply Zone
The next important area on the chart is the Daily Supply Zone overhead.
This zone has already been tested previously, making it a key battleground between buyers and sellers.
Many traders focus only on the existence of supply, but the more interesting observation is that price continues to challenge this area after bouncing from demand.
Buyers defended the Daily Demand Zone.
Price broke the falling trendline.
The market recovered from the Weekly Demand Zone.
Price is now holding near Daily Supply instead of getting aggressively rejected.
This behavior can sometimes indicate that selling pressure is gradually being absorbed.
🎯 What the Price Action Is Telling Us 🎯
The current structure is no longer showing the characteristics of a strong downtrend.
Instead, the market appears to be transitioning into a phase of consolidation after a successful bounce from higher timeframe demand.
Weekly Demand Zone remains respected.
Daily Demand Zone successfully generated a rally.
Falling trendline has been broken.
Price is consolidating near Daily Supply.
Sellers have not regained complete control.
This doesn't guarantee a bullish move, but it does suggest that the market is in a much stronger position than it was during the decline.
🚦 What Traders Should Watch Next 🚦
Bullish Scenario
Daily Demand continues to hold.
Buyers maintain control above the broken trendline.
Daily Supply gets absorbed.
Momentum expands toward higher supply zones.
Bearish Scenario
Daily Supply produces a strong rejection.
Price falls back below the breakout area.
Daily Demand fails to attract buyers.
Market revisits deeper portions of the Weekly Demand Zone.
💡 Final Thoughts 💡
The most compelling aspect of this chart is not the Daily Supply Zone overhead, but the confluence between the Daily Demand Zone and the Weekly Demand Zone below.
This alignment, combined with the successful breakout above the falling trendline, suggests that buyers have started to regain control after months of corrective price action.
While the Daily Supply Zone remains an important obstacle, the overall structure appears healthier than many traders may initially assume.
The next major clue will come from how price behaves around this Daily Supply Zone. A successful breakout could significantly strengthen the bullish case, while a rejection would likely extend the current consolidation phase.
Great traders don't wait for certainty—they wait for confirmation. 📈🚀
This analysis is for educational purposes only and should not be considered financial, trading, or investment advice. I am not a SEBI registered analyst.
Thank you for your support, your likes & comments. Feel free to ask if you have questions. 📊
Breakout or Bull Trap? Auro Pharma at Major Supply Zone!Price is looking strong, momentum is building, and to most traders… this feels like a clean breakout. But if you shift your lens to a supply and demand perspective, the story changes completely. What looks like strength might actually be distribution.
📊 Multi-Timeframe Story – The Real Edge
When we analyze across timeframes, clarity improves dramatically.
• Monthly Timeframe : Price has reached a major supply zone where strong selling previously happened. This is not a random level — this is where institutions were active in the past.
• Weekly Timeframe : The current move has pushed price directly into a well-defined weekly supply zone nested inside the monthly supply. This alignment increases the probability of reaction.
• Daily Timeframe : On the daily chart, price is approaching supply while showing bullish momentum — exactly the kind of move that attracts retail breakout traders.
This is what we call “stacked supply” — multiple timeframes pointing toward the same area.
⚠️ Why This “Breakout” Can Be a Trap
At first glance, the structure looks like a breakout setup. Higher highs, strong candles, bullish sentiment — everything retail traders love.
But here’s the catch:
• Location matters more than pattern : Buying into higher timeframe supply is risky, no matter how strong the breakout looks.
• Institutional logic : Big players don’t buy high — they sell into strength. This rally provides liquidity for them to exit positions.
• Retail psychology :
• Retail sees breakout → they buy
• Smart money sees supply → they sell
• Absorption possibility : Price may briefly push higher (fake breakout) to trigger breakout buyers before reversing sharply.
This is a classic liquidity grab scenario .
🧠 Understanding the Smart Money Perspective
Institutions operate differently from retail traders:
• They need liquidity to execute large orders
• They prefer selling when buyers are active
• Strong bullish candles near supply often indicate distribution, not accumulation
📌 Important Insight – Profit Booking Zone
This area is not just a potential reversal zone — it is also a logical place for profit booking.
• If you are already holding long positions from lower levels, this is a high-probability area where institutions may start exiting
• Booking profits here is a smart and disciplined approach rather than getting trapped in greed
• Fresh buying at this level carries lower reward and higher risk due to overhead supply
📉 What Can Happen Next?
Based on supply and demand principles, a few scenarios can unfold:
• Price reacts from supply and starts a pullback
• A fake breakout above supply traps buyers before reversal
• Consolidation near supply before a directional move
The key idea: Upside may be limited due to strong overhead supply pressure
📌 Key Takeaways
• Multi-timeframe supply alignment increases probability of reaction
• Breakouts into supply are often traps
• This zone can act as a profit booking area for existing buyers
• Always prioritize location over momentum
• Smart money sells into strength, not weakness
💡 Trading Wisdom
“Discipline in booking profits is what separates traders from gamblers.” 📊
⚠️ If you're considering any trade based on this structure, remember: no setup is 100% guaranteed. Risk management is your strongest edge. Always protect your capital before chasing profits.
📚 This analysis is for educational purposes only and not intended as trading or investment advice. I am not a SEBI registered analyst.
Global Supply Chain Shifts: Navigating a Transforming World1. Historical Context of Global Supply Chains
Global supply chains have historically evolved to optimize efficiency, minimize costs, and leverage comparative advantages. Since the late 20th century, globalization allowed companies to source raw materials, manufacture components, and distribute finished products across continents. The “just-in-time” (JIT) model became dominant, emphasizing minimal inventory and rapid delivery to reduce costs. Regions like East Asia, particularly China, emerged as manufacturing hubs, supplying goods to developed markets in North America and Europe. While efficient, this system was vulnerable to disruptions, as seen during natural disasters, trade disputes, and the COVID-19 pandemic.
2. Drivers of Recent Supply Chain Shifts
Several key forces are reshaping global supply chains:
2.1 Geopolitical Tensions
Trade wars, sanctions, and regional conflicts have prompted companies to reassess reliance on single countries or regions. For example, tensions between the United States and China led to tariff impositions on electronics, textiles, and machinery, encouraging firms to diversify suppliers. Companies now explore multi-country sourcing strategies to mitigate the risk of political volatility.
2.2 The COVID-19 Pandemic
The COVID-19 pandemic highlighted vulnerabilities in global supply chains. Factory shutdowns, port congestion, and logistics disruptions caused shortages in semiconductors, medical supplies, and consumer goods. Firms realized that hyper-efficient supply chains lacked resilience. Consequently, many are increasing buffer stocks, localizing production, or nearshoring operations closer to end markets to reduce dependency on distant suppliers.
2.3 Technological Advancements
Emerging technologies are fundamentally transforming supply chain operations. Automation, robotics, and the Internet of Things (IoT) enhance operational efficiency, accuracy, and speed. Artificial intelligence (AI) and advanced analytics allow real-time monitoring, predictive maintenance, and demand forecasting, reducing risks of overstocking or stockouts. Blockchain technology improves transparency and traceability, addressing concerns about counterfeiting and ethical sourcing.
2.4 Environmental and Sustainability Pressures
Climate change, resource scarcity, and regulatory pressures have forced companies to rethink supply chain design. Organizations increasingly consider carbon footprints, waste reduction, and sustainable sourcing. Green logistics practices, such as using electric vehicles, optimizing shipping routes, and adopting circular economy principles, are becoming integral. Governments and consumers are demanding greater accountability, pushing companies to prioritize environmentally friendly practices.
2.5 Consumer Behavior and Market Expectations
Consumers now expect rapid delivery, customization, and transparency. The rise of e-commerce giants like Amazon has accelerated the need for agile supply chains capable of handling small-batch, high-frequency deliveries. Direct-to-consumer models challenge traditional distribution methods, necessitating flexible warehousing, smart inventory systems, and responsive logistics networks.
3. Strategic Responses to Supply Chain Shifts
In response to these pressures, businesses are rethinking supply chain strategies:
3.1 Diversification of Sourcing
Companies are reducing reliance on single countries by diversifying suppliers across multiple regions. This strategy, often called “China +1” or “multi-sourcing,” helps mitigate risks from geopolitical tensions or regional disruptions. Countries like Vietnam, India, and Mexico are emerging as alternative manufacturing hubs.
3.2 Nearshoring and Onshoring
To reduce lead times and improve resilience, firms are relocating production closer to their primary markets. Nearshoring to neighboring countries or onshoring production domestically reduces transportation costs, decreases exposure to international disruptions, and enhances responsiveness to changing demand patterns.
3.3 Inventory Reconfiguration
The pandemic demonstrated the risk of minimal inventory strategies. Companies now maintain strategic reserves of critical components, diversify inventory locations, and implement dynamic safety stock policies. This approach balances efficiency with resilience, ensuring continuity during crises.
3.4 Digital Supply Chains
Digitalization is central to modern supply chain shifts. Advanced analytics, AI-driven forecasting, and integrated enterprise resource planning (ERP) systems enable real-time visibility and predictive capabilities. Digital twins—virtual replicas of supply chains—allow companies to simulate disruptions, optimize flows, and make data-driven decisions rapidly.
3.5 Sustainability Integration
Sustainability is no longer optional; it is a strategic imperative. Companies audit suppliers for environmental compliance, adopt renewable energy in operations, and implement circular supply chains to reduce waste. This not only ensures regulatory compliance but also enhances brand reputation and meets growing consumer expectations for responsible business practices.
4. Challenges in Adapting to Shifts
While these strategies improve resilience, they come with challenges:
Cost Pressures: Diversification, nearshoring, and maintaining safety stock increase operational costs. Balancing efficiency with resilience requires careful financial planning.
Technological Complexity: Implementing AI, IoT, and blockchain requires significant investment and expertise. Integrating these technologies with legacy systems can be difficult.
Global Coordination: Supply chains are inherently complex, spanning multiple countries, currencies, and regulatory regimes. Ensuring smooth collaboration among diverse stakeholders remains challenging.
Environmental Constraints: Transitioning to sustainable practices may be limited by infrastructure, regulatory environments, and technological readiness in some regions.
5. Sector-Specific Impacts
5.1 Electronics and Semiconductors
The semiconductor shortage highlighted global dependency on a few producers. Companies are investing in regional chip fabrication plants and diversifying supply sources to reduce vulnerability.
5.2 Automotive Industry
Automotive supply chains, heavily reliant on just-in-time logistics, faced production halts during disruptions. Manufacturers are now increasing local sourcing of critical parts and adopting modular production strategies.
5.3 Pharmaceuticals
Medical supply chains face high stakes due to public health imperatives. There is a trend toward domestic API (active pharmaceutical ingredient) production, stockpiling essential medicines, and integrating real-time tracking for regulatory compliance.
6. The Future of Global Supply Chains
The future of global supply chains is likely to be defined by three principles: resilience, agility, and sustainability. Resilience requires flexible networks and contingency planning. Agility demands rapid responsiveness to shifting demand and supply conditions. Sustainability ensures long-term viability and social responsibility. Emerging trends include:
Increased adoption of AI and machine learning for predictive logistics.
Greater regionalization of supply chains to minimize dependency on distant suppliers.
Expansion of autonomous and electric transportation to reduce environmental impact.
Collaboration across industries and governments to enhance supply chain transparency and security.
Conclusion
Global supply chain shifts are not merely transient disruptions; they represent a structural transformation in how goods are sourced, produced, and delivered. Companies must navigate a landscape shaped by geopolitical uncertainties, technological innovation, environmental pressures, and evolving consumer expectations. Those who embrace digitalization, diversification, sustainability, and resilience will not only survive but thrive in a world where agility and adaptability define competitive advantage. Understanding and responding to these shifts is crucial, as supply chains continue to underpin the global economy, shaping everything from production efficiency to consumer satisfaction.  Education
Global Trade: Supply and Demand in ActionUnderstanding Supply in Global Trade
In economics, supply refers to the quantity of a good or service that producers are willing and able to offer at different price levels. In global trade, supply is influenced by:
Natural resources
Labor availability and cost
Technology
Capital investment
Government policies
Exchange rates
Countries specialize in producing goods they can make efficiently. This idea is known as comparative advantage, a concept strongly associated with the economist David Ricardo. For example, countries with abundant oil reserves such as Saudi Arabia have a strong supply of petroleum products. Nations with advanced technology and skilled labor, like Germany or Japan, often supply automobiles, machinery, and electronics to global markets.
When production costs are lower in one country, it can supply goods at lower prices internationally. For example, if labor costs are lower in a developing country, that country may become a major exporter of textiles or manufactured goods. Over time, global supply chains form, linking multiple countries in the production of a single product.
Understanding Demand in Global Trade
Demand refers to the quantity of goods and services consumers are willing and able to purchase at various price levels. In global trade, demand depends on:
Income levels
Population size
Consumer preferences
Cultural factors
Economic growth
Prices of substitute or complementary goods
For example, as incomes rise in countries like China and India, demand for imported luxury goods, energy, and technology increases. Meanwhile, developed economies such as United States have strong demand for consumer electronics, automobiles, clothing, and raw materials from around the world.
Global demand is also influenced by trends. For example, increasing awareness of climate change has raised demand for renewable energy technologies, electric vehicles, and sustainable products worldwide.
Global Supply Chains
Modern global trade depends heavily on interconnected supply chains. A smartphone, for example, may be designed in one country, assembled in another, and built using components from several others. Transportation networks, shipping companies, and digital communication systems allow firms to coordinate production worldwide.
Organizations like the World Trade Organization (WTO) help regulate international trade rules and reduce trade barriers. Trade agreements between nations lower tariffs (taxes on imports) and encourage smoother trade flows. When tariffs increase, global supply may decrease because goods become more expensive to export.
Price Determination in Global Markets
Prices in global trade are determined by the interaction between global supply and global demand.
If supply increases and demand remains constant, prices tend to fall.
If demand increases and supply remains constant, prices tend to rise.
If both increase, the effect depends on which grows faster.
Consider global oil markets. When oil-producing countries increase output, global supply rises, often lowering prices. When demand increases due to economic growth, prices may rise. Events such as geopolitical conflicts or natural disasters can disrupt supply, leading to sudden price spikes.
Agricultural products also show this pattern. A drought in a major exporting country reduces supply, pushing global prices higher. On the other hand, a record harvest can increase supply and lower prices worldwide.
Exchange Rates and Their Impact
Exchange rates play a crucial role in global supply and demand. When a country's currency weakens, its exports become cheaper for foreign buyers, increasing demand for its goods. Conversely, imports become more expensive for domestic consumers.
For example, if the U.S. dollar strengthens, American consumers may demand more imported goods because they are relatively cheaper. However, U.S. exports may become more expensive abroad, reducing foreign demand.
Exchange rate fluctuations can therefore shift global supply and demand patterns significantly.
Trade Imbalances
A country experiences a trade surplus when it exports more than it imports and a trade deficit when it imports more than it exports. The United States has historically run trade deficits, importing more goods than it exports. Meanwhile, countries such as China have often maintained trade surpluses.
Trade imbalances can result from differences in savings rates, production capacity, and consumer behavior. Persistent imbalances may influence currency values and political discussions about trade policies.
Government Intervention
Governments influence global supply and demand through:
Tariffs
Quotas
Subsidies
Trade agreements
Sanctions
For example, if a government subsidizes domestic agriculture, it increases supply in international markets, potentially lowering global prices. Conversely, imposing tariffs reduces demand for foreign goods.
Regional trade blocs like the European Union (EU) reduce trade barriers among member countries, increasing both supply and demand within the region.
Technology and the Digital Economy
Technology has transformed global trade. E-commerce platforms allow small businesses to reach international customers. Automation and artificial intelligence improve production efficiency, increasing global supply. Digital services such as software, streaming, and financial services can now be traded across borders with minimal transportation costs.
Companies like Amazon and Alibaba Group have expanded international trade by connecting buyers and sellers worldwide.
Risks and Challenges
Global supply and demand are vulnerable to disruptions:
Pandemics
Wars
Trade disputes
Climate change
Transportation bottlenecks
For instance, the COVID-19 pandemic disrupted supply chains, reducing supply and increasing prices for many goods. Similarly, geopolitical tensions can restrict exports of critical resources, affecting global markets.
The Future of Global Trade
The future of global trade will likely involve:
Greater digital integration
Increased focus on sustainability
Regional supply chains
Shifts in manufacturing locations
Countries are reevaluating supply chain resilience, seeking to balance efficiency with security. Renewable energy technologies and green industries are reshaping supply and demand patterns.
Emerging economies are expected to contribute a growing share of global demand as incomes rise. At the same time, automation may shift global supply patterns away from labor-cost advantages toward technology-based competitiveness.
Conclusion
Global trade is essentially the global extension of supply and demand principles. Producers around the world supply goods based on comparative advantage, cost structures, and resource availability. Consumers worldwide create demand based on income, preferences, and economic conditions. Prices emerge from the interaction of these forces across borders.
Exchange rates, government policies, technological advances, and global events constantly reshape this balance. While the core economic principles remain simple, the global system they operate within is highly complex and interconnected. Understanding global trade requires recognizing how supply and demand interact not just within one country, but across the entire world economy. Education 
Deglobalization and Supply Chain FragmentationUnderstanding Globalization
Globalization refers to the increasing interconnectedness of economies through trade, investment, technology, and the movement of labor and capital. Institutions such as the World Trade Organization (WTO) facilitated this integration by promoting trade liberalization and reducing tariffs. The late 20th and early 21st centuries saw multinational corporations expand their operations globally, optimizing production by locating different stages of manufacturing in countries with cost advantages.
For example, a smartphone designed in the United States might rely on rare earth minerals from Africa, semiconductors from East Asia, assembly in China, and global distribution networks spanning multiple continents. This model maximized efficiency and minimized costs, forming what became known as global value chains (GVCs).
What Is Deglobalization?
Deglobalization refers to the slowdown or reversal of global economic integration. It does not necessarily imply a complete retreat from international trade, but rather a reduction in the intensity of cross-border flows of goods, capital, technology, and labor.
Several indicators suggest deglobalization trends:
Slower growth in global trade relative to GDP
Rising tariffs and non-tariff barriers
Increased protectionist policies
Stricter foreign investment screening
National industrial policies aimed at reshoring production
Major geopolitical events have accelerated this trend. The trade tensions between the United States and China, particularly during the presidency of Donald Trump, marked a turning point. Tariffs imposed on hundreds of billions of dollars’ worth of goods disrupted established supply chains and encouraged firms to reconsider reliance on a single country.
Similarly, the COVID-19 pandemic exposed vulnerabilities in global supply networks. Lockdowns, transportation bottlenecks, and export restrictions led to shortages of medical supplies, semiconductors, and essential goods. Governments began emphasizing resilience over pure efficiency.
The conflict between Russia and Ukraine further intensified deglobalization by disrupting energy markets, grain exports, and industrial supply chains. Sanctions, trade restrictions, and financial decoupling fragmented global markets along geopolitical lines.
Supply Chain Fragmentation Explained
Supply chain fragmentation refers to the breaking up or regionalization of previously integrated global production systems. Instead of relying on a single, globally optimized chain, companies increasingly diversify suppliers, shift production closer to home (nearshoring), or move operations back domestically (reshoring).
In the era of hyper-globalization, companies followed a “just-in-time” model, minimizing inventory and depending on precise coordination across borders. While cost-effective, this approach proved fragile in times of disruption.
Fragmentation now manifests in several ways:
Reshoring – Bringing production back to the home country.
Nearshoring – Moving production to geographically closer countries.
Friend-shoring – Shifting supply chains to politically aligned or “friendly” nations.
Multi-sourcing – Diversifying suppliers to reduce reliance on one country.
For example, semiconductor supply chains—once heavily concentrated in East Asia—are now being reconfigured. The U.S. government has passed legislation encouraging domestic chip manufacturing, while European and Asian countries are investing heavily in local production capacity.
Causes of Deglobalization and Fragmentation
Several structural and political factors drive these trends:
1. Geopolitical Rivalry
Strategic competition between major powers, especially the United States and China, has encouraged technological decoupling. Restrictions on advanced semiconductor exports and concerns over data security have led governments to treat certain industries as matters of national security rather than pure economic efficiency.
2. Economic Nationalism
Populist movements in many countries argue that globalization has harmed domestic industries and workers. Politicians respond with policies aimed at protecting local jobs and industries, often through tariffs, subsidies, and local content requirements.
3. Technological Change
Automation reduces the importance of low labor costs, making reshoring more viable. Robotics, artificial intelligence, and additive manufacturing (3D printing) allow companies to produce closer to end markets without significant cost disadvantages.
4. Supply Chain Shocks
The COVID-19 pandemic revealed the risks of concentrated production hubs. For instance, disruptions in Chinese manufacturing centers caused global shortages in electronics and consumer goods. Firms now prioritize resilience, redundancy, and inventory buffers over minimal costs.
5. Climate and Sustainability Pressures
Environmental concerns also play a role. Long-distance transportation contributes to carbon emissions. Regional production networks may reduce environmental footprints and align with sustainability goals.
Economic Consequences
The shift toward deglobalization and fragmentation carries both benefits and costs.
Benefits
Increased resilience against geopolitical shocks and pandemics
Enhanced national security in critical sectors
Job creation in reshored industries
Reduced overdependence on single suppliers
Costs
Higher production costs, as companies lose efficiency gains from global specialization
Inflationary pressures due to more expensive inputs
Reduced global economic growth
Potential trade conflicts and retaliation
International organizations such as the International Monetary Fund (IMF) have warned that severe fragmentation could significantly reduce global GDP. Dividing the world into competing economic blocs may undermine decades of integration and poverty reduction.
Regionalization vs. Full Deglobalization
It is important to distinguish between complete deglobalization and regionalization. In many cases, trade is not disappearing but becoming more regionally concentrated. For example, North American trade has deepened under agreements like the United States–Mexico–Canada Agreement (USMCA). Similarly, Asian countries continue to expand intra-regional trade through frameworks such as the Regional Comprehensive Economic Partnership (RCEP).
Thus, instead of a fully globalized system, the world may be transitioning toward multiple regional blocs with limited interconnection between them.
Corporate Strategy in a Fragmented World
Businesses are adapting to this new environment by redesigning supply chains with flexibility in mind. Strategies include:
Dual sourcing of critical components
Investing in digital supply chain visibility tools
Increasing inventory buffers
Forming regional production hubs
Engaging in political risk analysis
Multinational corporations now consider geopolitical stability as carefully as labor costs when making investment decisions.
The Future Outlook
Deglobalization is unlikely to mean the complete collapse of international trade. Instead, the global economy appears to be entering a phase of “slowbalization”—a slower, more cautious form of globalization with greater emphasis on resilience, strategic autonomy, and regional partnerships.
Technological innovation, digital trade, and services may continue to integrate economies even as goods supply chains fragment. However, the balance between efficiency and security will remain a defining tension.
In conclusion, deglobalization and supply chain fragmentation represent a structural transformation of the global economy. Driven by geopolitical rivalry, economic nationalism, technological change, and systemic shocks, these trends are reshaping how goods are produced and distributed. While they may enhance resilience and national security, they also carry risks of higher costs and reduced global cooperation. The challenge for policymakers and businesses alike is to strike a balance between openness and security in an increasingly uncertain world.  Education
 Short
Short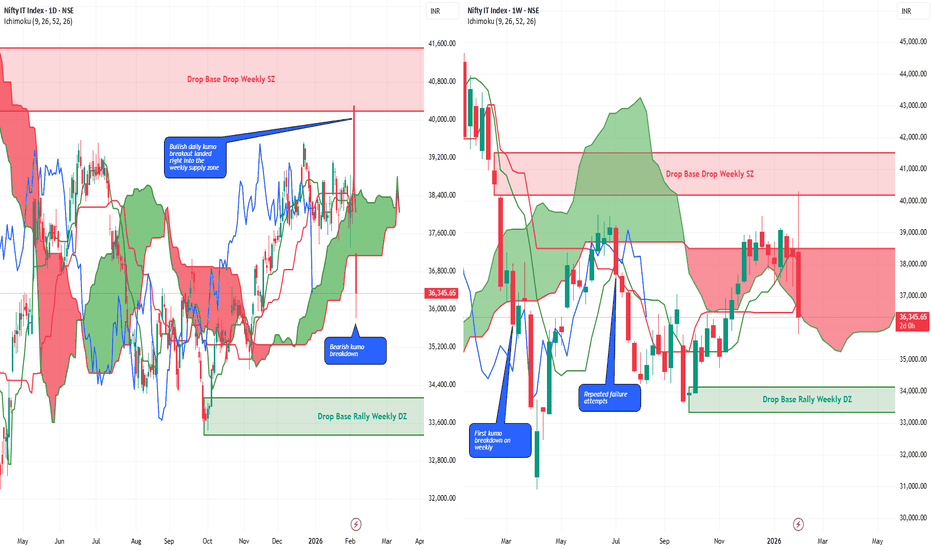
Oil Supply and Demand Balances1. Understanding Oil Supply
Oil supply refers to the total quantity of crude oil and petroleum products available for consumption at a given time. It can be categorized into several sources:
a) Crude Oil Production:
Crude oil production is the primary component of oil supply and is influenced by geological availability, technological capabilities, investment in exploration, and political factors. Major oil-producing countries such as Saudi Arabia, the United States, Russia, and members of the Organization of Petroleum Exporting Countries (OPEC) play a pivotal role in global production levels.
b) Inventories and Stockpiles:
Strategic and commercial oil reserves contribute to supply. Strategic reserves are maintained by governments to stabilize domestic markets in times of disruption, while commercial stockpiles are held by oil companies to meet demand fluctuations. Changes in inventory levels can signal either oversupply or shortages, impacting market prices.
c) Refinery Output:
Oil supply also depends on the capacity of refineries to process crude oil into usable products such as gasoline, diesel, jet fuel, and heating oil. Refinery utilization rates, maintenance schedules, and technological improvements can affect the amount of refined products available in the market.
d) Geopolitical Factors:
Supply is highly sensitive to geopolitical events. Conflicts in oil-producing regions, sanctions, or trade restrictions can constrain supply, while agreements among producers to cut or increase output (such as OPEC+ decisions) directly influence global supply levels.
e) Technological Advances and Unconventional Sources:
The development of unconventional sources, such as shale oil and oil sands, has significantly expanded supply options. Advances in hydraulic fracturing and horizontal drilling, particularly in the U.S., have shifted the global supply landscape by increasing production flexibility.
2. Understanding Oil Demand
Oil demand represents the quantity of crude oil and petroleum products that consumers are willing and able to purchase at prevailing prices. It is shaped by multiple factors:
a) Economic Activity:
Oil is a critical input for industrial production, transportation, and power generation. Economic growth drives higher energy consumption, especially in emerging economies such as China and India, which have rapidly growing industrial sectors and expanding transportation networks.
b) Transportation Sector:
The transportation sector accounts for the largest portion of oil demand. Demand for gasoline, diesel, and jet fuel is highly correlated with vehicle ownership, freight movement, and air travel. Shifts toward electric vehicles and public transportation can gradually reduce oil demand growth.
c) Seasonal Variations:
Oil demand fluctuates seasonally. For example, gasoline consumption typically rises during the summer driving season, while heating oil demand peaks in winter in colder regions. These seasonal patterns create temporary imbalances in supply and demand.
d) Energy Policy and Substitutes:
Government policies, such as fuel efficiency standards, carbon taxes, and subsidies for renewable energy, can affect oil demand. Increased adoption of alternative energy sources, biofuels, and electric mobility reduces reliance on oil and shifts the demand curve downward.
e) Population Growth and Urbanization:
Long-term oil demand trends are influenced by population growth and urbanization. Growing populations increase energy consumption, while urbanization often leads to higher transportation fuel usage, expanding the overall demand for oil.
3. Balancing Supply and Demand
The balance between oil supply and demand is crucial for maintaining price stability. When supply exceeds demand, inventories build up, leading to falling prices. Conversely, when demand outstrips supply, inventories decline, creating upward pressure on prices. This balance can be analyzed in several ways:
a) Global Oil Market Equilibrium:
Oil markets aim to reach an equilibrium where the quantity supplied matches the quantity demanded at a certain price. This equilibrium is rarely static due to continuous changes in production, consumption patterns, and external shocks.
b) Short-term vs Long-term Balances:
Short-term balances are influenced by seasonal fluctuations, weather events, refinery outages, and geopolitical crises. For instance, hurricanes in the Gulf of Mexico can temporarily disrupt U.S. production, tightening supply and pushing prices higher.
Long-term balances are determined by structural factors such as new oil field developments, technological innovation, energy transitions, and long-term economic growth trends.
c) Market Signals:
Oil prices serve as a signal for both producers and consumers. High prices incentivize increased production and energy efficiency, while low prices can reduce exploration investment and promote consumption. Futures markets also reflect expectations about future supply-demand balances.
4. Factors Disrupting the Balance
Oil supply-demand balances are highly sensitive and prone to disruption. Key disruptive factors include:
Geopolitical Tensions: Wars, sanctions, and political instability in oil-producing regions can reduce supply unpredictably.
Natural Disasters: Hurricanes, earthquakes, and other natural events can damage infrastructure, affecting both production and transportation.
Technological Changes: Breakthroughs in extraction or renewable energy can shift the balance. For example, the shale revolution dramatically increased U.S. oil production.
Economic Shocks: Global recessions reduce industrial activity and transportation, causing oil demand to fall sharply.
Policy Shifts: Regulatory changes, carbon pricing, and subsidies for alternative energy can either suppress or stimulate oil consumption.
5. Measurement of Supply-Demand Balances
Organizations such as the International Energy Agency (IEA), U.S. Energy Information Administration (EIA), and OPEC regularly monitor oil supply-demand balances. Key metrics include:
Supply Figures: Crude oil production, refinery output, and stock changes.
Demand Estimates: Consumption data across sectors and regions, including transportation, industrial, residential, and power generation.
Inventory Levels: Changes in crude and product stocks, signaling tightness or oversupply in the market.
Market Indicators: Futures prices, backwardation/contango structures, and spreads between crude grades.
These metrics allow analysts to forecast potential shortages or surpluses and anticipate price trends.
6. Implications for the Oil Market
The supply-demand balance has profound implications:
Price Volatility: Imbalances lead to sharp fluctuations in oil prices, affecting energy costs globally.
Investment Decisions: Producers rely on supply-demand forecasts to plan new exploration, production, and refining capacity.
Policy Formulation: Governments monitor the balance to ensure energy security, manage strategic reserves, and design energy policies.
Global Economic Impact: Oil prices influence inflation, trade balances, and economic growth worldwide. Surplus supply tends to lower prices, benefiting consumers, while shortages raise prices and strain economies.
7. Future Trends in Supply-Demand Balances
Several emerging trends are reshaping oil supply-demand dynamics:
Energy Transition: Shift toward renewables, electric vehicles, and energy efficiency may reduce long-term oil demand growth.
Peak Oil Demand: Some analysts project a peak in global oil demand in the next few decades, driven by technological innovation and policy shifts.
Geopolitical Realignments: Changes in OPEC+ strategies and new producers entering the market will influence future supply levels.
Climate Policies: Decarbonization commitments and emission reduction targets are likely to constrain fossil fuel consumption.
Conclusion
Oil supply and demand balances form the foundation of global energy markets. Supply is shaped by production levels, inventories, refinery capacity, technology, and geopolitics, while demand is influenced by economic activity, transportation, policies, population growth, and energy alternatives. Maintaining equilibrium is critical for price stability and economic planning. Disruptions in either supply or demand can lead to volatility, affecting markets worldwide. As the world moves toward cleaner energy sources, the dynamics of oil supply-demand balances will continue to evolve, making careful monitoring and analysis increasingly vital for stakeholders across the energy sector.  Education
Short 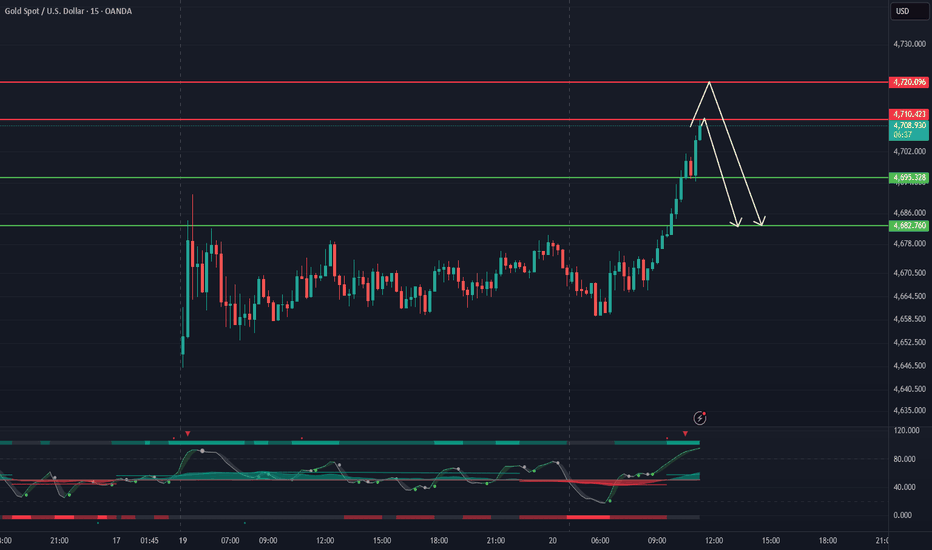
MARUTI - Supply Zone Rejection💹 Maruti Suzuki India Ltd (NSE: MARUTI)
View: Supply Zone Rejection | Chart: Intraday
Market Context: Sellers in Control Near Overhead Zones
📊 Price Action
Maruti has seen a sharp sell-off from higher levels, followed by weak consolidation near the lows. Every recovery attempt is facing pressure, clearly indicating that supply is dominating the upside. The structure remains corrective, not impulsive.
🔍 Technical Analysis (Chart Readings)
Strong bearish candles from the top confirm institutional supply activation
Pullbacks are shallow and overlapping, showing lack of strong demand
Price is trading below major supply zones, keeping the trend capped
🎯 Key Levels (Chart Readings)
Immediate Resistances:
16664
16827
16951
Supports to Watch:
16377
16254
16090
🟥 Demand & Supply Zones (Chart Readings)
Supply Zone: 17155 – 17174
This zone marks the origin of the breakdown. Heavy selling emerged from this area, making it a high-probability rejection zone on any future retest.
Strong Supply Zone: 17016 – 17027
A structurally important zone where price failed multiple times. As long as the stock remains below this band, upside is likely to remain restricted.
🧠 STWP Trade Analysis
From an STWP lens, this is a classic supply-driven structure. Until price shows strength above the marked supply zones with volume expansion, rallies should be treated as pullbacks, not reversals. Smart money behaviour suggests distribution, not accumulation.
🔮 Final Outlook
Trend: Weak to Bearish
Momentum: Fading on pullbacks
Risk Zone: Near supply areas
Bias: Sell-side pressure dominates below supply
📌 Markets respect zones, not opinions. When price enters supply, probability shifts.
⚠️ Disclosure & Disclaimer
This post is for educational and informational purposes only. It is not investment advice. Markets involve risk. Always manage position size and consult a SEBI-registered advisor if needed.
🚀 Stay Calm. Stay Clean. Trade With Patience. Trade Smart | Learn Zones | Be Self-Reliant  Short
Short
Long 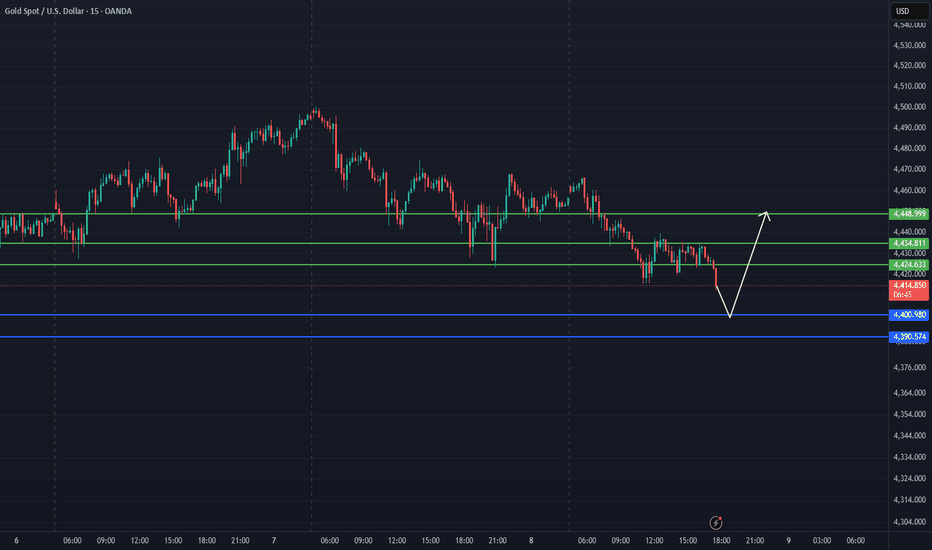
 Short
Short
CONCOR – 1D | 10-Year Support & Trendline BreakoutCompany Intro:
Container Corporation of India Ltd (CONCOR) is a Navratna PSU and India’s largest integrated logistics company, operating inland container depots (ICDs), container freight stations (CFS), and rail-based logistics services. It plays a key role in India’s EXIM trade and domestic freight movement.
Technical View (Daily Chart):
CONCOR has broken out above a 10-year long-term support trendline, indicating a structural trend reversal, The stock has given a strong close near ₹525, confirming bullish intent and acceptance above the breakout zone.
Levels to Watch:
CMP: ₹523
Immediate Resistance / Target: ₹600
Breakout Confirmation Level: ₹525 (strong close above this keeps momentum positive)
Immediate Support: ₹480
Major Support: ₹446
As long as the stock holds above ₹480, the trend remains positive with a higher probability of moving towards ₹600 in the near term.
Positive Triggers
Government’s continued push for rail-led logistics, DFC (Dedicated Freight Corridor) and multimodal transport benefits CONCOR directly.
Volume recovery in EXIM and domestic logistics improves revenue visibility.
PSU logistics stocks are seeing renewed investor interest due to valuation comfort and long-term infrastructure growth.
For analysis of any stock, feel free to comment the stock name below.
This analysis is for educational and informational purposes only. It does not constitute investment advice or a recommendation to buy or sell any security. Market investments are subject to risk, and past performance does not guarantee future results. Please consult a SEBI-registered financial advisor before making any investment decisions. The author is not responsible for any losses arising from the use of this information.  Long
Long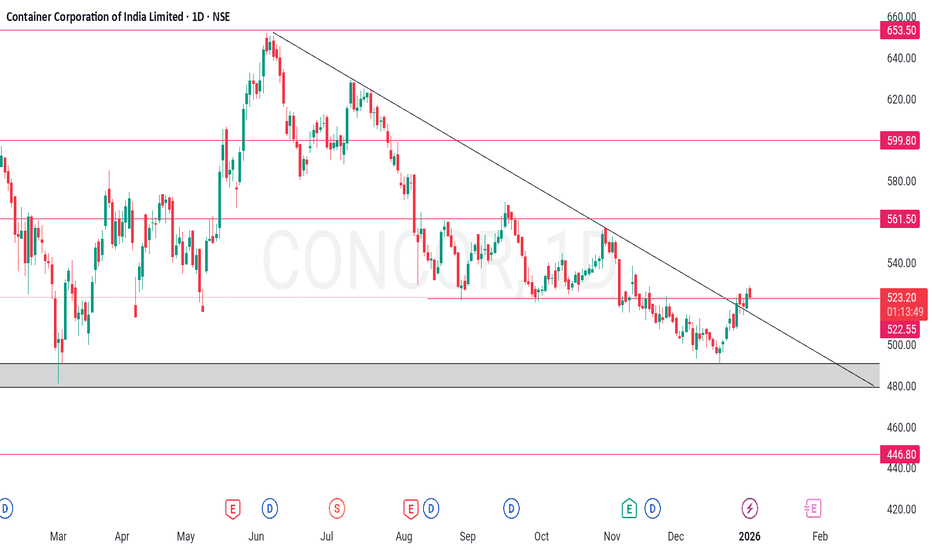
 Short
Short