Banknifty Intraday Analysis for 09th July 2026NSE:BANKNIFTY
The global market sentiment has turned negative following news that the United States cancelled its ceasefire agreement with Iran; however, any positive clarification could quickly lift the market, whereas a lack of resolution will likely keep it depressed.
The upward moment may lead the Index to 57500 – 57600 resistance range in upward momentum and if the index crosses and sustains above this level then may reach near 58100 – 58200 range.
On the contrary, a downward moment m
Support and Resistance
Finnifty Intraday Analysis for 09th July 2026NSE:CNXFINANCE
The global market sentiment has turned negative following news that the United States cancelled its ceasefire agreement with Iran; however, any positive clarification could quickly lift the market, whereas a lack of resolution will likely keep it depressed.
The upward movement may lead the Index to 26600 - 26650 resistance range and if the index crosses and sustains above this level then may reach near 26900 - 26950 range.
On the contrary, a downward moment may drag the to
Midnifty Intraday Analysis for 09th July 2026NSE:NIFTY_MID_SELECT
The global market sentiment has turned negative following news that the United States cancelled its ceasefire agreement with Iran; however, any positive clarification could quickly lift the market, whereas a lack of resolution will likely keep it depressed.
The upward movement may lead the Index near 14575 – 14600 resistance range and if the index crosses and sustains above this level then may reach 14775 – 14800 range.
On the contrary, a downward moment may drag the
Swing trading stocks for this weekBusiness Overview:
TVS-E is an ISO certified transaction Automation Products company. It is in the business of IT peripherals, point-of-sale solutions, field support, and infra-managed services for IT. Company's portfolio cater to the entire lifecycle management process, including product ideation, manufacturing, customer support services, warranty management, and end-of-life services.
Product Portfolio:
a) Input Devices: Keyboards (Mechanical & Membrane), Mouse (Optical), Barcode Scanner (1
Wyckoff Distribution - Market Structure ExplainedOverview
The Wyckoff Distribution phase typically develops after a sustained uptrend, where bullish momentum gradually weakens and price transitions into a period of sideways consolidation. During this phase, supply begins to outweigh demand as repeated rallies encounter selling pressure near resistance. The market remains range-bound until a confirmed breakdown signals the potential beginning of the Markdown Phase
------------------------------------------------------------------
Definit
DLF : structural transitionNSE:DLF
DLF is showcasing a clean structural transition from a deep accumulation phase following its correction from 52-week highs.
Technical Observation:
- Price has reclaimed key daily EMAs (20, 50, 100, and 200), trading firmly at ₹655.20.
- A classic demand-supply flip is taking shape above the ₹600–620 support cluster.
- Momentum is building on the RSI (currently at 59.32), signaling institutional absorption.
Execution Trigger:
The critical horizontal supply boundary sits at ₹680
MAXESTATE: Recovery TrendNSE:MAXESTATES
MAXESTATE continues to display an improving market structure with higher highs and higher lows while holding above its key moving averages. Buyers have defended the recent pullback, suggesting demand remains active.
Key observations:
• Bullish EMA alignment with healthy momentum (RSI above 50)
• Strong support around ₹436–442
• Immediate resistance at ₹460–470 (tested now)
• Major supply zone between ₹495–500
• A sustained breakout above ₹500 may strengthen the medium-term
CLEAN | Chemical Turnaround Watch, ₹820–860 Key Resistance ZoneClean Science & Technology Ltd. (CLEAN) is showing signs of base formation after a prolonged correction, but the chart still needs stronger confirmation before calling it a full trend reversal.
On the higher timeframe, the stock appears to be attempting a recovery from the lower support region. The broader ₹650–735 zone remains important because this is the area where buyers seem to be defending structure. If this support belt continues to hold, the probability of a medium-term recovery attempt
STANLEY | Base Formation Near Support, ₹172 Weekly Breakout WatcAfter a long corrective phase, Stanley Lifestyles looks like it is trying to build a base near an important support area.
On the broader structure, the ₹140–125 zone stands out as a strong support region. Price has started stabilizing after a prolonged decline, and short-term momentum is showing early improvement. However, the larger reversal is still not confirmed.
What stands out
Stock is attempting to hold above the recent base area.
Broader correction seems to be slowing down.
Weekly momen
MEDANTA | Hospital Stock Near Weekly Breakout — ₹1,400 Zone WatcGlobal Health Ltd — Weekly Chart Study
NSE: MEDANTA
MEDANTA is showing a strong weekly recovery attempt after taking support from lower levels. Price has recovered well and is now trading near an important trendline and breakout confirmation zone.
Chart observations:
Price is holding above the important ₹1,300 support area.
Weekly RSI is in a strong zone, showing improving momentum.
Weekly MACD is improving, suggesting that downside pressure is reducing.
Monthly structure is also improving af
MANKIND | Pharma Stock Breaks Trendline — ₹2,650 Zone WatchMankind Pharma Ltd — Weekly Chart Study
NSE: MANKIND
MANKIND is showing a strong weekly trendline breakout attempt after a corrective and consolidation phase. Price has moved above the falling trendline and is now trying to sustain above the breakout area.
Chart observations:
Price has moved above the falling trendline resistance.
Weekly RSI is holding in a strong zone, showing improving momentum.
Weekly MACD is positive and improving.
Price is sustaining above important weekly moving average
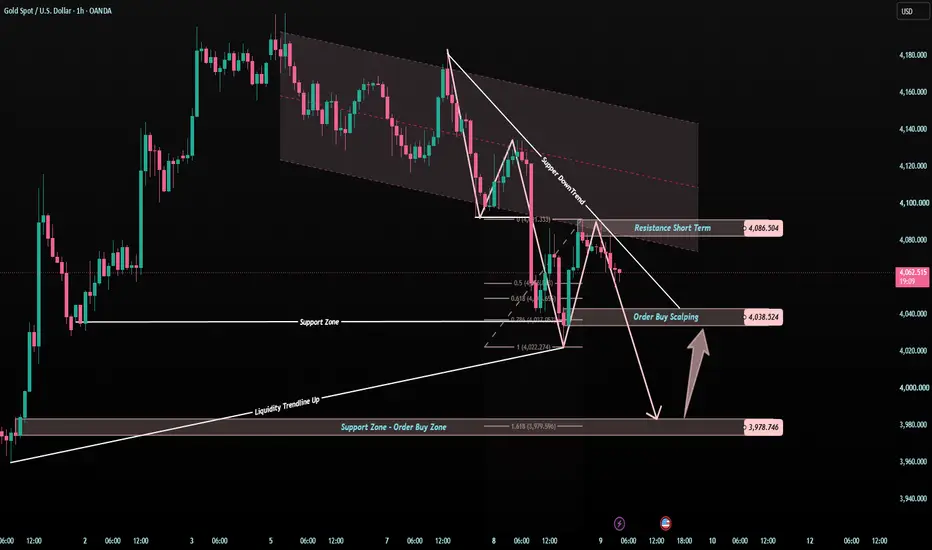
XAUUSD — Is 3,978 the Trap Zone?Gold is still under pressure, but this is exactly where the chart becomes more interesting.
Price is trading below the short-term downtrend line and has not been able to reclaim the 4,086 resistance zone.
That means sellers are still controlling the short-term structure.
But after a strong correction, the best question is not:
“Should I sell now?”
The better question is:
“Where could buyers react next?”
For me, today’s chart has two important downside zones.
The first one is 4,038.
The
XAUUSD GOLD ANALYSIS ON (09 JUL 2026)#XAUUSD UPDATEDE
Current price - 4080
If price stay below 4115, then next target 4040,4000 and 3960 and above that 4200
Plan;If price break 4080-4090 area,and stay below 4080,we will place sell order in gold with target of 4040,4000 and 3960 & stop loss should be placed at 4115
We may see NIFTY to continue its fall below 23800 levels As we can see NIFTY got rejected from our important supply zone and had been bearish ever since. It also somewhat managed to close below the trendline which is a sign of strong bearishness hence any break of 23800 levels can show more of strong bearishness till 23500, 23200 respectively so plan your trades accordingly and keep watching everyone.
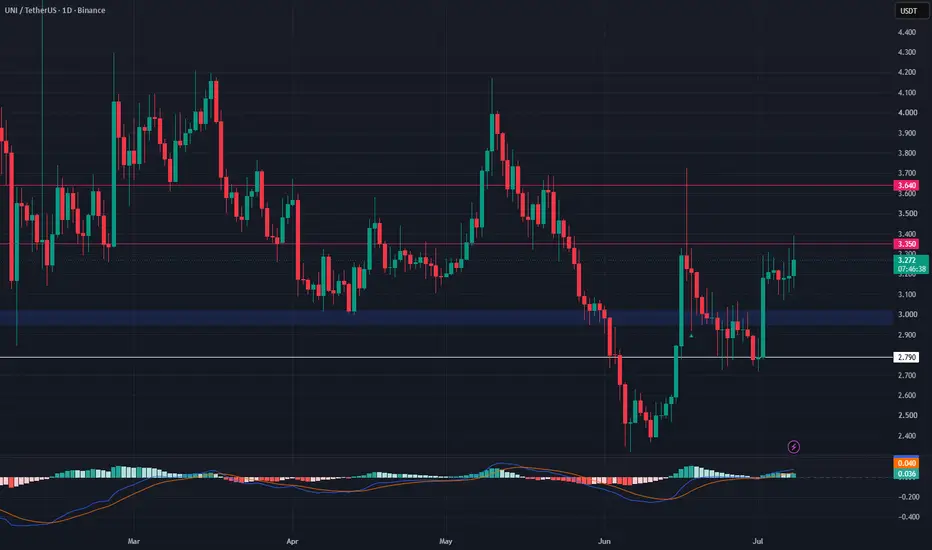
UNI Price Analysis: Key Support Zone to WatchUNI has surged almost 15% since our last analysis and is now trading in a strong short-term uptrend.
Momentum remains positive, but with geopolitical tensions increasing, a short-term pullback is still possible. If war-related headlines trigger another risk-off move, UNI may retest its major support zone, which could offer an attractive long-entry opportunity.
Our view is that if buyers defend the $2.95–$3.02 support area and market sentiment stabilizes, UNI could resume its upward move toward
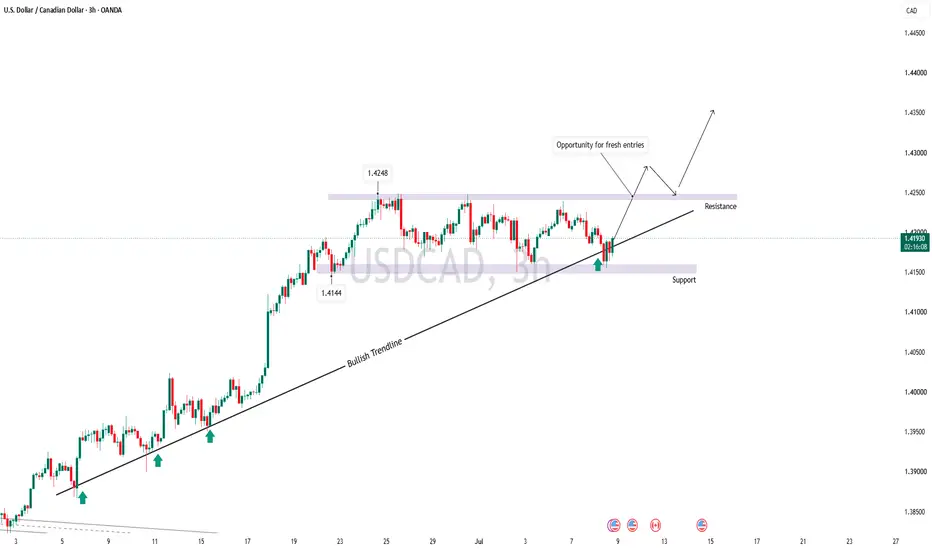
USDCAD to continues its Up-move above 1.4248?Price is forming a temporary sideways consolidating structure bounded by support at 1.4144 & resistance at 1.4248, breakout can lead to the continuation of super bullish move which was started on 1st may 2026 and has already broken 2 significant highs 1.3967 & 1.4140.
At the confluence of bullish trendline and horizontal support (1.4158) a strong bullish push is expected.
According to the price structure on higher time frames outlook for, near to midterm is bullish (Please refer to the related
BTCUSDT Bullish SMC Setup | Order Block Retest + IDM + BOS (1H)This analysis highlights a potential bullish Smart Money Concepts (SMC) setup on BTCUSDT (1H).
Analysis Overview
✅ Bullish Break of Structure (BOS)
✅ Inducement (IDM) sweep completed
✅ Price approaching a bullish Order Block (OB)
✅ Looking for a reaction from the Order Block before continuation
✅ Target is the previous supply/liquidity zone
Trading Idea
The market has already confirmed a bullish BOS, indicating strength from buyers. After sweeping liquidity (IDM), price is currently retracing
Nifty Intraday Analysis for 08th July 2026NSE:NIFTY
The market is expected to open flat to lower; however, a reversal from the lower levels is anticipated.
The upward movement may lead to 24650 – 24700 resistance range and if the index crosses and sustains above this level then may reach near 24900 – 24950 range.
On the contrary, a downward moment may drag the Index to 24150 – 24100 support range in downward momentum and if this support is broken then index may tank near 23900 – 23850 range.
Banknifty Intraday Analysis for 08th July 2026NSE:BANKNIFTY
The market is expected to open flat to lower; however, a reversal from the lower levels is anticipated.
The upward moment may lead the Index to 58900 – 59000 resistance range in upward momentum and if the index crosses and sustains above this level then may reach near 59600 – 59700 range.
On the contrary, a downward moment may drag the Index to 57700 – 57600 support range in downward momentum and if this support is broken then the index may tank near the 57000 – 56900 range.
Finnifty Intraday Analysis for 08th July 2026NSE:CNXFINANCE
The market is expected to open flat to lower; however, a reversal from the lower levels is anticipated.
The upward movement may lead the Index to 27250 - 27300 resistance range and if the index crosses and sustains above this level then may reach near 27550 - 27600 range.
On the contrary, a downward moment may drag the to 26750 – 26700 support range and if this support too is broken then index may tank near 26450 – 26400 range.
Midnifty Intraday Analysis for 0 8th July 2026NSE:NIFTY_MID_SELECT
The market is expected to open flat to lower; however, a reversal from the lower levels is anticipated.
The upward movement may lead the Index near 14800 – 14825 resistance range and if the index crosses and sustains above this level then may reach 15000 – 15025 range.
On the contrary, a downward moment may drag the index to 14475 – 14450 support range and if this support is broken then index may tank near 14275 – 14250 range.