Nifty50 view for Tomorrow | 8 July 📊 NIFTY – Tomorrow's Analysis
Today's rejection came exactly from the 24,500–24,600 supply zone, keeping the higher time frame view intact.
For tomorrow, 24,370 remains the key level.
🟢 Above 24,370: Expect a bounce towards 24,450–24,500.
🔴 Below 24,370: Weakness can continue, with 24,200 as the next important support.
Current Bias: Slightly Bearish 📉
Plan: Respect the higher time frame. Sell on rise until the supply zone is convincingly broken.
Support and Resistance
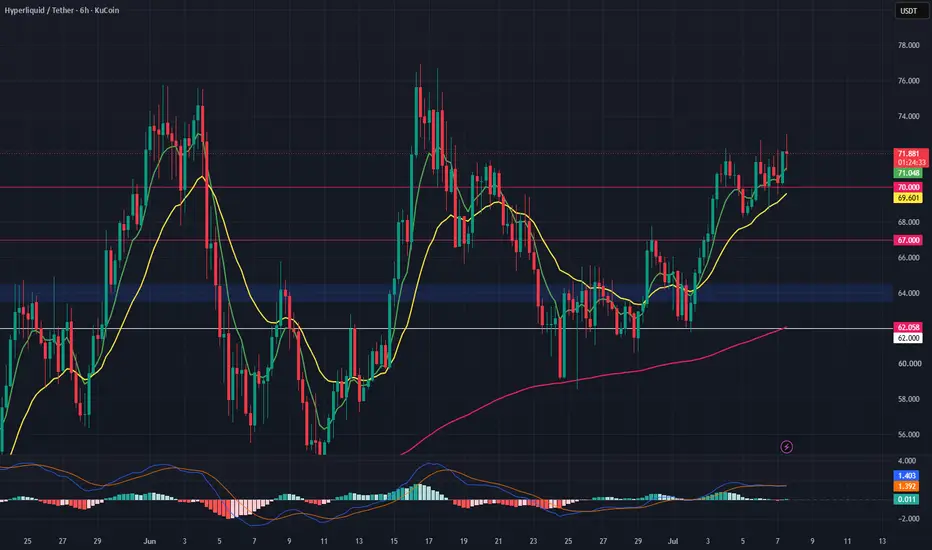
HYPE Bullish Structure Holding — Pullback Entry SetupHYPE remains one of the strongest charts in the market after breaking out of its multi-week downtrend.
The price is now holding above all key moving averages, which keeps the overall structure bullish. However, instead of chasing the rally, the better setup is to wait for a pullback into the $64.50 support zone.
If geopolitical tensions create a temporary sell-off and this level continues to hold, it could present a high-probability entry for a continuation move toward the recent highs.
Trade
Nifty Intraday Analysis for 07th July 2026NSE:NIFTY
The uptrend will likely continue, but expect volatility due to the weekly option expiry.
The upward movement may lead to 24650 – 24700 resistance range and if the index crosses and sustains above this level then may reach near 24900 – 24950 range.
On the contrary, a downward moment may drag the Index to 24200 – 24150 support range in downward momentum and if this support is broken then index may tank near 23950 – 23900 range.
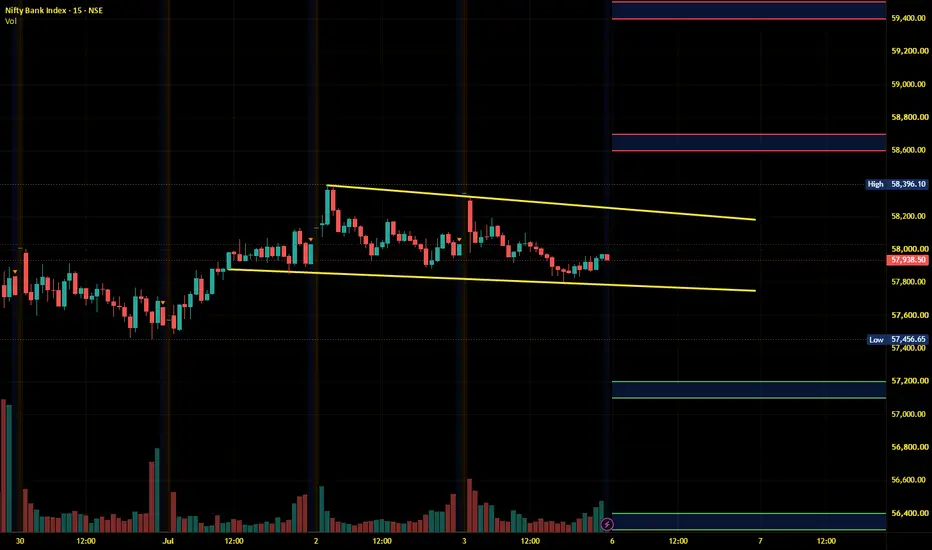
Banknifty Intraday Analysis for 07th July 2026NSE:BANKNIFTY
The uptrend is expected to continue; therefore, any gap-down opening will be seen as a fresh entry opportunity.
The upward moment may lead the Index to 58900 – 59000 resistance range in upward momentum and if the index crosses and sustains above this level then may reach near 59600 – 59700 range.
On the contrary, a downward moment may drag the Index to 57700 – 57600 support range in downward momentum and if this support is broken then the index may tank near the 57000 – 56900
Finnifty Intraday Analysis for 07th July 2026NSE:CNXFINANCE
The uptrend is expected to continue; therefore, any gap-down opening will be seen as a fresh entry opportunity.
The upward movement may lead the Index to 27250 - 27300 resistance range and if the index crosses and sustains above this level then may reach near 27550 - 27600 range.
On the contrary, a downward moment may drag the to 26750 – 26700 support range and if this support too is broken then index may tank near 26450 – 26400 range.
Midnifty Intraday Analysis for 0 7th July 2026NSE:NIFTY_MID_SELECT
The uptrend is expected to continue; therefore, any gap-down opening will be seen as a fresh entry opportunity.
The upward movement may lead the Index near 14775 – 14800 resistance range and if the index crosses and sustains above this level then may reach 14975 – 15000 range.
On the contrary, a downward moment may drag the index to 14475 – 14450 support range and if this support is broken then index may tank near 14275 – 14250 range.
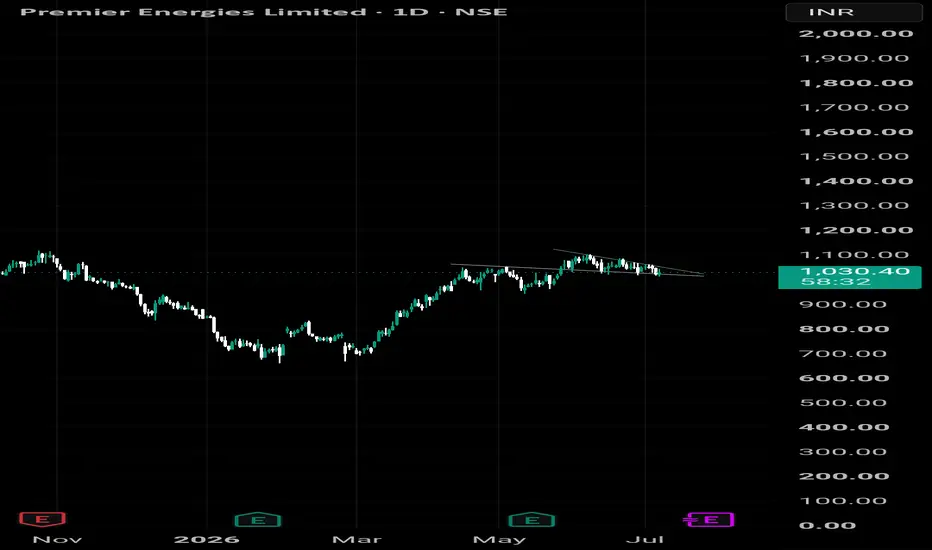
Premier Energies: Chart at a Decision PointA classic descending triangle is forming on the daily chart. 📉➡️📈
🔹 Price is compressing near support.
🔹 A breakout above the trendline could trigger fresh momentum.
🔹 A breakdown may lead to another round of selling.
The next few sessions could decide the next major move. 👀
Breakout or Breakdown? What's your view? 👇
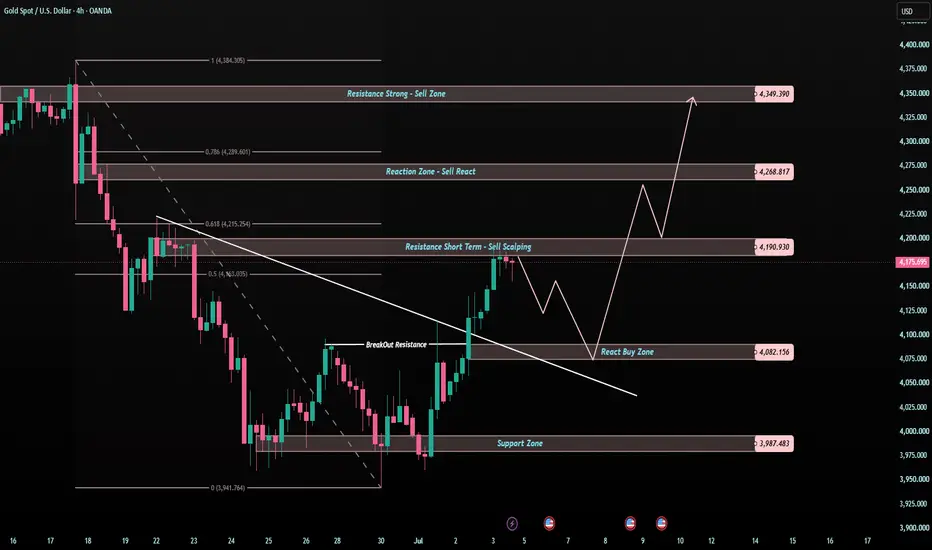
XAUUSD — Gold Is Not Weak, But This Is Not a Clean Buy YetGold is holding a much better structure than before.
After the recovery from the lower area, price is now staying above the rising trendline and moving close to the first resistance zone around 4,188.
This tells me one thing:
Buyers are still present.
But the market is not giving the cleanest entry at the current price.
Gold is now sitting between resistance and support.
That means the next best trade may come from patience, not prediction.
THE SIMPLE READ
Gold remains constructive while
PREDICTION ON BTCUSD 4H TFBITSTAMP:BTCUSD is currently trading inside a high-probability reversal area, which also aligns with a major Support-Resistance (SR) interchange level. This is a significant zone because it previously acted as support before turning into resistance, and from this exact region the market experienced a strong impulsive decline. The current retest suggests that sellers may once again defend this level.
The rejection around the reversal area strengthens the bearish case for the week. If this resi
AUDUSD getting ready for a rally?After a decline of 5.6% that we saw form 6th may 2026 to 30th June 2026, price has formed a bottoming formation at a strong Support, from where it has seen bounce backs earlier, after the breakout of the bearish trendline and sustaining comfortably above the neckline we might expect a good rally from the current levels.
Important levels:
0.6921 is an immediate support and below it 0.6883 can act as strong support. where as no any significant resistance is seen below 0.7041.
Structurally AUDUSD
Nifty Intraday Analysis for 06th July 2026NSE:NIFTY
The uptrend is expected to continue; therefore, any gap-down opening will be seen as a fresh entry opportunity.
The upward movement may lead to 24500 – 24550 resistance range and if the index crosses and sustains above this level then may reach near 24750 – 24800 range.
On the contrary, a downward moment may drag the Index to 24050 – 24000 support range in downward momentum and if this support is broken then index may tank near 23800 – 23750 range.
Banknifty Intraday Analysis for 06th July 2026NSE:BANKNIFTY
The uptrend is expected to continue; therefore, any gap-down opening will be seen as a fresh entry opportunity.
The upward moment may lead the Index to 58600 – 58700 resistance range in upward momentum and if the index crosses and sustains above this level then may reach near 59400 – 59500 range.
On the contrary, a downward moment may drag the Index to 57200 – 57100 support range in downward momentum and if this support is broken then the index may tank near the 56400 – 56300
Finnifty Intraday Analysis for 06th July 2026NSE:CNXFINANCE
The uptrend is expected to continue; therefore, any gap-down opening will be seen as a fresh entry opportunity.
The upward movement may lead the Index to 27100 - 27150 resistance range and if the index crosses and sustains above this level then may reach near 27400 - 27450 range.
On the contrary, a downward moment may drag the to 26600 – 26550 support range and if this support too is broken then index may tank near 26300 – 26250 range.
Midnifty Intraday Analysis for 0 6th July 2026NSE:NIFTY_MID_SELECT
The uptrend is expected to continue; therefore, any gap-down opening will be seen as a fresh entry opportunity.
The upward movement may lead the Index near 14700 – 14725 resistance range and if the index crosses and sustains above this level then may reach 14900 – 14925 range.
On the contrary, a downward moment may drag the index to 14400 – 14375 support range and if this support is broken then index may tank near 14200 – 14175 range.
The Breakout Is Real, But the Market May Test Patience FirstXAUUSD — The Breakout Is Real, But the Market May Test Patience First
Gold has changed its short-term behaviour.
After several days of bearish pressure, price has finally broken above the descending trendline and is now pushing into the first resistance area around 4,190.
This is a positive sign for buyers.
But it is also a danger zone for traders who chase too late.
The market has already moved far from the lower support.
So now, the cleaner question is not:
“Should I buy now?”
The bett
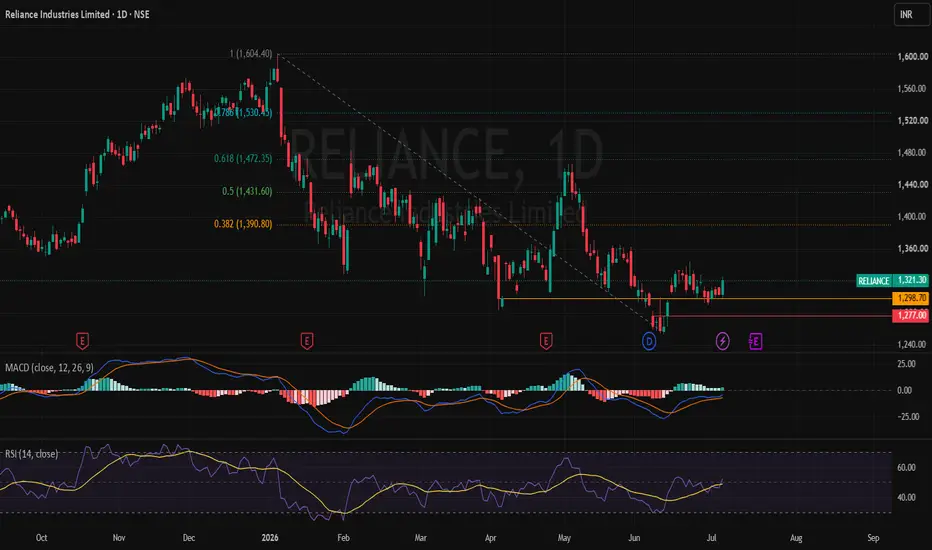
RELIANCE | Nifty Heavyweight Rebound — ₹1,390 Zone WatchReliance Industries Ltd — Short-Term Chart Study
NSE: RELIANCE
Reliance is showing a short-term rebound attempt from the lower support zone after a corrective move from recent highs. Price has taken support near the ₹1,277–1,300 area and is now trying to sustain above the short-term recovery zone.
Chart observations:
Price is holding above the recent support area.
Daily RSI has moved back above the mid-zone, showing improving momentum.
Daily MACD is also improving, suggesting downside pressur
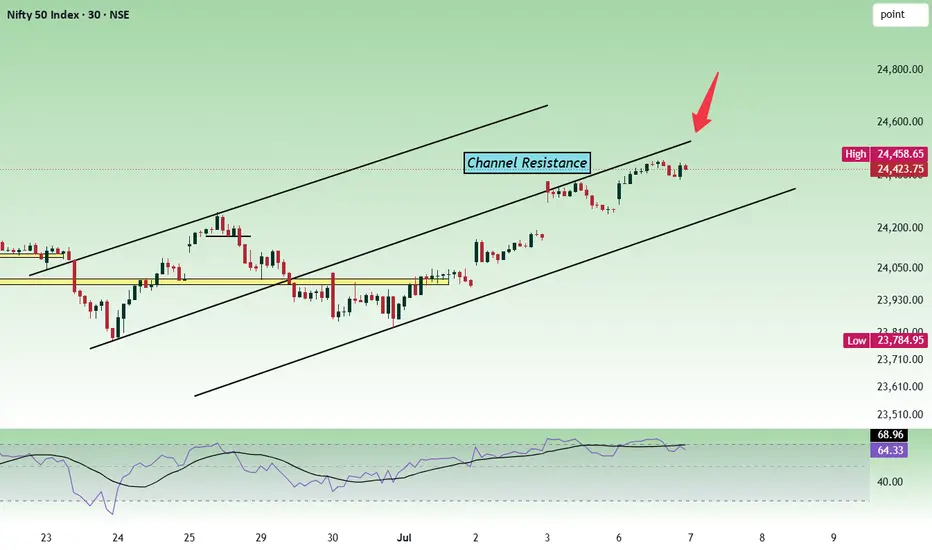
Nifty50 View for Tomorrow | Tuesday, 7 July📊 NIFTY – 2H Chart Analysis
• Price is trading just below the 24,500–24,600 supply zone.
• Rejection has started, but 24,370 is the key level to watch.
• As long as price holds above 24,370, the structure remains stable.
• A decisive break below 24,370 can trigger fresh selling pressure.
• Until then, avoid aggressive trades inside this zone.
🎯 Wait for confirmation. React to price, don't predict it.
Nifty - Expiry day analysis July 7.As per the daily chart, the price is nearing an important trend direction-deciding zone 24480 - 24520. Sustaining above this is important to move up further. If the price opens flat and does not show any bullish strength, it can fall from the 24500 zone.
Buy above 24520 with the stop loss of 24460 for the targets 24560, 24620, 24660 and 24720.
Sell below 24380 with the stop loss of 24440 for the targets 24340, 24280, 24240 and 24200.
Expected expiry day range is 24200 to 24700.
Always do your a
DCXINDIA | Defence Electronics Recovery — Trendline Breakout DCX Systems Ltd — Weekly Chart Study
NSE: DCXINDIA
DCXINDIA is showing a fresh weekly recovery attempt after a prolonged corrective phase from higher levels. Price has recovered from the lower base zone and is now testing an important falling trendline area.
The weekly structure is gradually improving. RSI has moved back above the mid-zone, showing better momentum, while MACD has turned positive, indicating that downside pressure is reducing.
The key zone to track now is the ₹208–220 area. Su
PPLPHARMA | Pharma Recovery Setup — Confirmation WatchPiramal Pharma Ltd — Weekly Chart Study
NSE: PPLPHARMA
PPLPHARMA is showing a fresh weekly recovery attempt after a prolonged corrective phase. Price has recovered from the lower zone and is now trying to sustain near an important resistance and trend-improvement area.
The weekly structure is gradually improving. RSI has moved back above the mid-zone, showing better momentum, while MACD is also turning positive, indicating that downside pressure is reducing.
The key zone to track now is the ₹
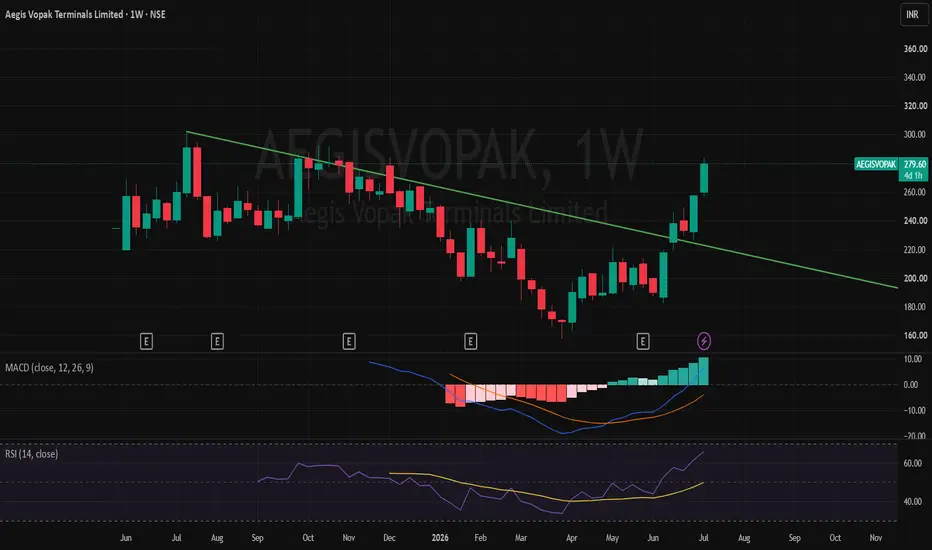
AEGISVOPAK | Energy Infrastructure — Weekly Breakout AttemptAegis Vopak Terminals Ltd — Weekly Chart Study
NSE: AEGISVOPAK
AEGISVOPAK is showing a strong weekly breakout attempt after a prolonged corrective phase. Price has moved above the falling trendline and is now testing an important resistance / breakout zone near the recent highs.
The weekly structure has improved meaningfully. RSI is rising into a stronger zone, while MACD has turned positive with improving histogram strength, indicating that downside pressure has reduced and momentum is buildi
Belrise Industries: Opportunity Often Appears When Optimism FadeBelrise Industries has completed what appears to be a Wave iii advance and is now retracing into the projected Wave iv support region.
The current pullback is testing the prior breakout area, which also aligns with a potential demand zone. From an Elliott Wave perspective, the ideal outcome would be a corrective decline that remains contained within this region before the larger trend attempts to resume.
At this stage, the quality of the correction is more important than its depth. A correctiv
ITC Ltd : ( 1 M )📉 Chart Analysis
👉 Major bearish breakdown: ITC has broken below a long-term ascending support trendline and triangle pattern. This is a significant negative technical signal.
👉 Strong selling pressure: The large bearish monthly candle indicates aggressive institutional selling and a shift in long-term sentiment.
👉 Current price: Around ₹290, trading near recent lows after the breakdown.
👉 Trend: Long-term trend remains bearish until the stock starts making higher highs and higher lows.
🔑 I