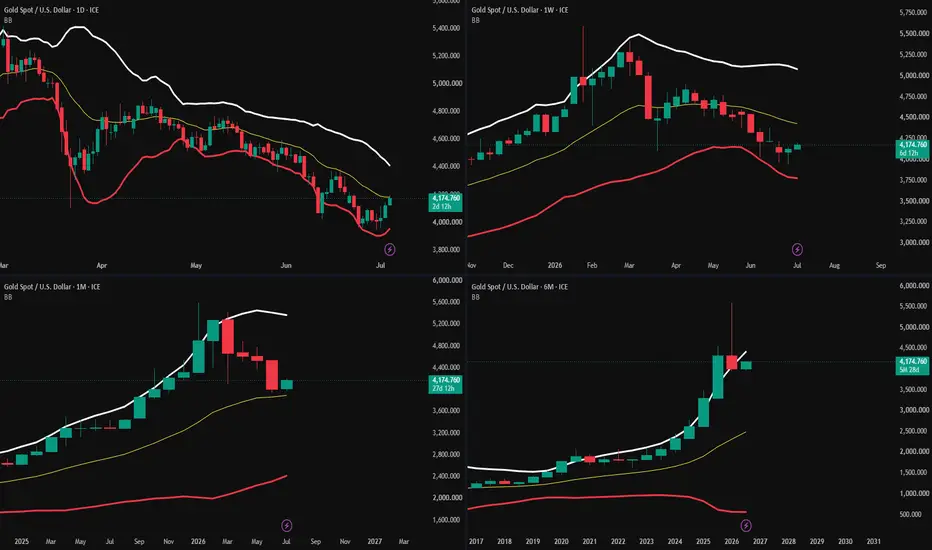
Very Simple yet powerful analysis. Daily (1D):
Medium-term downtrend remains intact.
Price has rebounded from the lower Bollinger Band.
Latest candles show a short-term recovery after a sharp decline.
Price is still below the Bollinger Band midline (yellow line).
Weekly (1W):
Previous strong uptrend has transitioned into a corrective phase.
Price has been making lower highs and lower lows since the peak.
Small bullish candles suggest selling pressure may be slowing.
Monthly (1M):
Long-term uptrend
Support and Resistance
BTCUSD Daily: Possible Reversal Setup To 70k.BTCUSD on the daily timeframe is showing a possible reversal structure after a sharp downside move. Price is currently trying to hold near the lower demand/support zone, and the latest candle suggests that buyers may be attempting to build a base.
As per the current chart structure, the key levels are:
Current Price Zone: Around 62,400
Immediate Support: 60,300 – 57,700
Invalidation / Weakness Below: 56,800
First Resistance / Supply Zone: 70,300 – 73,000
1st Target: 77,880
2nd Target: 80,416
Banknifty Intraday Analysis for 03rd July 2026NSE:BANKNIFTY
The uptrend is expected to continue, however, profit booking is expected on a higher level.
The upward moment may lead the Index to 58700 – 58800 resistance range in upward momentum and if the index crosses and sustains above this level then may reach near 59500 – 59600 range.
On the contrary, a downward moment may drag the Index to 57300 – 57200 support range in downward momentum and if this support is broken then the index may tank near the 56500 – 56400 range.
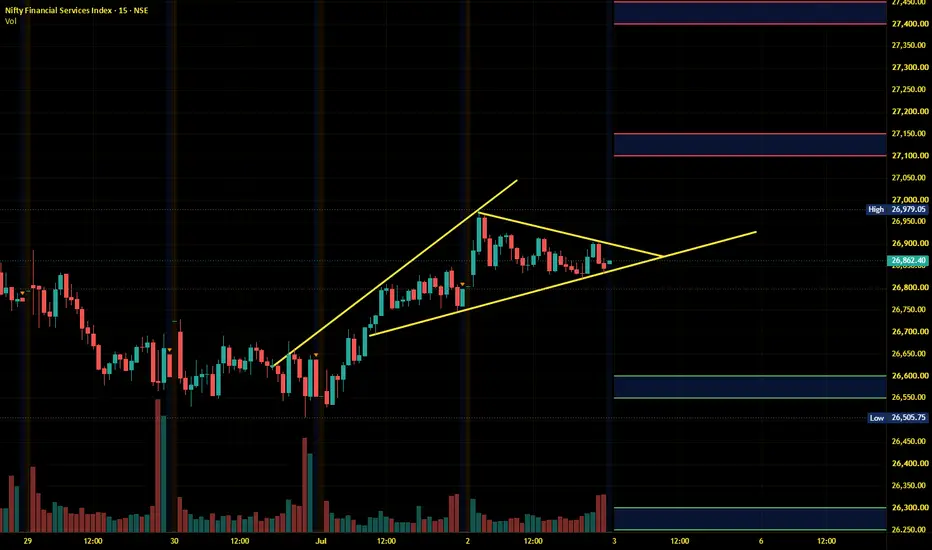
Finnifty Intraday Analysis for 03rd July 2026NSE:CNXFINANCE
The uptrend is expected to continue, however, profit booking is expected on a higher level.
The upward movement may lead the Index to 27100 - 27150 resistance range and if the index crosses and sustains above this level then may reach near 27400 - 27450 range.
On the contrary, a downward moment may drag the to 26600 – 26550 support range and if this support too is broken then index may tank near 26300 – 26250 range.
Midnifty Intraday Analysis for 0 3rd July 2026NSE:NIFTY_MID_SELECT
The uptrend is expected to continue, however, profit booking is expected on a higher level.
The upward movement may lead the Index near 14725 – 14750 resistance range and if the index crosses and sustains above this level then may reach 14925 – 14950 range.
On the contrary, a downward moment may drag the index to 14425 – 14400 support range and if this support is broken then index may tank near 14225 – 14200 range.
GBPEUR Breakout up-move going to persist?Price gave breakout above the year long consolidation, structurally the consolidation seems like a complex inverse head and shoulder pattern, which eventually broke above the level of 1.1630 (Neckline of the formation). The whole consolidation structure is at support of multi year rising trendline, taking support of which price has shown multiple bounce backs in the upper direction.
We are expecting a sustained up-move and eventual breakout of 1.216 which was previous upswing's high. Bullishness
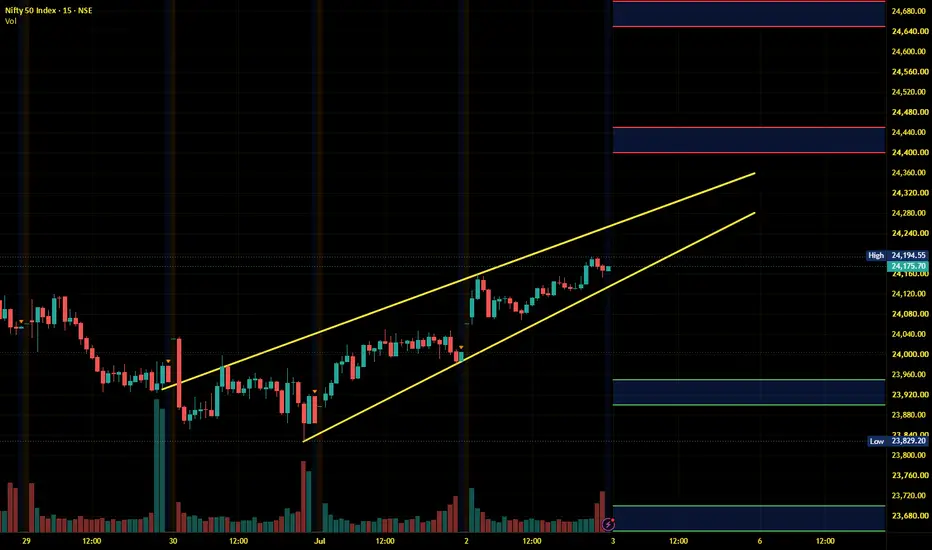
Nifty Intraday Analysis for 03rd July 2026NSE:NIFTY
The uptrend is expected to continue, however, profit booking is expected on a higher level.
The upward movement may lead to 24400 – 24450 resistance range and if the index crosses and sustains above this level then may reach near 24650 – 24700 range.
On the contrary, a downward moment may drag the Index to 23950 – 23900 support range in downward momentum and if this support is broken then index may tank near 23700 – 23650 range.
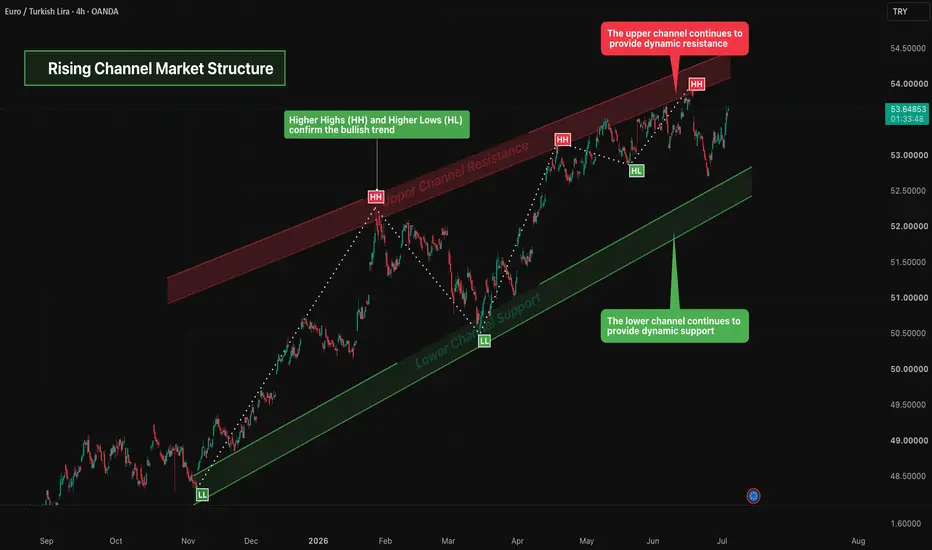
Rising Channel Market StructureOverview
This chart highlights a Rising Channel Market Structure, where price continues to trade within two upward-sloping parallel trendlines. The formation reflects a sustained bullish trend, with higher highs and higher lows indicating continued buying interest.
⸻⸻⸻⸻⸻⸻⸻⸻⸻⸻⸻
📘 Key Price Action
Price continues to respect the lower channel support.
Higher Highs (HH) and Higher Lows (HL) confirm the bullish trend.
The upper channel continues to provide dynamic resistance.
The lowe
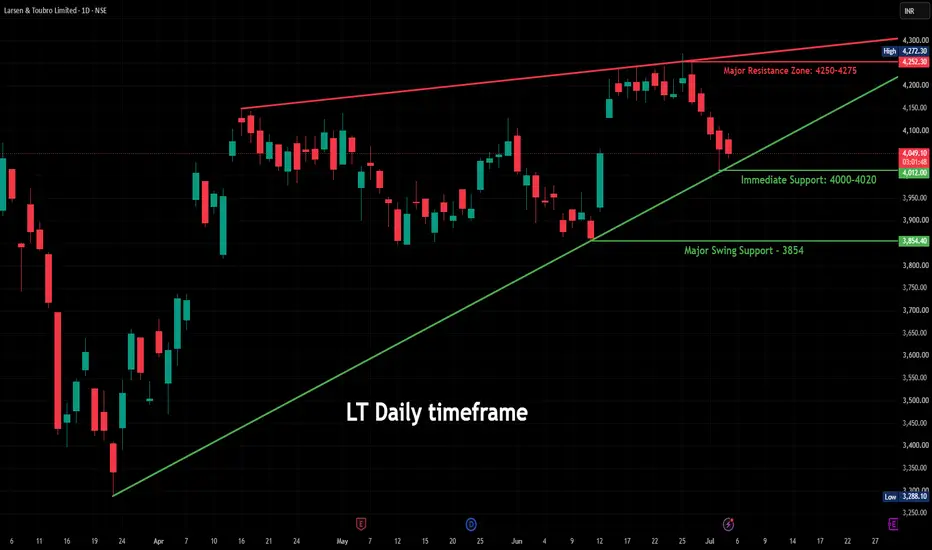
LT: Pullback Near Rising Trendline – Will Support Hold ?Overview
Larsen & Toubro (LT) has entered a healthy pullback after facing rejection from the 4250–4275 resistance zone. Despite the recent decline, the broader market structure remains constructive, with price approaching a rising trendline that has acted as dynamic support over the past few months.
The current setup places LT at an important technical decision point.
Chart Structure
The rising trendline has consistently attracted buyers during previous corrections, making the 4000–4020 regi
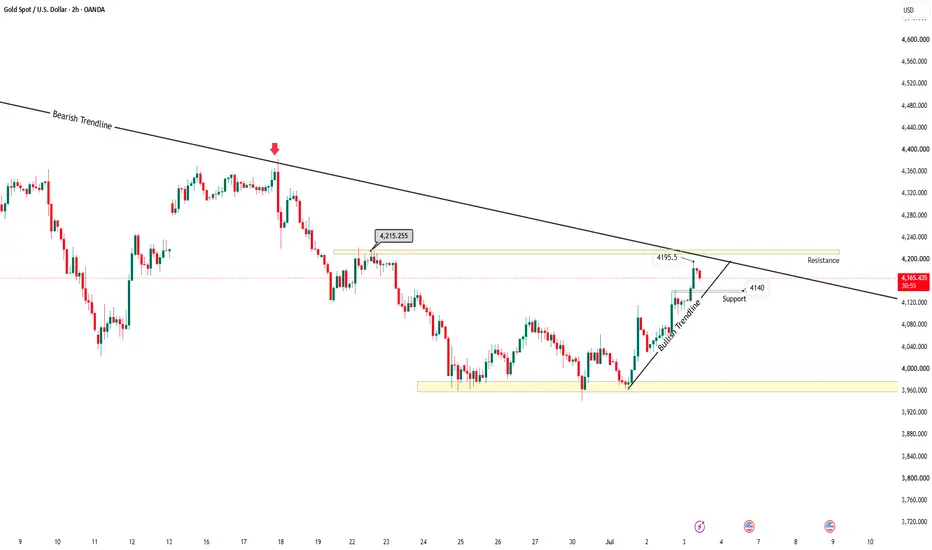
Outlook for GOLD(XAUUSD) & the way ahead.Price is making higher highs and higher lows structure, supported by bullish trendline, flag and pennant formation is visible and price has already shown 3 legs and now 4th leg is expected to be an extended one, immediate resistance is at 4215.3 and is a strong supply zone, price is approaching major bearish trendline, expected to face rejection, only if price rejects further up move and after a consolidation breaks below the range we can plan for short entries.
In summary: Bullish to side ways
Strong Breakout, But Smart Money Will Wait for the RetestGold is showing a strong bullish reaction after breaking above the previous resistance structure.
The price is now trading around 4,180 - 4,185, moving inside a clear short-term uptrend channel.
This move looks powerful.
But this is also the moment where many traders make the same mistake:
They chase the candle too late.
For me, the better plan is not to chase the breakout.
The better plan is to wait for the market to retest the zones that created the move.
THE SIMPLE READ
Gold is curren
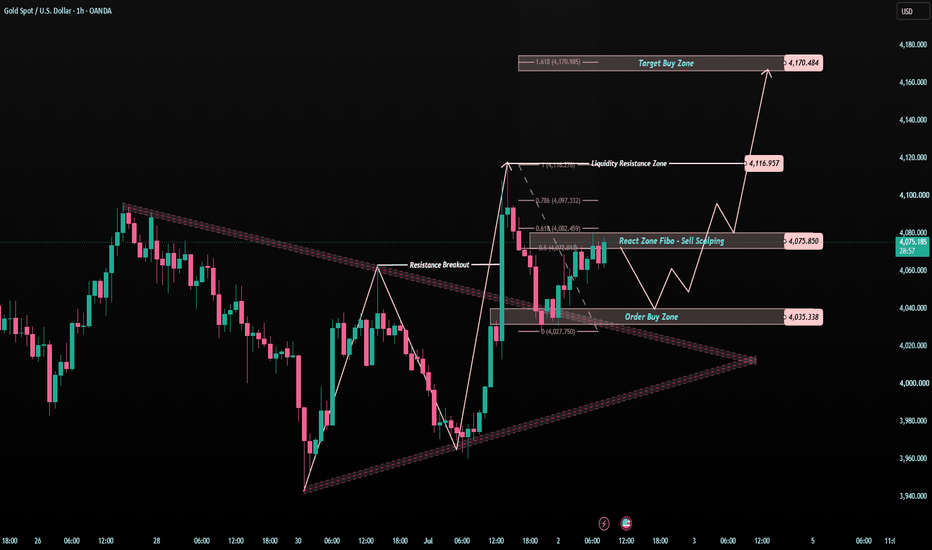
The Breakout Looks Strong, But This Level Decides EverythingGold has finally pushed out of the previous compression structure.
The move looks stronger now, but this is where traders need to stay calm.
A breakout can attract buyers.
But the real question is not whether gold broke out.
The real question is whether gold can hold the breakout.
Right now, price is trading around 4,070 - 4,075, near the Fibo reaction zone.
This area may decide whether gold continues higher or needs a deeper retest first.
THE SIMPLE READ
Gold is trying to shift from rec
Macpower CNC (weekly price action)Levels marked on the chart.
Avoid buying now as the stock will soon reach its resistance area.
Investors who bought the stock around 800-900 are likely to book profit now as they have doubled their investments
Best entry would be near 1000 for upside targets 1400, 1600 & 1900
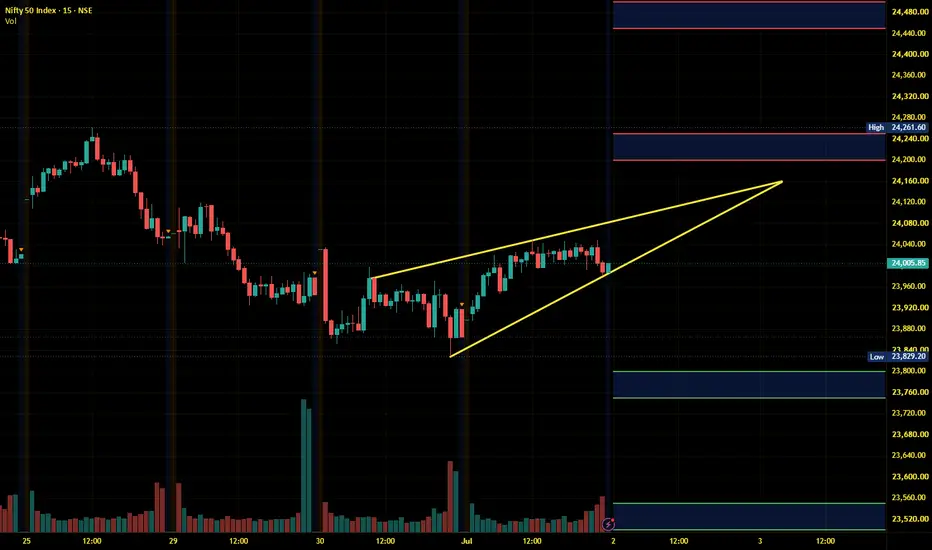
Nifty Intraday Analysis for 02nd July 2026NSE:NIFTY
The uptrend should continue, with a reversal expected from support levels if the market drops.
The upward movement may lead to 24200 – 24250 resistance range and if the index crosses and sustains above this level then may reach near 24450 – 24500 range.
On the contrary, a downward moment may drag the Index to 23800 – 23750 support range in downward momentum and if this support is broken then index may tank near 23550 – 23500 range.
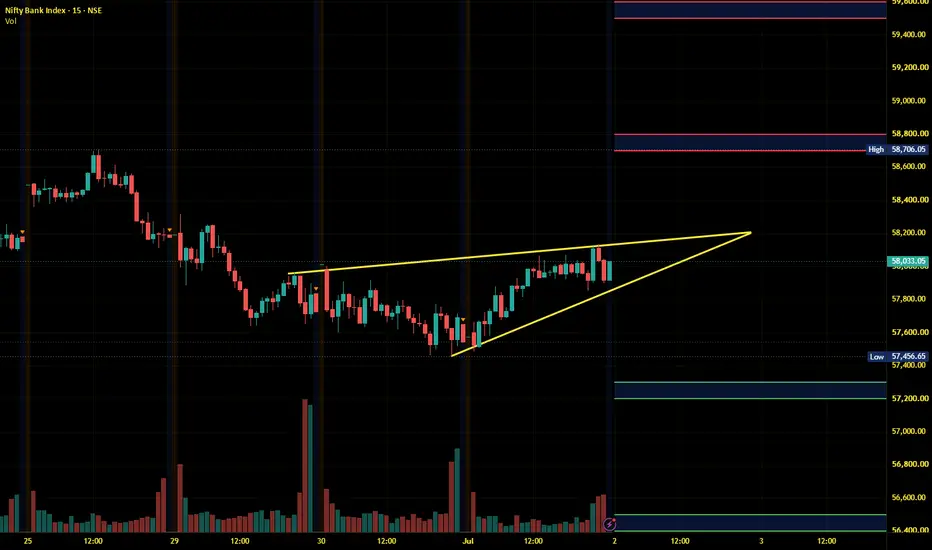
Banknifty Intraday Analysis for 02nd July 2026NSE:BANKNIFTY
The uptrend should continue, with a reversal expected from support levels if the market drops.
The upward moment may lead the Index to 58700 – 58800 resistance range in upward momentum and if the index crosses and sustains above this level then may reach near 59500 – 59600 range.
On the contrary, a downward moment may drag the Index to 57300 – 57200 support range in downward momentum and if this support is broken then the index may tank near the 56500 – 56400 range.
Finnifty Intraday Analysis for 02nd July 2026NSE:CNXFINANCE
The uptrend should continue, with a reversal expected from support levels if the market drops.
The upward movement may lead the Index to 27050 - 27100 resistance range and if the index crosses and sustains above this level then may reach near 27350 - 27400 range.
On the contrary, a downward moment may drag the to 26550 – 26500 support range and if this support too is broken then index may tank near 26250 – 26200 range.
Midnifty Intraday Analysis for 02nd July 2026NSE:NIFTY_MID_SELECT
The uptrend should continue, with a reversal expected from support levels if the market drops.
The upward movement may lead the Index near 14700 – 14725 resistance range and if the index crosses and sustains above this level then may reach 14900 – 14925 range.
On the contrary, a downward moment may drag the index to 14400 – 14375 support range and if this support is broken then index may tank near 14200 – 14175 range.
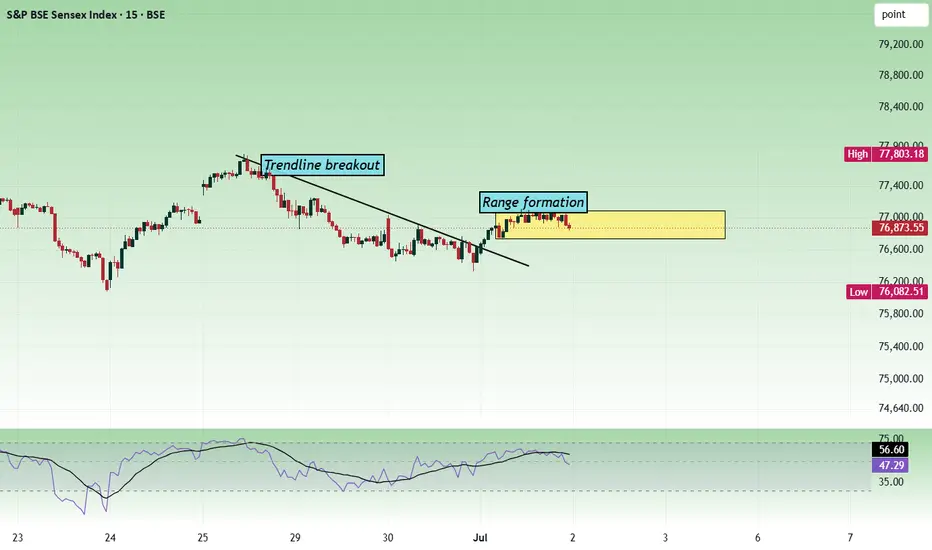
Sensex - Expiry day analysis July 2The price has given a trendline breakout, but did not gain strength and is forming a range between 76700 to 77100. If the price did not gain bullish strength, it can move towards the next support at 76300 zone.
Buy above 77120 with the stop loss of 76960 for the targets 77260, 77400, 77560, 77720 and 77840.
Sell below 76760 with the stop loss of 76900 for the targets 76620, 76480, 76340, 76200 and 76040.
If the price shows bullish strength in the opening, it can move towards the next resistance
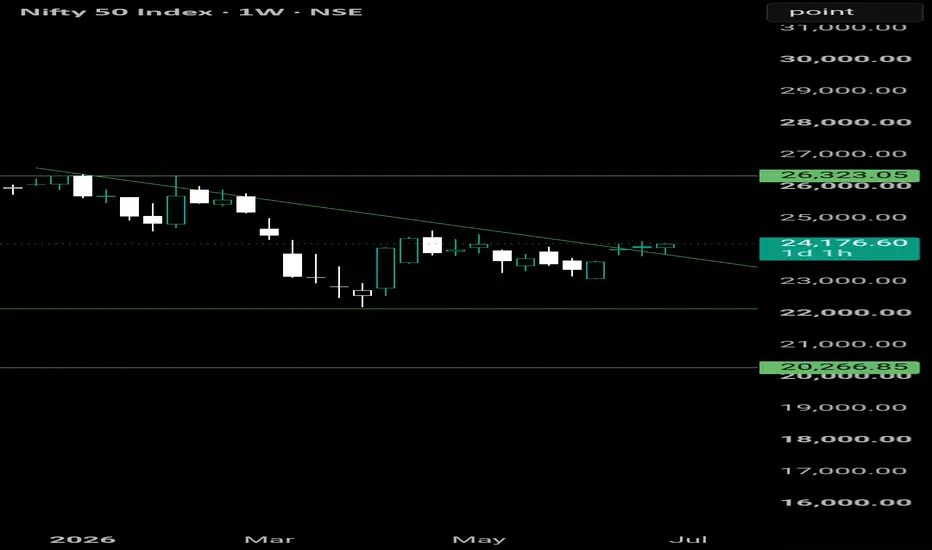
Weekly Nifty50 Update Nifty is testing a key falling trendline.
A decisive breakout could trigger fresh bullish momentum. 🚀
The next few weekly candles will be crucial for defining the market's medium-term trend.
What's your view — Breakout or Rejection? 👇
Disclaimer: This analysis is shared for educational purposes only and should not be considered as buy/sell or investment advice. Always do your own research before investing.
HINDUNILVR | 2-Year Symmetrical Triangle — Breakout Zone WatchOverview
Hindustan Unilever — one of India's most widely held FMCG stocks — has been forming a Symmetrical Triangle on the Daily chart spanning nearly 2 years. Price is currently sitting inside the triangle's breakout zone, with yesterday's strong +3% bullish candle adding momentum to the setup.
The next few sessions will be critical in determining whether this triangle resolves bullishly or bearishly.
The Symmetrical Triangle
A Symmetrical Triangle forms when price makes lower highs and higher
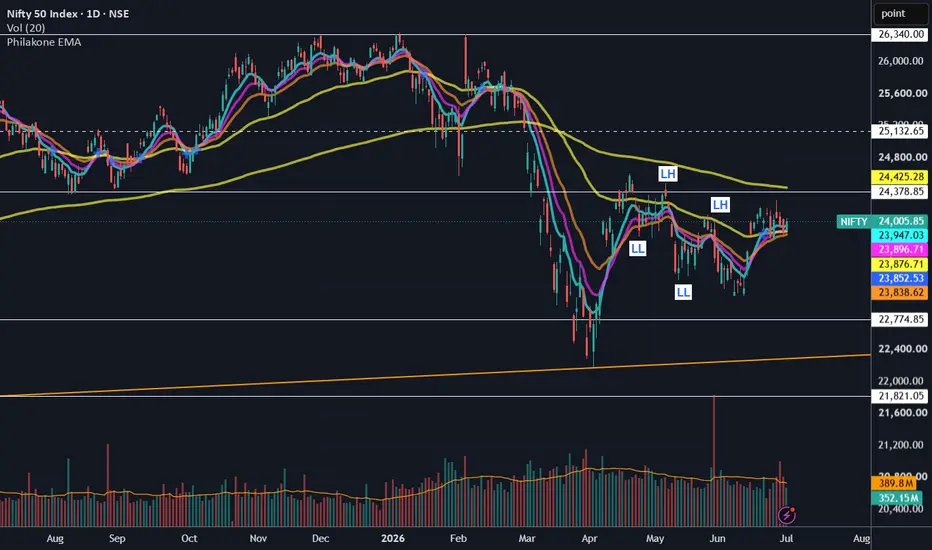
NIFTY Monthly UpdateNIFTY traded in the range of 23,070–24,260 during the month of June, closing 1.35% higher compared to May. Although geopolitical tensions have eased and crude oil prices have fallen, FII selling in equities continued in the domestic market. The EMA confluence zone of 24,000–24,400 across timeframes will be a key level to watch. On the upside, 25,100 will act as the first resistance level. On the downside, the previous swing low of 23,000 and then 22,800 will act as support levels.
Let me know y