Axis bank...In the daily time frame, the price is forming a bullish W pattern. In the lower time frame(30 minutes), the price has given a trendline breakout.
Buy above 1360 with the stop loss of 1346 for the targets 1374, 1382, 1396. The price may face resistance at the 1390 - 1400 zone as the W pattern completes at 1394. It can pull back here before moving up.
Sustaining the 1400 zone can give a good movement as it can give the W pattern breakout target levels.
Always do your analysis before taking any tra
Support and Resistance
Will Gold Break Higher or Retest Support First?Gold has recovered from the lower support, but now price is testing a very important reaction area. This is where the next move can become much clearer.
THE SIMPLE READ
Gold bounced strongly from the 4,226 area and is now trading near 4,320.
This looks positive, but price is also sitting close to a resistance and volume reaction zone. That means buyers are active, but they still need to prove strength above the next level.
For beginners, this is a simple lesson:
A bounce is good, but a conf
Range Bound Market Structure Overview
This chart highlights a well-defined range-bound market structure where price continues to trade between a key support zone and a major resistance zone. Multiple reactions from both levels indicate that buyers and sellers remain in equilibrium, with neither side gaining a decisive advantage.
------------------------------------------------------------
Key Price Action
• Resistance continues to reject upward price movement.
• Support remains a key demand zone where buyers step in.
BUY TODAY SELL TOMORROW for 5%DON’T HAVE TIME TO MANAGE YOUR TRADES?
- Take BTST trades at 3:25 pm every day
- Try to exit by taking 4-7% profit of each trade
- SL can also be maintained as closing below the low of the breakout candle
Now, why do I prefer BTST over swing trades? The primary reason is that I have observed that 90% of the stocks give most of the movement in just 1-2 days and the rest of the time they either consolidate or fall
Resistance Breakout in GENESYS
BUY TODAY SELL TOMORROW for 5%
BUY TODAY SELL TOMORROW for 5%DON’T HAVE TIME TO MANAGE YOUR TRADES?
- Take BTST trades at 3:25 pm every day
- Try to exit by taking 4-7% profit of each trade
- SL can also be maintained as closing below the low of the breakout candle
Now, why do I prefer BTST over swing trades? The primary reason is that I have observed that 90% of the stocks give most of the movement in just 1-2 days and the rest of the time they either consolidate or fall
Resistance Breakout in GOLDIAM
BUY TODAY SELL TOMORROW for 5%
Nifty Intraday Analysis for 17th June 2026NSE:NIFTY
Overall market sentiment remains positive as a consensus emerges regarding the signing of the US-Iran deal. However, profit-taking is expected at higher levels ahead of Wednesday night's US FOMC meeting outcome, the first under new Chairman Kevin Warsh.
The upward movement may lead to 24200 – 24250 resistance range and if the index crosses and sustains above this level then may reach near 24450 – 24500 range.
On the contrary, a downward moment may drag the Index to 23800 – 237
Banknifty Intraday Analysis for 17th June 2026NSE:BANKNIFTY
Overall market sentiment remains positive as a consensus emerges regarding the signing of the US-Iran deal. However, profit-taking is expected at higher levels ahead of Wednesday night's US FOMC meeting outcome, the first under new Chairman Kevin Warsh.
The upward moment may lead the Index to 58000 – 58100 resistance range in upward momentum and if the index crosses and sustains above this level then may reach near 58800 – 58900 range.
On the contrary, a downward moment may d
Finnifty Intraday Analysis for 17th June 2026 NSE:CNXFINANCE
Overall market sentiment remains positive as a consensus emerges regarding the signing of the US-Iran deal. However, profit-taking is expected at higher levels ahead of Wednesday night's US FOMC meeting outcome, the first under new Chairman Kevin Warsh.
The upward movement may lead the Index to 26700 - 26750 resistance range and if the index crosses and sustains above this level then may reach near 27000 - 27050 range.
On the contrary, a downward moment may drag the to 262
Midnifty Intraday Analysis for 17th June 2026NSE:NIFTY_MID_SELECT
Overall market sentiment remains positive as a consensus emerges regarding the signing of the US-Iran deal. However, profit-taking is expected at higher levels ahead of Wednesday night's US FOMC meeting outcome, the first under new Chairman Kevin Warsh.
The upward movement may lead the Index near 14675 – 14700 resistance range and if the index crosses and sustains above this level then may reach 14875 – 14900 range.
On the contrary, a downward moment may drag the inde
HOW-TO: Trade Gold & Silver with Auto Support/Resistance Levels This tutorial shows how to trade MCX Gold futures using auto-generated support/resistance levels. Current gold setup with clear entry, stop-loss, and target levels.
Markets: MCX Gold/silver Futures (or any commodity)
Timeframe: 15-minute chart
Understanding Auto Support/Resistance Indicator
The Auto S/R indicator generates key levels across multiple timeframes:
Intraday levels for day trading
Weekly levels for swing trades
Monthly levels for position trading
Why this helps: No need to man
Gold Is At A Critical Decision PointGold remains trapped inside a tight $4300–$4355 range, but this kind of compression rarely lasts for long.
📊 Current Market Structure
The trend remains cautiously bullish, but price is struggling beneath a major resistance zone around $4355–$4365.
🔑 Key Levels To Watch
🔴 Resistance: $4355
A breakout above this level could open the door toward fresh highs.
🟢 Support: $4300
If price loses this level during the US session, a liquidity sweep toward lower demand zones becomes increasingly likely.
Axis Bank: Analyzing the Current Triangle and Key LevelsAxis Bank is currently trading at 1,365.70 . Over the past few months, the price action has started to tighten significantly, moving into a well-defined technical range. By studying the chart structure and momentum, we can map out the two most likely paths ahead without bias.
The Chart Pattern: A Contracting Triangle
The structure starting from the peak of 1,418.30 looks like a classic contracting triangle. This pattern consists of five waves (A-B-C-D-E) that reflect a balance between buye
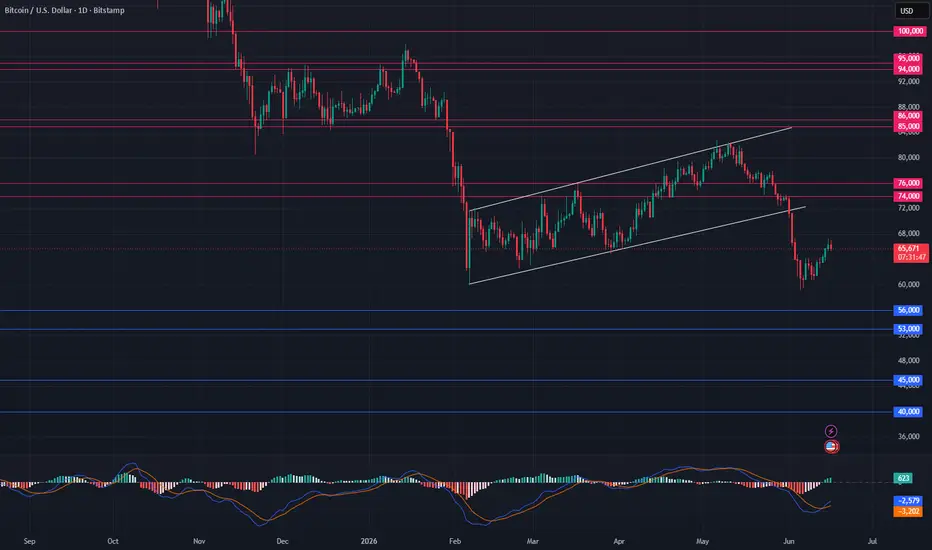
Bitcoin Breakdown: Bear Market Structure Remains IntactBitcoin continues to trade with a weak technical structure, and there is not much improvement to report in the crypto space this week.
The trend remains clearly bearish as BTC continues to print lower highs and lower lows. More importantly, Bitcoin has now taken out the March low, which adds further pressure to the current setup.
The recent breakdown from the ascending price channel is also a major warning sign. This type of breakdown often acts as a continuation pattern, and in this case, the
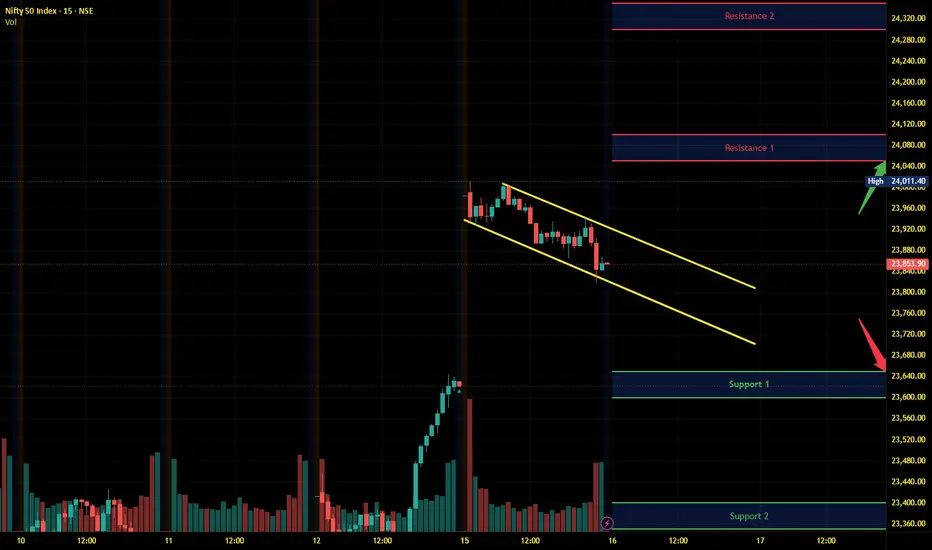
Nifty Intraday Analysis for 16th June 2026NSE:NIFTY
Overall market sentiment is positive as a consensus emerges regarding the signing of the US-Iran deal. However, volatility expected on weekly Option expiry day and 24000-24100 is emerging as major resistance.
The upward movement may lead to 24050 – 24100 resistance range and if the index crosses and sustains above this level then may reach near 24300 – 24350 range.
On the contrary, a downward moment may drag the Index to 23650 – 23600 support range in downward momentum and if
Banknifty Intraday Analysis for 16th June 2026NSE:BANKNIFTY
Overall market sentiment is positive as a consensus emerges regarding the signing of the US-Iran deal. The market is expected to bounce back if profit-taking drags prices down to key support levels.
The upward moment may lead the Index to 57900 – 58000 resistance range in upward momentum and if the index crosses and sustains above this level then may reach near 58700 – 58800 range.
On the contrary, a downward moment may drag the Index to 56500 – 56400 support range in downward
Finnifty Intraday Analysis for 16th June 2026 NSE:CNXFINANCE
Overall market sentiment is positive as a consensus emerges regarding the signing of the US-Iran deal. The market is expected to bounce back if profit-taking drags prices down to key support levels.
The upward movement may lead the Index to 26575 - 26625 resistance range and if the index crosses and sustains above this level then may reach near 26925 - 26975 range.
On the contrary, a downward moment may drag the to 25975 – 25925 support range and if this support too is brok
Midnifty Intraday Analysis for 16th June 2026NSE:NIFTY_MID_SELECT
Overall market sentiment is positive as a consensus emerges regarding the signing of the US-Iran deal. The market is expected to bounce back if profit-taking drags prices down to key support levels.
The upward movement may lead the Index near 14600 – 14625 resistance range and if the index crosses and sustains above this level then may reach 14800 – 14825 range.
On the contrary, a downward moment may drag the index to 14250 – 14225 support range and if this support is
Reliance...The price is at an important level. Sustaining above 1330 is important to gain bullish strength. In the daily chart, the price has given the head-and-shoulders pattern breakout and now it is testing the neckline resistance.
Buy above 1330 with the stop loss of 1318 for the targets 1342, 1450, 1362 and 1376.
Always do your analysis before taking any trade.
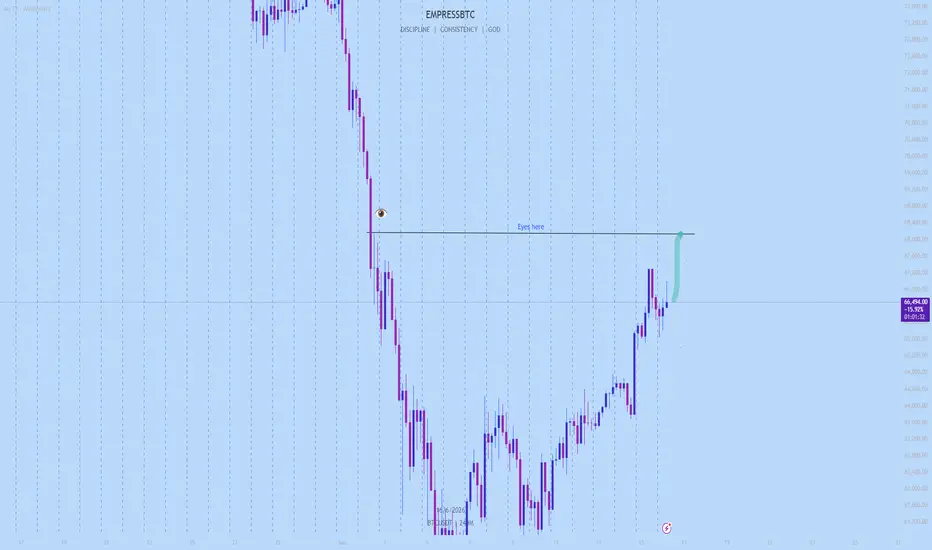
BTC 4K Technical Outlook-Eyes on $68K as Risk Sentiment ImprovesBitcoin has staged an impressive recovery following the recent de-escalation in geopolitical tensions and improving global risk sentiment. The peace agreement has reduced uncertainty across financial markets, encouraging capital rotation back into risk assets, with BTC leading the move higher and the Institutional Demand Remains Strong
Spot Bitcoin ETF inflows continue to provide structural demand.
Institutional participation remains one of the strongest bullish catalysts for BTC's medium-term
BELBEL – Daily Wyckoff Distribution (Schematic #2) in Play
Bel's daily structure appears to be unfolding as a Wyckoff Distribution – Schematic #2, suggesting a transition from demand dominance to supply control.
Key observations from the chart:
Preliminary Supply (PSY) marked the first sign of large supply entering after a strong uptrend.
Buying Climax (BC) followed by an Automatic Reaction (AR) confirmed the start of a trading range.
Secondary Test (ST) failed to make new highs, indicating we
Nifty - Expiry day analysis June 16Opening was a gap up and bullish, but the price faced resistance at the 24000 - 24020 zone and fall. Nearby support is in the 23740 zone as per the daily chart.
If the price did not gain strength, it can move within the range of 23700 to 24000. It will sustain 24000 zone if the price gains bullish strength. The price will break 23700 and move towards the 23500 zone if it gains bearish strength.
Let us assume the price opens flat. In that case, buy above 23920 with the stop loss of 23860 for the
JELLYJELLY/USDT.P — 50% Long Daily Breakout Prediction JELLYJELLY is attempting to reclaim bullish market structure after spending months consolidating inside a broad accumulation range. Recent price action shows a clean reaction from the higher timeframe demand zone followed by a local BOS and momentum expansion.
The chart currently suggests a possible continuation toward the untapped liquidity resting near previous swing highs if buyers maintain control above the reclaimed support region.
📍 Key Support Zone:
0.048 – 0.053
🛑 Invalidation Zone:
D
Gold 4H Chart Update Price is currently testing a key zone. This level could act as a turning point:
If support flips into resistance, we may see rejection and downside movement.
If price breaks through resistance, it could open the path for bullish continuation.
Let’s watch closely how price reacts here for the next move.