The Deception of Trend in a Range-Bound MarketProbable Scenario Analysis:
⏺ Present Scenario:
Presently, Gold TVC:GOLD is in a hyper-contraction phase. Technically, gold is flat and making too many random moves. There is no trend confirmation yet. However, the instrument is offering the allure of a potential trend just to disappoint the momentum traders. Both bulls and bears are trapped.
🟢 Bullish Scenario
There is no confident bullish scenario. However, if the price decisively sustains above 4450, then a confident bullish setup might emerge. The probable bullish targets above 4450 would be - 4475 and 4500.
🔴 Bearish Scenario
There is no confident bearish scenario. However, if the price decisively sustains below 4350, then a confident bearish setup might emerge. The probable bearish targets below 4350 would be - 4325 and 4300.
🟡 No Trading Zone: (4425 - 4375).
⏺ Range of Consolidation (Mi-ROC): (4450 - 4350).
Here, 4400 is the median of the ROC. The median works like a trading session sentiment evaluator. The price trading above the median would offer bullish sentiment, while the price trading below the median would trigger bearish sentiment within the ROC.
● Intraday, Weekly, and Monthly Bias
Establish bias with respect to the opening price (of the particular session - Intraday, Weekly, and Monthly). If the price sustains above the opening price, then don't think of shorting. Look for bullish trades only. On the contrary, if the price sustains below the opening price, then don't think of going long. Look for bearish trades in that case.
● Disclaimer + End Note
- All the analyses would fail in the case of a major gap up, gap down, or price structure anomaly. Thus, practice PRAGMATISM in the live session.
- Trade only if there is a set-up. Remember, not trading is an extension of the trading activity.
- Mark your points. Trade your points. Price is GOD. Anything can happen in the markets. Thus, trade what you see, not what you believe.
- Always PRACTICE RISK MANAGEMENT. Always PROTECT YOUR CAPITAL. Be RESPONSIBLE.
- Be Strategic. Be Courageous. Be Patient. Be Wise.
- Every day is a new day. Thus, do not carry the baggage of past successes or failures. Leave the gardens of winning and losing. Establish yourself in equanimity. Always think from a new perspective.
- Let the joy of trading drive your effectiveness, not greed or fear. Believe in Possibilities.
Happy Trading! #BANKNIFTY Intraday PE & CE Levels(13/08/2026)Bank Nifty is expected to open with a gap down, likely near the 57,500–57,550 zone. The index may remain volatile around this support area, and traders should watch the 57,550–57,600 zone for the next directional move.
If Bank Nifty sustains above 57,600, buying can be considered with targets of 57,750, 57,850 and 57,950+. On the downside, if the index breaks below 57,450, selling can be considered with targets of 57,250, 57,150 and 57,050.
The immediate resistance zone is 57,950–58,050, while 57,450–57,550 remains the key support zone. Traders should avoid aggressive positions during the initial gap-down volatility and wait for confirmation around these levels.  Education

 Education

 Education

 Education

 Education

 Education

 Education

 Long
Long
 Long
Long

The Only 3 Questions That Have Always Mattered in TradingAfter Everything — All the Indicators, All the Analysis, All the Strategy — Only 3 Questions Have Ever Actually Mattered.
Strip away every indicator, every tool, every strategy. What remains is three questions. Every profitable trade answers all three. Every blown account ignored at least one. All of it — every single concept — distils into three questions you must answer before placing any trade or investment.
QUESTION 1: WHAT IS THE TREND?
This is not about finding the perfect entry. It is about orientation. It is about knowing which side of the market has the wind behind it.
Higher highs and higher lows = uptrend. You are looking for longs only.
Lower lows and lower highs = downtrend. You are looking for shorts or cash only.
Neither = ranging. You wait. No trend is not a trade.
The most expensive move in trading is fighting the trend because you believe in the asset, or because you are bored, or because you want to be early. The trend does not care what you believe. It will continue until it does not. Every indicator, every analysis method — their only real purpose is to help you answer this first question more precisely.
QUESTION 2: WHERE IS THE RISK?
This is your stop loss. Defined before entry. Non-negotiable.
Not "where do I think price will not go?" That is a hope.
Not "wherever I lose X rupees." That is arbitrary.
The correct answer is: the price at which the thesis for the trade is proven wrong.
You bought because you believed a support zone at ₹500–₹510 would hold. If price closes decisively below ₹498, the zone is broken. Your thesis is wrong. You exit. Full stop.
This question must be answered before the trade is placed. Once you are in a trade, your brain is compromised by loss aversion, anchoring, and confirmation bias. The stop was set by your rational, pre-trade self. Respect it.
Without a defined risk level, you do not have a trade. You have a bet.
QUESTION 3: IS THE REWARD WORTH THE RISK?
If your stop loss is ₹20 away from entry, your target must be at least ₹40 away. Minimum 1:2 risk-to-reward. Why? Because you will not win every trade. The best traders in the world have win rates of 40–55%. They are profitable because they make more on winners than they lose on losers.
A trader with a 45% win rate and 1:2 risk-reward is profitable. A trader with a 65% win rate and 1:0.5 risk-reward is losing money. If the chart does not offer a realistic 1:2 target before the next major resistance or support level — the trade does not qualify. Skip it. The market will give you another opportunity tomorrow.
The Complete Framework in One Sentence:
Trade with the trend. Risk only what the chart tells you to risk. Never take a trade where the potential gain is less than twice the potential loss.
Every profitable system ever developed — from Wyckoff to Jesse Livermore to modern quant strategies — is an elaboration of these three principles. Every blown account — from retail traders to $6 billion hedge fund collapses — violated at least one.
The questions have not changed. The answer is in asking them — consistently, before every trade, for the rest of your trading career.
If even one of these ideas changed how you see markets or protected your capital from a costly mistake, this work has served its purpose. Thank you for reading. 🙏
Education 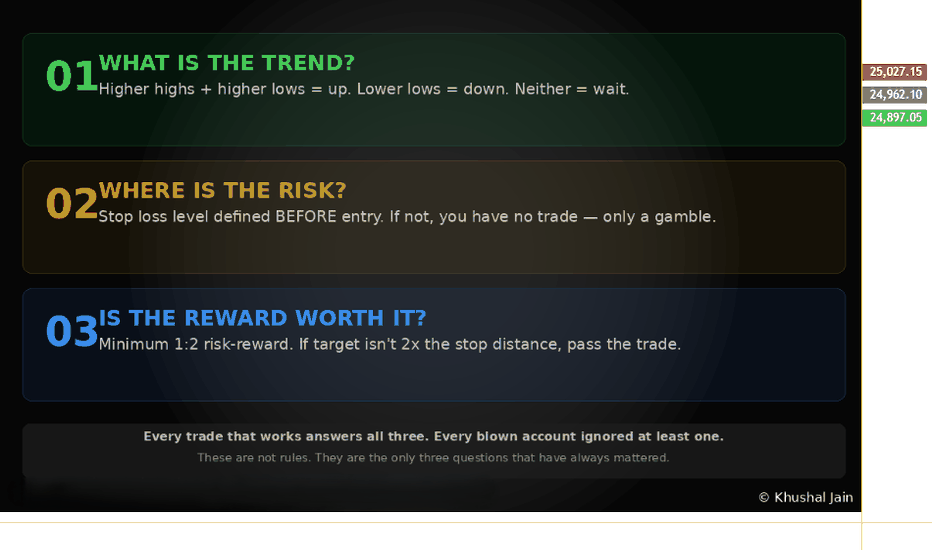
 Short
Short
 Long
Long
Gold Under Hyper-Contraction Just Before a Major ExpansionProbable Scenario Analysis:
⏺ Present Scenario:
Presently, Gold TVC:GOLD is in a hyper-contraction phase. There are two visible contraction chart patterns observable in the chart. The first pattern is a head-and-shoulder (H&S) pattern. The second pattern is a rising parallel channel. Technically, gold is flat and making too random moves. There is no trend confirmation yet.
🟢 Bullish Scenario
There is no bullish scenario. Doubt every upmove. However, if the price decisively sustains above 4425, then a bullish setup might emerge. The probable bullish target above 4425 would be - 4450.
🔴 Bearish Scenario
Gold has entered into the shorting zone. If we look at the rising parallel channel, we can see that the price is trading within the lower control limit (LCL) of the channel. It is a sign of weakness. Also, there is a probable formation of an H&S pattern. Stay bearish below 4400. The probable targets below 4400 would be - 4375, 4350, 4325, and 4300.
🟡 No Trading Zone: (4425 - 4400).
● Intraday, Weekly, and Monthly Bias
Establish bias with respect to the opening price (of the particular session - Intraday, Weekly, and Monthly). If the price sustains above the opening price, then don't think of shorting. Look for bullish trades only. On the contrary, if the price sustains below the opening price, then don't think of going long. Look for bearish trades in that case.
● Disclaimer + End Note
- All the analyses would fail in the case of a major gap up, gap down, or price structure anomaly. Thus, practice PRAGMATISM in the live session.
- Trade only if there is a set-up. Remember, not trading is an extension of the trading activity.
- Mark your points. Trade your points. Price is GOD. Anything can happen in the markets. Thus, trade what you see, not what you believe.
- Always PRACTICE RISK MANAGEMENT. Always PROTECT YOUR CAPITAL. Be RESPONSIBLE.
- Be Strategic. Be Courageous. Be Patient. Be Wise.
- Every day is a new day. Thus, do not carry the baggage of past successes or failures. Leave the gardens of winning and losing. Establish yourself in equanimity. Always think from a new perspective.
- Let the joy of trading drive your effectiveness, not greed or fear. Believe in Possibilities.
Happy Trading! INFY — Wedge Breakout Confirmed, Targeting 1,278 and 1,377Overview
Infosys is trading at 1,190.7, up 0.65%, continuing its recovery after confirming a falling wedge breakout. This follows a multi-month decline from the January high of 1,728 and a successful hold of the ₹1,000 psychological support and wedge apex earlier this year.
Previous Idea Recap
This setup follows our earlier idea, "INFY: Falling Wedge Apex at ₹1,000 Psychological Support Test," where we flagged the wedge apex + ₹1,000 confluence as key support. That level held (low of 982.40), and the stock has since broken above wedge resistance, confirming the bullish reversal thesis, marked as Target Achieved ✅ in the update.
This new idea builds on that structure, tracking the next resistance levels as INFY continues its recovery.
Pattern Explanation
The falling wedge that formed from the January high has fully resolved to the upside. Price has climbed steadily off the ₹1,000 confluence zone, consolidated near the recent swing low around 1,107, and has since pushed higher with strength. With the immediate wedge resistance cleared, focus now shifts to the next resistance levels mapped from the decline.
Trade Setup
Entry: Buy on every dip
Stop Loss / Invalidation: 1,107 (recent swing low)
Target 1: 1,278
Target 2: 1,377
Key Levels
Target 1: 1,278
Target 2: 1,377
Resistance (higher): 1,586, then 1,728 (origin of the decline)
Invalidation / Swing Low Support: 1,107
Major Support: 982 (deeper swing low)
Scenarios
If INFY holds above 1,107 (recent swing low) on any pullback, the path stays open toward 1,278, and eventually 1,377 on continued strength.
If price closes below 1,107, it would suggest the recovery needs more time to consolidate, with the 982 swing low remaining the larger structural support.
Beginner's Lesson
A swing low is simply the most recent point where price stopped falling and reversed higher. Traders often use this level, rather than a fixed indicator, as their invalidation point because it reflects actual buying interest that showed up at that price. If a stock breaks clearly below its most recent swing low, it's a sign the recovery structure may be weakening, regardless of where the moving averages sit.
Conclusion
INFY continues to build on its confirmed wedge breakout, working through resistance levels step by step. As long as price holds above the 1,107 swing low, the structure favors further upside toward 1,278 and 1,377.
This is for educational purposes only and not investment advice. Please do your own research or consult a financial advisor before making any trading decisions.  Long
Long
#NIFTY Intraday Support and Resistance Levels - 12/08/2026Nifty is expected to open flat, with the index likely to continue trading in a consolidation zone around the 24,450–24,550 levels. There are no major changes in the existing levels, with 24,550 acting as the immediate resistance and 24,450 as the key support.
If Nifty sustains above 24,550, buying can be considered with targets of 24,650, 24,700 and 24,750+. On the downside, a break below 24,450 can trigger selling towards 24,350, 24,300 and 24,250.
Overall, the market is expected to remain range-bound with consolidated movements. Traders should avoid aggressive positions inside the consolidation zone and wait for a decisive breakout above 24,550 or breakdown below 24,450 for the next directional move.  Long
Long
Nifty 50 Weekly Outlook: Support Broken, Watching the Next MoveOverview
Nifty had a rough week, falling 2.33% and closing at 23,767.45. This breaks a support zone that had held for weeks, so the story going into this coming week is different from before — we're now watching whether this becomes a deeper pullback or just a shakeout before recovery.
What's Happened
The trendline support and horizontal support zone (around 23,817) that had held multiple times finally gave way this week. Price is now sitting below both, at 23,767.45. This is a genuine shift — support that was reliable for a while has now broken.
Key Levels for the Week Ahead
Immediate Zone to Watch: 23,606–23,767 (this week's range)
Next Support Level: 23,070 (Major Support)
Resistance Above: 24,353 (50 Weekly EMA), then 24,601–24,989 further up
Bigger Support Below: 22,233 (200 Weekly EMA) — still a good distance away
Two Ways This Week Could Go
If price stabilizes and holds above 23,606: This would suggest last week's fall was a shakeout rather than the start of a bigger decline, and a recovery attempt back toward 24,000+ becomes possible.
If price breaks below 23,606: This would confirm more weakness, with 23,070 (Major Support) as the next real level to watch. A break below that too would then bring the 200 Weekly EMA (22,233) into focus.
What We're Watching Closely
The first couple of sessions this week matter a lot. A quick recovery back above the broken support (23,817) would be a good sign buyers are stepping back in. A continued slide, especially with more red weekly candles, would confirm the breakdown is real.
Beginner's Lesson
When a well-tested support level finally breaks, it doesn't automatically mean disaster — but it does mean the balance of power has shifted, at least for now. The right response isn't to panic or assume the worst, but to watch closely for the next few sessions and let price tell you whether this is temporary or the start of something bigger.
Conclusion
Nifty enters this week at an important decision point after breaking a key support zone. As always, we're watching for confirmation rather than assuming either direction. We'll keep tracking this and post updates as the week develops.
For educational purposes only. Not financial advice. Always manage your risk. NIFTY: Trendline Support Holds — Can Buyers Reclaim 24,050 ?Overview
NIFTY found support near the rising trendline once again, keeping the broader structure intact for now. However, price is still trading below the short-term moving averages, suggesting buyers need further confirmation before momentum can improve.
The next session is likely to revolve around whether the index can reclaim the nearby resistance cluster.
Key Levels
🟢 Support
23,817 – Immediate support
23,606 – Trendline support
23,070 – Major structural support
🔴 Resistance
23,980 – 50 EMA
24,370 – 200 EMA
24,041–24,053 – Daily Balance Zone / Weekly Rolling VWAP
24,050 – 15-minute Weekly Rolling VWAP
24,602 – Higher resistance
What to Watch Tomorrow
🟢 Bullish Scenario
If buyers continue defending the trendline and reclaim the 24,041–24,053 resistance area with acceptance, the market may attempt to retest the 50 EMA (23,980) and later the 200 EMA (24,370). A sustained move above these levels would strengthen the short-term structure.
🔴 Bearish Scenario
If price loses 23,817, attention shifts to the trendline support near 23,606. A break below this area would expose the next major support around 23,070.
Market Structure
The rising trendline remains an important reference. As long as it holds, buyers still have an opportunity to rebuild momentum. The key question for the next session is whether price can reclaim the nearby resistance cluster or continue respecting it as supply.
Educational market structure discussion only. Not investment advice. NIFTY: Trendline Holds — Eyes on the 200 EMAOverview
NIFTY respected the rising trendline highlighted in the previous analysis and delivered a strong recovery, confirming that buyers continue to defend the higher-low structure. The rally has successfully reclaimed the 50 EMA and moved back above the 14-Day Rolling VWAP, but the index is now approaching the Daily 200 EMA, which aligns closely with the descending trendline.
This creates an important decision zone for the next session.
Key Levels
🟢 Support
24,070 – 14-Day Rolling VWAP
24,065 – Weekly Rolling VWAP (15-minute)
24,040 – Lower Balance Zone
23,817 – Immediate support
23,606 – Rising trendline support
🔴 Resistance
24,369 – Daily 200 EMA
Descending trendline
24,602 – Previous swing high
24,698 – Upper Balance Zone
What to Watch Tomorrow
🟢 Bullish Scenario
If buyers reclaim and sustain above the Daily 200 EMA (24,369), the breakout could open the path toward 24,602. Acceptance above this level would bring the Upper Balance Zone (24,698) into focus and further strengthen the short-term structure.
🔴 Bearish Scenario
If sellers defend the 200 EMA and the descending trendline, watch the 24,070–24,040 support cluster closely. This area combines the 14-Day Rolling VWAP, Weekly Rolling VWAP, and the Lower Balance Zone. A loss of this zone could lead to a pullback toward 23,817, while a break below that would shift attention back to the rising trendline near 23,606.
Market Structure
The previous analysis correctly identified the rising trendline as the key support, and today's session confirmed its importance. The short-term structure has improved with the recovery above the 50 EMA and the 14-Day Rolling VWAP, but the Daily 200 EMA and the descending trendline remain the next major hurdles. Tomorrow's reaction around this resistance cluster is likely to determine whether the recovery extends or pauses.
Educational market structure discussion only. Not investment advice.