#BANKNIFTY Intraday PE & CE Levels(23/07/2026)Bank Nifty is expected to witness a flat opening with mixed global cues and no major overnight trigger. After yesterday's sharp decline, the index is attempting to stabilize near the 57050–57150 support zone. Traders should wait for confirmation around key levels before taking fresh positions.
If Bank Nifty sustains above 57050–57100 after the opening, traders can consider buying CE options with upside targets of 57250, 57350, and 57450. A decisive breakout above 57550 will further strengthen the bullish momentum and can extend the rally towards 57750, 57850, and 57950+.
On the downside, if Bank Nifty fails to hold 57050 and slips below this support, traders can consider buying PE options with downside targets of 56850, 56750, and 56650. Fresh selling pressure below this level may accelerate the ongoing bearish trend.
Overall, a flat opening is expected with volatility likely to remain high during the initial session. As long as Bank Nifty holds above the 57050–57100 support zone, a pullback towards higher resistance levels remains possible. Traders should wait for confirmation near the opening range, maintain strict stop-losses, and avoid aggressive trades until a clear breakout or breakdown occurs. Technical AnalysisCore of Technical Analysis
Technical Analysis is the study of past price movements, volume, and market trends to predict future price direction.
3 Main Principles:
Market Discounts Everything
All news, emotions, and fundamentals are already reflected in price.
Prices Move in Trends
Markets usually move in uptrend, downtrend, or sideways trends.
History Repeats Itself
Human psychology creates repeating chart patterns.
Key Tools:
Charts (Candlestick, Line, Bar)
Support & Resistance
Trendlines
Indicators (RSI, MACD, Moving Averages)
 Education

 Education

Education
Trading Masterclass #1Institutional trading means trading like hedge funds, banks, prop firms, and professional desks. They do not trade based on emotions, random tips, or gambling. They use systems, probabilities, risk control, position sizing, discipline, and psychology.
Retail traders often lose because they focus only on “entry.” Institutions focus on:
Risk Management
Capital Protection
Position Sizing
Probability
Psychology
Consistency
Repeatable Edge
In options trading, if you think like institutions, your results can improve significantly  Education

 Education

 Education

Education
 Education

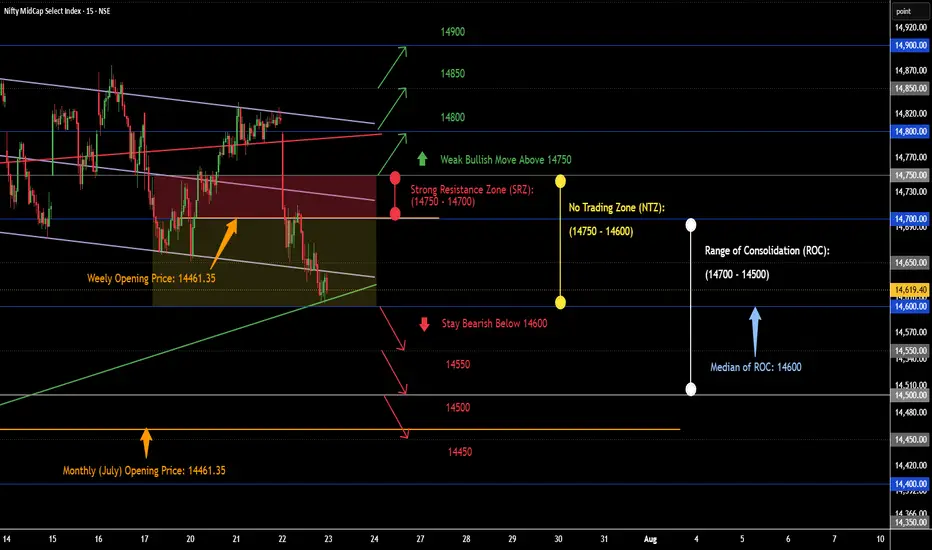
Nifty MidCap Select Trade Plan [23.07.2026: Thursday]Probable Scenario Analysis and Trade Plan for the Nifty MidCap Select Index NSE:NIFTY_MID_SELECT for the 23rd of July, 2026. The day is Thursday.
🟢 Bullish Scenario
There is no observable bullish setup. Doubt every up move. In fact, an up move will act as an opportunity to short the market. However, if the price breaks out above 14750, then a weak bullish move can be expected. The probable weak bullish targets above 14750 would be - 14800, 14850, and 14900.
🔴 Bearish Scenario
Presently, the price is in a bearish phase. Stay bearish if the price remains below 14600. The probable bearish targets below 14600 would be - 14550 and 14500. The price would receive strong support at 14500. Next, if the price decisively breaks down below 14500, then the probable bearish targets would be - 14450. The price would receive good support at 14450 as there is an unfilled gap and the monthly (July) opening price at 14461.35. Thus, it can be estimated that the price would receive support clustered in the zone of 14450.
🟡 No Trading Zone (NTZ): (14750 - 14600).
Here, the zone (14750 - 14700) is a super strong resistance. It is very difficult for the price to break out above this zone.
⏺ Range of Consolidation (ROC): (14700 - 14500).
Here, 14600 is the median of the ROC. The median works like an intraday sentiment evaluator. The price trading above the median would offer bullish sentiment, while the price trading below the median would trigger bearish sentiment within the ROC.
● Event
No high-impact event this week. One medium-impact event is the Euro Interest Rate Decision on 23rd July (Thursday). No holidays this week. There is a SENSEX weekly expiry. Lastly, geopolitical issues are omnipresent.
● Intraday, Weekly, and Monthly Bias
Establish bias with respect to the opening price (of the particular session - Intraday, Weekly, and Monthly). If the price sustains above the opening price, then don't think of shorting. Look for bullish trades only. On the contrary, if the price sustains below the opening price, then don't think of going long. Look for bearish trades in that case.
● Disclaimer + End Note
- All the analyses would fail in the case of a major gap up, gap down, or price structure anomaly. Thus, practice PRAGMATISM in the live session.
- Trade only if there is a set-up. Remember, not trading is an extension of the trading activity.
- Mark your points. Trade your points. Price is GOD. Anything can happen in the markets. Thus, trade what you see, not what you believe.
- Always PRACTICE RISK MANAGEMENT. Always PROTECT YOUR CAPITAL. Be RESPONSIBLE.
- Be Strategic. Be Courageous. Be Patient. Be Wise.
- Every day is a new day. Thus, do not carry the baggage of past successes or failures. Leave the gardens of winning and losing. Establish yourself in equanimity. Always think from a new perspective.
- Let the joy of trading drive your effectiveness, not greed or fear. Believe in Possibilities.
Happy Trading!  Long
Long
Nifty 50 Trade Plan [23.06.2026: Thursday]Probable Scenario Analysis and Trade Plan for the Nifty 50 Index NSE:NIFTY for the 23rd of July, 2026. The day is Thursday.
🟢 Bullish Scenario
There is no observable bullish setup. Doubt every up move. In fact, an up move will act as an opportunity to short the market. However, if the price breaks out above 24200, then a weak bullish move can be expected. The probable weak bullish targets above 24200 would be - 24250 and 24300. Next, if the price sustains above 24300, then the probable bullish targets would be 24350 and 24400.
🔴 Bearish Scenario
Presently, the price is in a bearish phase. Stay bearish if the price remains below 24000. The probable bearish targets below 24000 would be - 23950 and 23900. The price would receive strong support at 23900 as there is an unfilled gap and monthly opening (23897.65) in the same zone. Next, if the price decisively breaks down below 23900, then the probable bearish targets would be - 23850, 23800, and 23750.
🟡 No Trading Zone (NTZ): (24200 - 24000).
Here, the zone (24200 - 24100) is a super strong resistance. It is very difficult for the price to break out above this zone.
⏺ Range of Consolidation (ROC): (24200 - 23900).
Here, 24000 is the median of the ROC . The median works like an intraday sentiment evaluator. The price trading above the median would offer bullish sentiment, while the price trading below the median would trigger bearish sentiment within the ROC.
● Event
No high-impact event this week. One medium-impact event is the Euro Interest Rate Decision on 23rd July (Thursday). No holidays this week. There is a SENSEX weekly expiry. Lastly, geopolitical issues are omnipresent.
● Intraday, Weekly, and Monthly Bias
Establish bias with respect to the opening price (of the particular session - Intraday, Weekly, and Monthly). If the price sustains above the opening price, then don't think of shorting. Look for bullish trades only. On the contrary, if the price sustains below the opening price, then don't think of going long. Look for bearish trades in that case.
● Disclaimer + End Note
- All the analyses would fail in the case of a major gap up, gap down, or price structure anomaly. Thus, practice PRAGMATISM in the live session.
- Trade only if there is a set-up. Remember, not trading is an extension of the trading activity.
- Mark your points. Trade your points. Price is GOD. Anything can happen in the markets. Thus, trade what you see, not what you believe.
- Always PRACTICE RISK MANAGEMENT. Always PROTECT YOUR CAPITAL. Be RESPONSIBLE.
- Be Strategic. Be Courageous. Be Patient. Be Wise.
- Every day is a new day. Thus, do not carry the baggage of past successes or failures. Leave the gardens of winning and losing. Establish yourself in equanimity. Always think from a new perspective.
- Let the joy of trading drive your effectiveness, not greed or fear. Believe in Possibilities.
Happy Trading! BTCUSD Retesting Breakout Zone | High-Probability Buy SetupBTCUSD has successfully broken above the 65,600 resistance level after an extended period of consolidation, signaling renewed bullish momentum. Following the breakout, price is now pulling back to retest the breakout zone, which could act as fresh support.
This retest presents a potential buying opportunity if buyers defend the 65,600–65,400 support area.
📈 Trade Setup
Entry Zone: 65,600 – 65,400
Bias: Bullish
Take Profit 1: 66,600
Take Profit 2: 67,000
Final Target: 67,300
Why This Setup?
✅ Clean breakout above a major resistance level.
✅ Healthy pullback to retest previous resistance as new support.
✅ Bullish market structure remains intact.
✅ Favorable risk-to-reward if the support zone holds.
What to Watch
Wait for bullish confirmation inside the support zone, such as a strong bullish candle, increased buying volume, or a break in lower-timeframe bearish structure before entering.
A successful defense of this level could fuel the next leg higher toward 66.6K, 67K, and potentially 67.3K.
Trade smart, manage your risk, and never risk more than you can afford to lose.
💬 Do you think BTC will hold the breakout retest, or is a deeper pullback still ahead? Share your analysis below!
📌 Disclaimer:
This analysis is for educational purposes only and is not financial advice. Always manage risk and follow your trading plan.
Your feedback drives our content and keeps everyone trading smarter. Let’s make those pips together! 🚀
Happy Trading,
– The InvestPro Team Long 
BANDHANBNK: 17% Guidance Crash Meets Multi-Yr Value Demand ZoneOverview : BANDHANBNK (Bandhan Bank Ltd.) is experiencing extreme downside volatility following a massive single-day sell-off of ~17% down to the ₹173.29 zone. A recent guidance cut regarding Return on Assets (RoA) triggered aggressive institutional repricing. While short-term technical indicators reflect severe selling pressure, the steep valuation discount and proximity to multi-year volume profile support render this an intriguing deep-value candidate for a 1-to-3-year investment window.
Technical Analysis and Trend Direction :
Trend Alignment : The technical structure is overwhelmingly bearish across all primary timeframes (4-hour, daily, and weekly) . The stock is trading well below its Moving Average Ribbon (20/50/100/200 EMAs spanning ₹180.79 to ₹204.95).
Momentum Oscillators : The daily RSI has dropped into oversold territory at 30.56 , with the 4-hour RSI deeply oversold at 20.70. While this suggests a potential short-term relief bounce, the broader path of least resistance remains down until structural acceptance is re-established above broken support.
Volume Profile Structure : Price action is currently sitting inside the Value Area (VAL ₹141.46 to VAH ₹199.13), with the high-volume Point of Control (POC) lingering below at ₹150.47 , acting as a strong structural volume magnet.
Key Levels to Watch :
Immediate Resistance Levels : Watch ₹175.95 (swing high) and ₹186.55 (broken support turned resistance).
Macro Resistance Levels : Watch ₹199.13 (Value Area High) and ₹204.95 (top of the MA Ribbon).
Immediate Support Levels : Watch ₹168.88 (broken swing high support) and ₹162.25.
Macro Demand Zone (1–3 Year Accumulation) : Watch ₹150.47 (Volume Profile POC) down to ₹141.46 (Value Area Low) and the 52-week low at ₹134.25.
Fundamental Analysis and Financial History :
Growth and Margins : TTM Revenue stands at ₹244.6B (-2.2% YoY) with Net Income at ₹13.5B (-34.1% YoY). Net profit margin sits at 9.9% compared to the sector median of 21.8%.
Balance Sheet Deleveraging : Despite the growth slowdown, total debt was reduced aggressively by 62.5% in FY2025, bringing the Debt-to-Equity ratio down to a healthy 0.51x.
Annual Performance Trajectory : After expanding revenue by +18.6% in FY2024, top-line growth decelerated to -0.8% in FY2025. Net income contracted by 55.4% in FY2025 following a +23.1% rebound in FY2024.
Valuation Multiples : BANDHANBNK is heavily discounted, trading at a P/E of 20.6x and a P/S of 2.5x, representing a ~31% valuation discount relative to broader private sector banking peers.
Sector Comparison with Peer Stocks :
HDFCBANK : Current Price ₹753.00 (-1.11% 1D), Market Cap ₹11.73T, P/E 14.71x, YoY Revenue Growth +1.8%, Analyst Rating Strong Buy.
ICICIBANK : Current Price ₹1,441.80 (-1.46% 1D), Market Cap ₹10.50T, P/E 18.64x, YoY Revenue Growth +5.1%, Analyst Rating Strong Buy.
AXISBANK : Current Price ₹1,237.40 (-1.65% 1D), Market Cap ₹3.91T, P/E 13.91x, YoY Revenue Growth +4.1%, Analyst Rating Strong Buy.
KOTAKBANK : Current Price ₹380.60 (-1.39% 1D), Market Cap ₹3.84T, P/E 18.65x, YoY Revenue Growth +5.9%, Analyst Rating Strong Buy.
Peer Takeaway : While larger peers like ICICIBANK and KOTAKBANK exhibit stronger top-line growth and positive weekly momentum, BANDHANBNK offers the steepest valuation discount and turnaround potential once credit costs normalize.
Directional Bias and 1-to-3 Year Holding Strategy: Bearish near-term, but cautiously bullish on a 1-to-3-year horizon.
Short-Term Strategy : Chasing shorts at oversold levels carries short-squeeze risk. Wait for a retest of broken resistance near ₹175.95 to ₹186.55 to manage risk.
Long-Term Strategy : Catching falling knives during a guidance cut is risky. The optimal long-term strategy is phased accumulation near the major volume profile demand zone between ₹141.46 and ₹150.47 (POC/VAL). A sustained weekly close back above ₹186.55 will confirm structural trend stabilization.
Disclaimer:
This analysis is for educational purposes only and does not constitute financial advice. Always perform your own research and manage your risk/position sizing accordingly.  Long
Long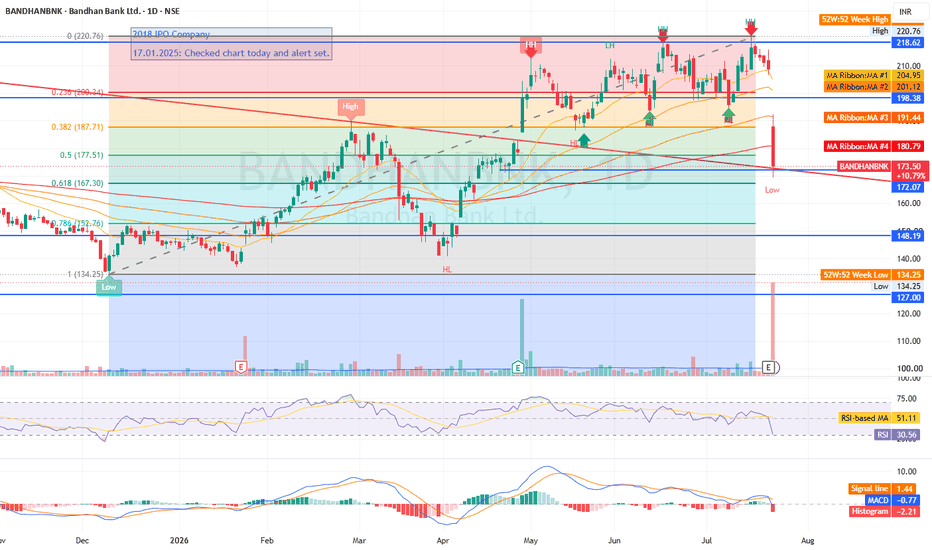
Gold - Technical And Quantitative Analysis CollaborationUpon zooming in on gold's chart on a 3-month timeframe, I made some very interesting observations........
Since 1970 - till 2026, I have identified 3 major bull runs in gold
- And every bull run has followed a rhythm.
- Each bull run lasts roughly 10 years.
- Each cycle inside the bull run expands close to +169%.
- And these inside cycles are compressing every decade
• The 1st bull run completed 3 full cycles.
• The 2nd bull run completed 2 cycles.
• The 3rd bull run (if it has topped) barely stretched to around 1.5 cycles.
• 3 → 2 → 1.5
Now the crucial point is that
- Each time a corrective trend is observed after the completion of every 10-year bull period
And the most interesting discovery of the analysis is that - the current bull cycle ends in Feb 2026
Logically speaking, if momentum compresses with every expansion, the exhaustion phase should arrive sooner.
Now technically, prices have breached the ascending wedge, made highs above 5200, testing resistance at fib ext 2.168 (5184), but still have not re-tested the wedge to confirm the pattern breakout.
Hence, to play out the pattern, gold could decline toward a major confluence zone:
• Convergence of the red trendlines of the ascending wedge
• Fibonacci 1.618 projection
• Major structural support
That zone sits near 3600.
If gold corrects toward that level, I believe it won’t be the end.
It could simply be the reset to begin the next 10-year spell. Short 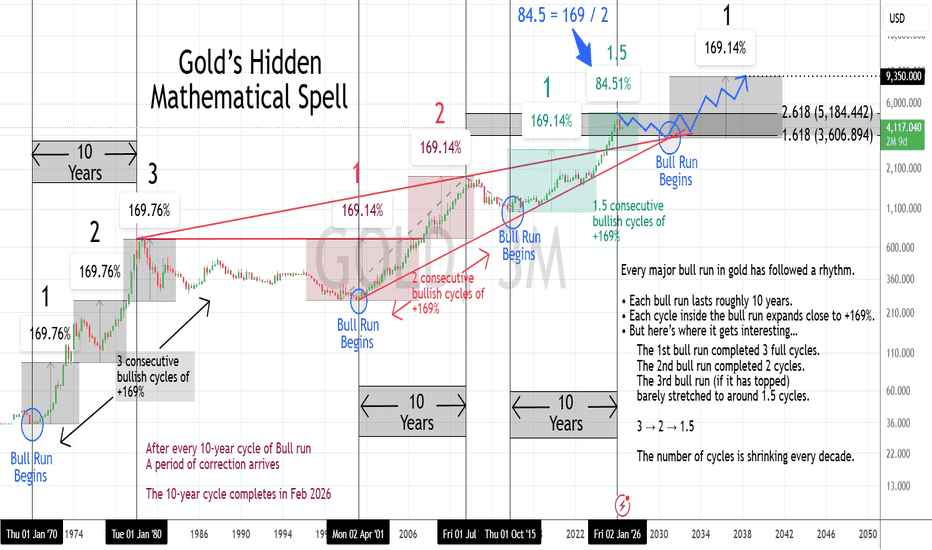
SBC EXPORTS: High-Momentum Textile Rally Meets Premium ValuationOverview :
SBC Exports Limited (NSE: SBC) is showcasing exceptional multi-timeframe bullish momentum, currently trading near the ₹42.16 zone. The stock has delivered an impressive multi-bagger performance over the past year (+149.7%), driven by aggressive revenue expansion and repeat corporate order wins. However, trading significantly above its historical value area, it represents a classic high-growth, high-risk proposition.
Technical Trend Direction & Key S/R Levels :
Trend Direction : The technical structure remains firmly bullish across the short, medium, and long-term horizons (aligned Buy ratings on 4h, daily, and weekly charts), supported by a rising moving average ribbon and strong volume accumulation.
Key Resistance : Immediate overhead supply sits at the macro ascending trendline around ₹45.58. A decisive weekly close above this barrier opens the path for extended price discovery.
Key Support : The immediate structural safety net rests at the Value Area High (VAH) shelf near ₹29.12, with major deeper multi-year support anchored around the ₹24.27 swing low and the Point of Control (POC) at ₹14.03.
Fundamental Analysis & Valuation :
Growth vs. Leverage : SBC operates as a leveraged growth play. TTM revenue surged +34.4% YoY to $4.0B, and net income jumped +87.4% to $342M with a solid net margin of 8.5%. However, this comes with financial strain—total debt and a high debt-to-equity ratio of 2.83 require close monitoring alongside negative free cash flow trends.
Valuation Multiples : The growth comes at a steep price. SBC trades at a P/E multiple of 58.9 and an EV/EBITDA of 66.4, placing it at a substantial premium compared to industry medians.
Sector Comparison :
When compared against textile peers like WELSPUNLIV (Welspun Living), ARVIND, and GHCLTEXTIL, SBC commands the highest 1-year return and top-line growth rate (+34.4% YoY vs peers). However, peers like Arvind offer a more balanced profile with a moderate P/E of 33.2 and "Strong Buy" consensus ratings, whereas SBC trades at the highest valuation multiple in the group.
Directional Bias & 1–3 Year Outlook (Levels to Watch) :
Bias: BULLISH WITH CAUTION (1–3 Year Horizon)
Strategy : For a 1 to 3-year holding window, momentum favors the buyers as long as macro support structures hold. Chasing aggressively at current extended levels carries mean-reversion risk; a disciplined approach involves waiting for a breakout confirmation above ₹45.58 or scaling in on healthy pullbacks toward the ₹29.12 value area.
Disclaimer: This analysis is for educational purposes only and does not constitute financial advice. Always perform your own research and manage your risk accordingly.  Long
Long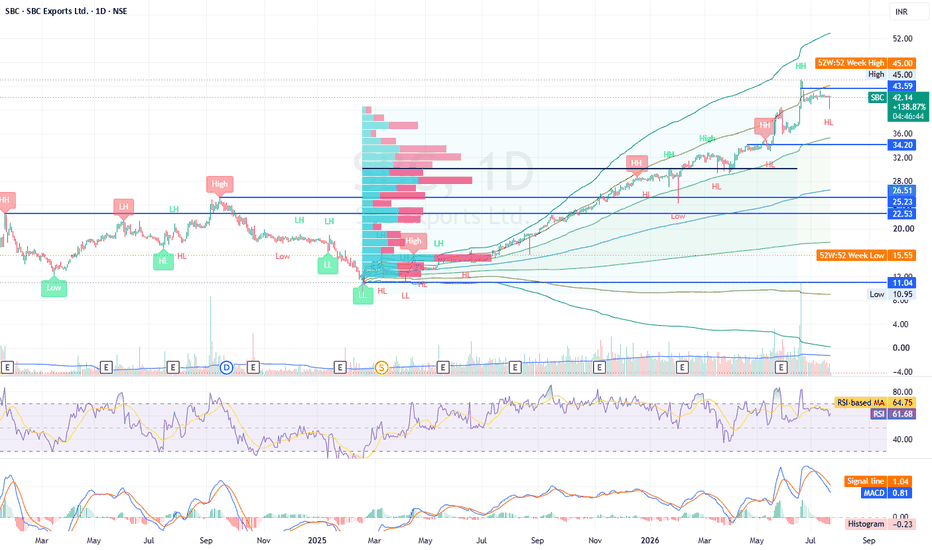
#BANKNIFTY Intraday PE & CE Levels(22/07/2026)Bank Nifty is expected to witness a flat opening with mixed global cues and no significant overnight trigger. The index is consolidating around the 57800 zone after the recent rally, suggesting that traders should wait for a confirmed breakout or breakdown before initiating fresh positions.
If Bank Nifty sustains above 57550–57600 after the opening, traders can consider buying CE options with upside targets of 57750, 57850, and 57950. A decisive breakout above 58050 will confirm renewed bullish momentum and can extend the rally towards 58250, 58350, and 58450+.
On the downside, if Bank Nifty faces rejection near 57950–57900 and slips lower, traders can consider buying PE options with downside targets of 57750, 57650, and 57550. A sustained breakdown below 57450 will strengthen the bearish bias and may drag the index towards 57250, 57150, and 57050.
Overall, a flat opening is expected with range-bound movement likely during the initial session. As long as Bank Nifty holds above the 57550–57600 support zone, buying on dips remains the preferred strategy. Traders should wait for confirmation around the opening range, avoid chasing trades in the middle of the range, and follow strict stop-losses while booking profits at the mentioned target levels. HDFC Bank — Fourth Test of a Multi-Year TrendlineOverview
HDFC Bank has just fallen sharply this week (-7.09%), and this drop is bringing it down toward a trendline that's been holding since 2022. This trendline has already been tested three times before — and now it's headed for a fourth test, right around the 732 zone.
What's Happening
Looking at the weekly chart, there's a rising trendline connecting the lows going all the way back to 2022. Price has tested this trendline three times already (marked on the chart), and each time it has held. Now, after this week's sharp fall, price is heading toward the trendline for a fourth time.
The more times a trendline gets tested and holds, the more traders tend to watch and respect that level — but it's also fair to note that each additional test can increase the risk of an eventual failure too. A trendline doesn't hold forever.
Key Levels to Watch
Trendline Support (4th test approaching): 732
Resistance above (recent swing high): 843
Current price: 761.45
Two Ways This Can Go
If the trendline holds a fourth time: That would be an impressive track record for this level, and a bounce from here would likely head back toward the 843 resistance zone.
If the trendline finally breaks: A weekly close well below 732 would be a meaningful development — the first failure of this level in over three years — and would open the door to levels well below anything seen on this trendline so far.
Beginner's Lesson
Every extra time a trendline holds adds to its credibility, but it doesn't guarantee the next test will go the same way. In fact, some traders get caught off guard exactly because a level "always held before" — right before the one time it doesn't. This is why watching for confirmation, especially after a sharp move like this week's, matters more than assuming history repeats.
Conclusion
HDFC Bank is heading into an important fourth test of a multi-year trendline, right after a sharp weekly fall. As always, we're watching for confirmation rather than assuming either outcome.
For educational purposes only. Not financial advice. Always manage your risk. HAL Symmetrical Triangle Breakout Watch_______________________________________
📊 Hindustan Aeronautics Ltd. (HAL): Daily Technical Snapshot – Symmetrical Triangle Breakout Watch
📊 STWP Technical Analysis
________________________________________
MARKET STRUCTURE SNAPSHOT | NSE: HAL | DAILY
Closing Price: ₹4,581.70 (+₹90.70 | +2.02%)
Core Trend: Strong Uptrend
Market State: Consolidation Within Uptrend
Price Structure: Price is consolidating inside a Symmetrical Triangle, following a strong prior advance. The recent Bullish Engulfing candle suggests improving buying interest as the stock approaches the upper boundary of the pattern.
________________________________________
OPERATIONAL PRICE GRID & KEY REFERENCE LEVELS
Model Reference Level: ₹4,594.00
Hard Invalidation Level: ₹4,155.20
Structural Risk: ₹438.80 (9.55%)
Resistance Levels: R1 ₹4,630.00 | R2 ₹4,678.30 | R3 ₹4,762.60
Support Levels: S1 ₹4,497.40 | S2 ₹4,413.10 | S3 ₹4,364.80
Range Structure: Low ₹4,155.20 | High ₹4,762.60
Higher Timeframe Observation Zones: ₹4,678 | ₹4,763 | ₹4,900
________________________________________
MOMENTUM, PARTICIPATION & CPR DATA
Volume Profile: 697.57K Shares
Volume Character: Normal Relative Participation
RSI: 63.43 (Strong Momentum Zone)
ADX: 11.59 (Low Trend Strength – Compression Phase)
ROC: +4.12%
MACD Status: Strong Positive Momentum Structure
CCI: +173.39 (Strong Bullish Momentum)
Stochastic Reading: 95.73 (Extended Momentum Zone)
Current Bias: WAIT FOR BREAKOUT CONFIRMATION
CPR State: Bullish Zone | CPR Moving Up (Narrow)
Today's CPR: Pivot ₹4,489.00 | Top ₹4,490.00 | Base ₹4,488.00
Tomorrow's CPR (Projected): Pivot ₹4,545.70 | Top ₹4,563.70 | Base ₹4,527.70
________________________________________
📚 EDUCATIONAL OBSERVATION
Hindustan Aeronautics Ltd. (HAL) continues to trade within a Symmetrical Triangle, a consolidation pattern that often develops after a strong trending move. The formation of higher lows alongside lower highs indicates that buyers and sellers are gradually reaching equilibrium, leading to price compression before the next significant directional move.
The recent Bullish Engulfing candlestick near the rising trendline reflects renewed buying interest and suggests that buyers are attempting to challenge the upper boundary of the triangle. However, the pattern remains under development, and a decisive breakout above the resistance trendline, supported by stronger-than-average volume, would provide stronger confirmation of a potential continuation of the broader uptrend.
Momentum indicators continue to remain constructive. The RSI at 63.43 reflects healthy bullish momentum, while the MACD remains positive, indicating sustained upside strength. The ROC of +4.12% signals improving price acceleration, and the CCI reading of +173.39 confirms strong buying momentum. The Stochastic reading of 95.73 highlights continued participation, although elevated momentum levels may also lead to short-term consolidation before the next directional move. Meanwhile, the ADX at 11.59 indicates that the market is currently in a compression phase, which is common during triangle formations.
The projected Central Pivot Range (CPR) for the next trading session has shifted higher, with the projected Pivot at ₹4,545.70. A rising CPR reflects improving market acceptance of higher prices and supports the prevailing bullish bias.
Immediate technical attention remains on the resistance zone between ₹4,630 and ₹4,678, which also coincides with the upper boundary of the Symmetrical Triangle. A sustained breakout above this region could strengthen the existing bullish structure and bring the higher-timeframe observation zones near ₹4,763 and ₹4,900 into focus. On the downside, ₹4,497 remains the first important support, while the structural invalidation level is positioned near ₹4,155.
________________________________________
🏢 BUSINESS & FUNDAMENTAL UPDATE
Hindustan Aeronautics Ltd. (HAL) remains India's largest aerospace and defence manufacturer, benefiting from the Government of India's continued focus on defence modernisation and indigenous manufacturing under the Govt. initiative. The company maintains a strong order book across fighter aircraft, helicopters, engines and defence systems, providing healthy long-term revenue visibility. Increasing defence capital expenditure, export opportunities and sustained execution of major defence programmes continue to support HAL's long-term growth outlook.
________________________________________
📖 Educational Note
Support and resistance levels should be treated as observation zones rather than predictive targets. Chart patterns, price action, volume analysis, momentum indicators and CPR are educational tools that help market participants understand evolving market structure within a disciplined risk-management framework.
________________________________________
⚠️ Disclaimer
This analysis is provided strictly for educational and informational purposes.
It does not constitute financial, investment or trading advice and should not be interpreted as a recommendation to buy or sell any security.
Investments in the stock market are subject to market risks, including the possible loss of capital.
Historical performance, business developments, chart patterns and technical indicators do not guarantee future outcomes.
Please conduct your own research and consult a SEBI-registered investment adviser before making investment decisions.
STWP assumes no responsibility or liability for any financial loss arising directly or indirectly from the use of this analysis.
 Long
Long
TVSMOTOR Rising Wedge Recovery Strong Q1 FY27 Earnings📊 TVS Motor Company: Daily Technical Snapshot – Rising Wedge Recovery & Strong Q1 FY27 Earnings
📊 STWP Technical Analysis
________________________________________
MARKET STRUCTURE SNAPSHOT | NSE: TVSMOTOR | DAILY
Closing Price: 3,792.00 (+201.80 | +5.62%)
Core Trend: Strong Uptrend
Market State: Recovery Within Uptrend
Price Structure: Price has rebounded strongly after forming a Bullish Engulfing near the rising support trendline and is now attempting to break above the descending resistance of a Rising Wedge consolidation. The recovery is supported by improving momentum, healthy volume participation and strong quarterly earnings.
________________________________________
OPERATIONAL PRICE GRID & KEY REFERENCE LEVELS
Model Reference Level: 3,810.00
Hard Invalidation Level: 3,260.70
Structural Risk: 549.30 (14.42%)
Resistance Levels: R1 3,875.73 | R2 3,959.47 | R3 4,108.93
Support Levels: S1 3,642.53 | S2 3,493.07 | S3 3,409.33
Range Structure: Low 3,260.70 | High 4,108.93
Higher Timeframe Observation Zones: 3,960 | 4,109 | 4,250
________________________________________
🏢 BUSINESS & FUNDAMENTAL UPDATE
TVS Motor reported a strong Q1 FY27 performance, exceeding market expectations across revenue, profitability and margins. Standalone revenue increased 38% YoY to 13,896 crore, while net profit rose 51% YoY to a record 1,174 crore. EBITDA grew 41%, with margins expanding to 12.8%, despite concerns over rising input costs and a higher EV mix. The company also recorded its highest-ever quarterly vehicle sales of 1.63 million units, driven by robust growth across motorcycles, scooters, exports and electric vehicles, with EV sales surging 86% YoY. The Board also declared plans to raise up to 1,000 crore through debt instruments. The stronger-than-expected earnings, improving margins and record sales provided a positive fundamental backdrop to the stock's ongoing technical recovery and trendline breakout attempt.
________________________________________
⚠️ MOMENTUM, PARTICIPATION & CPR DATA
Volume Profile: 2.39 Million Shares
Volume Character: Strong Relative Participation
RSI: 65.36 (Strong Momentum Zone)
ADX: 18.85 (Trend Strength Improving)
ROC: +2.14%
MACD Status: Fresh Bullish Crossover
CCI: +127.60 (Positive Momentum)
Stochastic Reading: 93.64 (Extended Momentum Zone)
Current Bias: BUY ON PULLBACKS AFTER BREAKOUT CONFIRMATION
CPR State: Bullish Zone | CPR Moving Down (Narrow)
Today's CPR: Pivot 3,586.70 | Top 3,588.40 | Base 3,584.90
Tomorrow's CPR (Projected): Pivot 3,726.30 | Top 3,759.10 | Base 3,693.40
________________________________________
📚 EDUCATIONAL OBSERVATION
TVS Motor has staged a strong recovery after forming a Bullish Engulfing candlestick near the lower boundary of its rising support trendline. The stock is now testing the upper boundary of a Rising Wedge consolidation, signalling that buyers have regained control following a brief corrective phase. The recent price action indicates that selling pressure has gradually weakened while demand has improved near key support levels. The strong bullish candle, combined with improving momentum indicators, reflects renewed buying interest. However, the trendline breakout is still in progress, and confirmation would require sustained trading above the wedge resistance, preferably supported by stronger-than-average trading volume.
Momentum indicators continue to improve. The RSI at 65.36 reflects healthy bullish momentum without entering an extreme overbought zone. MACD has generated a fresh bullish crossover, suggesting strengthening upside momentum, while the ROC of +2.14% indicates improving price acceleration. The CCI reading of +127.60 confirms positive buying momentum, and the Stochastic reading of 93.64 highlights sustained participation. While momentum remains constructive, elevated readings may also result in short-term consolidations after a sharp advance. The projected Central Pivot Range (CPR) for the next trading session has shifted higher, with the projected Pivot at 3,726.30. A higher CPR reflects improving market acceptance of higher prices and supports the prevailing bullish structure as long as prices remain above key support levels. Immediate attention remains focused on the resistance zone between 3,876 and 3,959, which also coincides with the upper boundary of the Rising Wedge. A decisive close above this region, supported by improving participation, would confirm the breakout and could shift attention towards the higher-timeframe observation zones near 4,109 and 4,250. On the downside, 3,643 remains the first important support, while the structural invalidation level is positioned near 3,261.
________________________________________
📖 Educational Note
The combination of strong quarterly earnings, record vehicle sales, margin expansion, and a technical recovery within a Rising Wedge provides a constructive backdrop for the stock. However, from a technical perspective, the current setup will be considered fully confirmed only if price sustains above the wedge resistance with continued participation. Support and resistance levels should be treated as observation zones rather than predictive targets. Technical analysis and financial results are educational tools that help investors evaluate market structure and business performance within a disciplined risk-management framework.
________________________________________
Disclaimer
This analysis is provided strictly for educational and informational purposes.
It does not constitute financial, investment or trading advice and should not be interpreted as a recommendation to buy or sell any security. Investments in the stock market are subject to market risks, including the possible loss of capital. Historical performance, financial results, chart patterns and technical indicators do not guarantee future outcomes. Please conduct your own research and consult a SEBI-registered investment adviser before making investment decisions. STWP assumes no responsibility or liability for any financial loss arising directly or indirectly from the use of this analysis.
 Long
Long
 Long
Long