

Trading AnalysisWhere is Nifty right now?
Nifty closed at 23,689 on Thursday May 14. After a brutal fall earlier this week (it touched ~23,300), it bounced back for 2 days in a row. So right now it's in a recovery mood — but it hasn't really "fixed" itself yet. Think of it like someone who had a fever, now feeling slightly better, but not fully healthy.
2 What's the wall above? (Resistance)
If Nifty tries to go up next week, it will hit a wall around 23,500–23,600 first. That's the first test. If it somehow crosses that, the BIGGER wall is at 23,900–24,000 — where all the major moving averages (50-day & 200-day) are sitting. Lots of sellers will be waiting there to book profits. So going above 24,000 next week? Unlikely unless something very positive happens.
3 What's the floor below? (Support)
If Nifty starts falling, the first safety net is around 23,300–23,150. This zone has held multiple times recently. If it breaks this level decisively (and stays below it), then the next stop could be 23,000 or even 22,900. That's the danger zone — but that's not the most likely scenario for next week.



XAUUSD Analysis: Bears Still Control Below This Key Trendline
Hello everyone, Gold continues to respect a well defined major descending resistance trendline, and the latest rejection once again highlights the importance of this technical level.
Every recent rally into this resistance has attracted selling pressure, creating a sequence of lower highs that keeps the broader short term structure bearish.
As long as price remains below this trendline, sellers continue to hold the technical advantage. A confirmed breakout would change the outlook, but until then, resistance deserves respect.
One area that stands out on the chart is the key liquidity pool below current price. Markets often revisit these zones before making their next meaningful move, making this an important level to monitor rather than predict.
If selling pressure continues, price could gradually rotate lower and test this liquidity area. However, if buyers manage to reclaim the descending resistance with strong confirmation, the bearish structure would begin to weaken.
Instead of chasing every move, I prefer waiting for price to react around high-probability technical zones where risk-to-reward is more favorable.
My focus remains simple:
Respect the trend.
Follow market structure.
Let price confirm the next move.
No predictions, just reacting to what the market is showing.
What do you think?
Will Gold sweep the liquidity below first, or break above the descending resistance before making its next major move? Share your view in the comments. 👇
Disclaimer
This analysis is shared for educational and informational purposes only and should not be considered financial or investment advice. Always conduct your own research and use proper risk management before making any trading decisions.
—@TraderRahulPal
SCA Registered Financial Influencer (Dubai, UAE)
 Short
Short
Daily Market Analysis: Nifty 50 Technical Outlook TodayExplore today's Nifty 50 daily market analysis with technical insights, key support and resistance levels, trend outlook, and educational market commentary.
Daily Market Analysis: Nifty 50 Technical Outlook, Key Levels & Market Trend
Welcome to today's Daily Market Analysis, where we examine the current technical structure of the Nifty 50 index using price action, trend analysis, support and resistance levels, and market momentum.
This analysis is intended for educational and informational purposes only. Financial markets are dynamic, and traders should always perform their own research and manage risk before making investment decisions.
Market Overview
The Indian equity market continues to trade within an important technical range as buyers and sellers remain active around key price levels. Recent sessions have shown balanced participation, indicating that market participants are waiting for confirmation before initiating aggressive positions.
Although the broader trend remains constructive, resistance zones continue to limit upside momentum. A decisive breakout or breakdown may determine the market's next directional move.
Current Market Trend
Overall Trend: Neutral to Mildly Bullish
Current price action suggests that Nifty is maintaining its higher-low structure on the daily timeframe while consolidating on lower timeframes. This type of consolidation often precedes a directional move; however, confirmation is essential before drawing conclusions.
Technical Analysis
From a technical perspective, the market continues to respect established support and resistance zones.
Several observations include:
Price is trading above important medium-term support.
Resistance remains active near recent swing highs.
Momentum indicators remain balanced without signaling extreme conditions.
Market participation suggests consolidation rather than trend reversal.
The current structure favors patience until price confirms the next breakout or breakdown.
Key Support Levels
The following support levels may attract buying interest if tested:
Immediate Support
Intraday Support
Short-Term Support
Major Swing Support
A sustained move below major support could indicate increasing selling pressure.
Key Resistance Levels
The following resistance zones remain important for traders to monitor:
Immediate Resistance
Near-Term Resistance
Swing Resistance
Major Resistance Zone
A convincing breakout above resistance may indicate strengthening bullish momentum.
Possible Market Scenarios
Bullish Scenario
If the index sustains above the immediate resistance zone with healthy participation, the market may attempt to extend its upward movement toward higher resistance levels.
Confirmation through price action and volume is generally considered more reliable than anticipating a breakout.
Range-Bound Scenario
Markets often spend time consolidating before making significant directional moves.
If the index continues trading between support and resistance, traders may experience:
Lower volatility
Stock-specific movement
Short-term trading opportunities
Frequent reversals near range boundaries
Bearish Scenario
If selling pressure increases and price closes below important support levels, market sentiment could weaken.
A confirmed breakdown may lead to additional downside movement toward the next technical support area.
Risk Management
Regardless of market direction, disciplined risk management remains one of the most important aspects of trading.
Consider following these general principles:
Trade only after confirmation.
Define your risk before entering a position.
Avoid emotional decision-making.
Maintain appropriate position sizing.
Review multiple timeframes before making trading decisions.
What Traders Should Watch
During the next trading session, market participants may monitor:
Opening price relative to previous close
Strength near support and resistance
Volume participation
Price action during the first trading hour
Global market sentiment
Sector performance
Institutional activity
These factors can provide additional context for understanding short-term market behavior.
Conclusion
Today's Daily Market Analysis suggests that Nifty remains in a consolidation phase within a broader constructive trend. The market is approaching important technical zones that may influence its next directional move.
Rather than predicting future prices with certainty, traders should focus on observing price action, respecting technical levels, and managing risk appropriately.
Consistent analysis, patience, and disciplined execution remain essential components of long-term trading success. KAMATHOTEL: Deep Value Contender with Multi-Yr Upside PotentialOverview :
Kamat Hotels (India) Limited (NSE: KAMATHOTEL) presents a classic high-risk, high-reward contrarian setup. Trading around the ₹172.14 zone, the stock is currently undergoing a corrective phase and testing major multi-year support levels. Despite near-term technical weakness, the asset trades at a steep valuation discount compared to its hospitality peers, offering an intriguing structural setup for a 1 to 3-year holding horizon.
Technical Trend Direction & Key S/R Levels:
Trend Direction : Short-term and medium-term timeframes (ranging from the 4-hour to the weekly charts) currently reflect a bearish trend alignment (Neutral-to-Sell gauges). Price action is sitting below the Value Area Low (VAL) of ₹202.67, with the Volume Profile Point of Control (POC) lingering higher at ₹239.71, acting as a natural macro magnet.
Key Support Levels : Immediate downside defense sits at the ₹140.20 level (52-week low / structural floor). A breach here exposes deeper historical demand zones near ₹111.20 and ₹94.60.
Key Resistance Levels : Immediate overhead supply rests at the broken support shelf of ₹175.00, followed by the Value Area Low at ₹202.67 and the major POC at ₹239.71.
Fundamental Scorecard & Valuation :
Valuation Disconnect : KAMATHOTEL is significantly undervalued relative to the broader sector. It trades at a P/E multiple of 14.6x (a ~52% discount to the sector median of 29.4x) and an EV/EBITDA of 7.5x (a ~54% discount to the median of 16.5x).
Financial Health & Growth : The company operates as a leveraged grower, registering a TTM revenue of ₹3.9B (+6.4% YoY), though profitability faced pressure with a net income decline of 26.2% YoY. Debt-to-equity stands at 0.74, higher than the peer median, indicating that debt management remains a vital monitoring point for long-term holders.
Sector Comparison :
When stacked against peers like INDHOTEL (Indian Hotels), CHALET, EIHOTEL, and TAJGVK, KAMATHOTEL stands out as the smallest by market capitalization (~₹5.2B) and offers the steepest valuation discount. While large-cap peers boast stronger double-digit revenue expansions and "Strong Buy" ratings, Kamat Hotels compensates value-oriented investors with an exceptionally low entry multiple.
Directional Bias & 1–3 Year Outlook (Levels to Watch): NEUTRAL TO ACCUMULATE ON DIPS (1–3 Year Horizon)
Strategy : Because the technical trend remains down and recent news flow (such as CFO transition and temporary earnings compression) has weighed on sentiment, aggressive chasing is discouraged. Instead, a phased accumulation strategy near the ₹140.20 – ₹160.00 major support band offers a favorable risk-to-reward ratio. For a confirmed structural trend reversal on a 1–3 year outlook, watch for a weekly close reclaiming the ₹202.67 value area, which opens the path toward the ₹239.71 POC target.
Disclaimer: This analysis is for educational purposes only and does not constitute financial advice. Hospitality stocks are cyclical; always manage your risk and position sizing accordingly.  Long
Long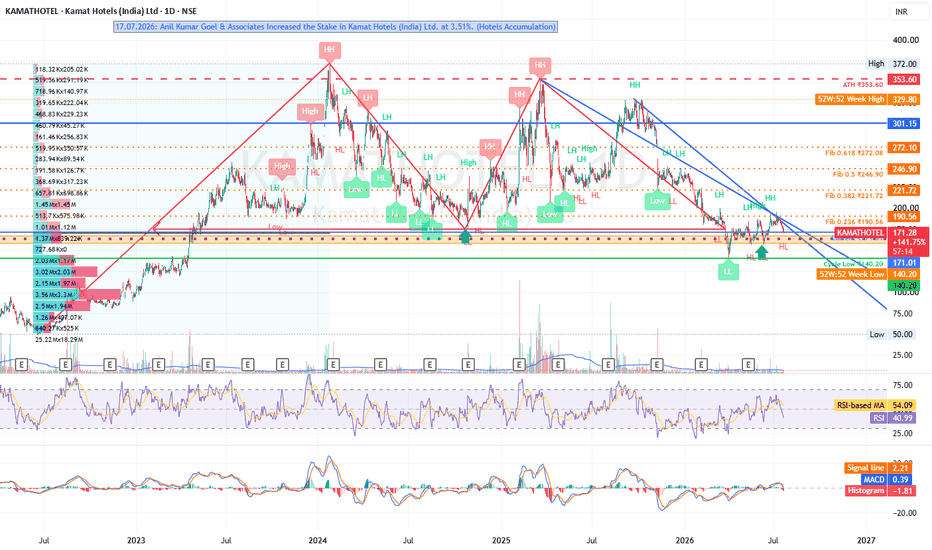
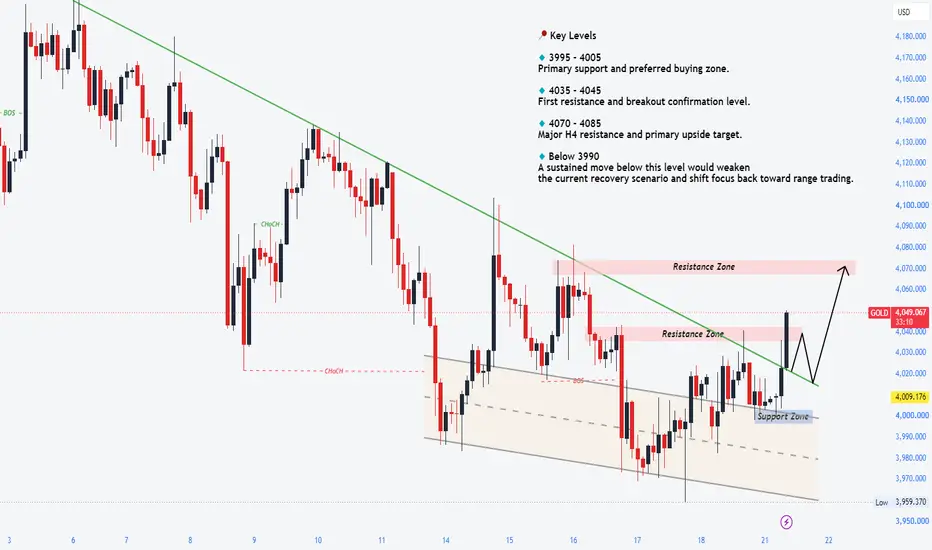
Breakout ongoing – will gold confirm bullish reversal?Gold enters the new trading week with the first encouraging technical signal after breaking slightly above the descending H4 trendline that has capped price action throughout the recent decline. Although the breakout is still modest, it suggests selling pressure is gradually weakening and buyers are beginning to regain control.
The broader market structure, however, has not fully shifted into a bullish trend. The 4040–4060 area remains the most important resistance, where the H4 descending trendline and previous supply converge. This will be the decisive zone to determine whether the current recovery is merely a corrective bounce or the beginning of a larger bullish reversal.
As long as gold continues holding above the breakout area and forms higher lows, the bullish recovery scenario remains favored. A confirmed break and sustained acceptance above 4040–4060 would likely attract fresh buying momentum and open the way toward the psychological 4100 resistance, where the market will face its next major technical test.
For the coming sessions, the preferred strategy is to buy on pullbacks while price remains above the newly broken trendline. Scalping opportunities can still be taken within the current range, but traders should be prepared to shift into breakout trading once resistance is cleared with strong momentum.
📍 Key Levels
🔹 3970 – 3990 Major support zone and preferred buying area.
🔹 4015 – 4045 Breakout support and H4 trendline retest zone.
🔹 4040 – 4060 Key resistance. A confirmed breakout would strengthen the bullish structure.
🔹 4090 – 4105 Primary upside target before reassessing higher-timeframe momentum.
✅ Preferred Scenario Gold holds above the broken descending trendline. Buyers defend the 4015–4045 support region. A breakout above 4040–4060 confirms bullish continuation. The next upside objective is the 4100 area. Failure to hold above the breakout structure would delay, but not immediately invalidate, the recovery outlook. Long 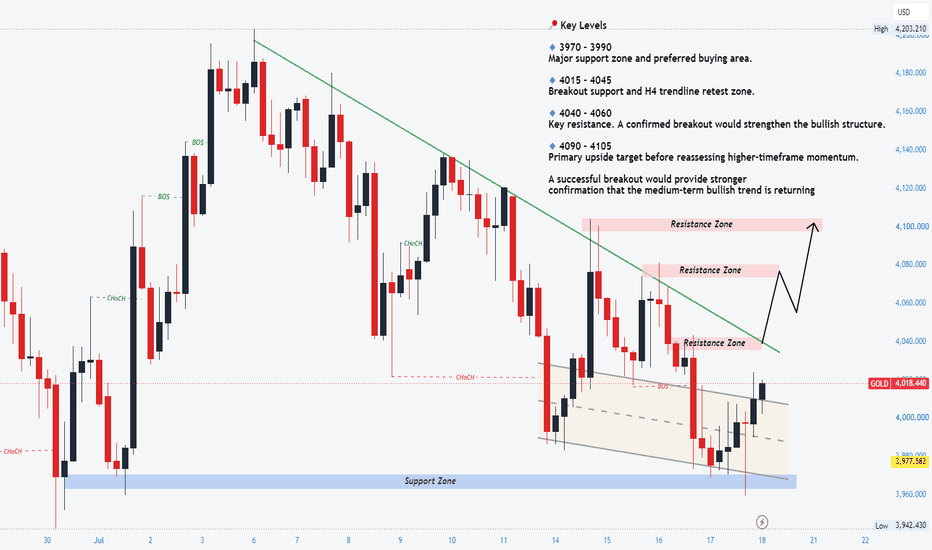
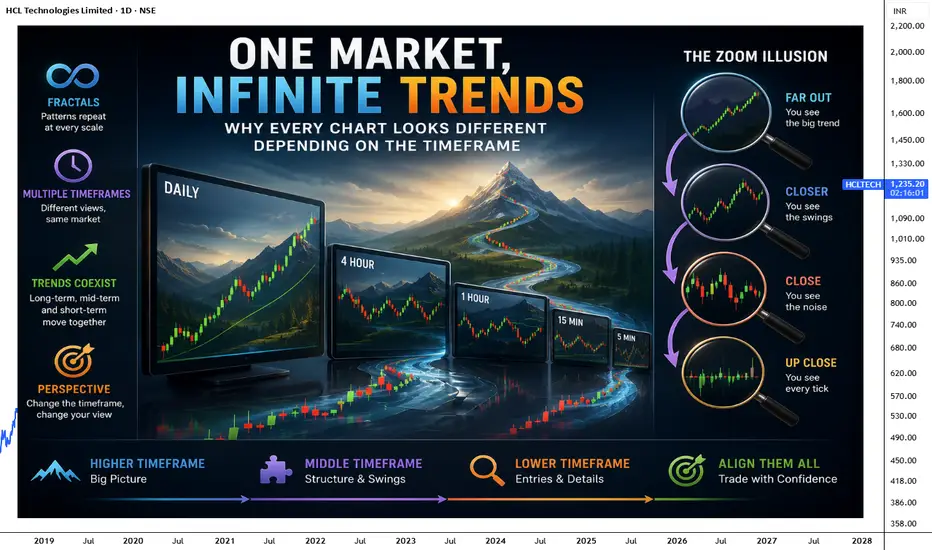
One Market, Infinite TrendsHave you ever noticed something strange while looking at charts? You open the 5-minute timeframe and see a strong uptrend. Then you switch to the 1-hour chart, and the market suddenly looks like it is moving sideways. Move to the daily timeframe, and now it looks like a downtrend. The obvious question is, **which one is correct?
The surprising answer is that they are all correct . The market does not have just one trend. It has many trends happening at the same time. Understanding this simple idea can completely change the way you read charts and explain why experienced traders rarely rely on only one timeframe.
Every Timeframe Tells a Different Story
Think of standing in front of a mountain. If you stand very close, you only see rocks, trees, and small details. As you move farther away, you begin to see the entire mountain. Neither view is wrong. You are simply looking at the same object from a different distance.
Charts work the same way. A lower timeframe shows every small battle between buyers and sellers. A higher timeframe hides that noise and reveals the bigger picture. The market has not changed. Only your perspective has.
The Market Is Fractal:
One of the most fascinating characteristics of financial markets is that they are fractal. This means similar patterns repeat themselves across different timeframes.
A breakout on the 5-minute chart may look almost identical to a breakout on the daily chart. Trends, pullbacks, consolidations, and reversals appear everywhere, whether you are looking at one minute or one month.
It is like zooming into the branches of a tree. Every branch looks similar to the whole tree. The pattern repeats itself at different sizes.
This is why traders can use many of the same price action concepts on almost any timeframe.
Why Trends Can Coexist?
Many beginners believe there can only be one trend at a time. In reality, several trends can exist together without contradicting each other.
Imagine climbing a staircase.
Each step moves upward.
At the same time, you may walk slightly left or right while climbing.
From close up, your movement looks different.
From a distance, everyone can clearly see you are moving upstairs.
The market behaves in a similar way.
The daily chart may be in a strong uptrend.
Inside that uptrend, the 1-hour chart may show a temporary pullback.
Within that pullback, the 5-minute chart may even have its own short-term uptrend.
Each timeframe is simply showing a smaller part of the bigger picture.
The Zoom Illusion
Imagine opening Google Maps.
At the highest zoom level, you can see your entire country.
Zoom in, and you only see your city.
Zoom in again, and you see individual streets.
Finally, you see a single building.
Nothing has changed except your level of zoom.
Charts work the same way.
Changing timeframes is simply changing your zoom level.
The market itself remains the same.
Which Timeframe Is the Best?
This is one of the most common questions traders ask.
The truth is that no timeframe is better than another.
A scalper may only care about the 1-minute chart.
A swing trader may focus on the 4-hour and daily charts.
A long-term investor may rarely look below the weekly timeframe.
The best timeframe is the one that matches your trading style.
Instead of searching for the "perfect" timeframe, successful traders learn how different timeframes work together.
The Bigger Picture Always Matters:
Imagine reading a single sentence from a book without knowing the rest of the story. It is easy to misunderstand its meaning.
The same happens in trading.
Looking at only one timeframe can hide important information. A perfect buy setup on the 15-minute chart might actually be trading directly into a strong resistance level visible on the daily chart.
This is why experienced traders often begin with higher timeframes to understand the overall market direction before moving to lower timeframes to fine-tune their entries.
My Thoughts:
The market does not change when you switch timeframes. Only your perspective changes. Every timeframe reveals a different layer of the same story. Lower timeframes show the details, higher timeframes reveal the bigger picture, and together they create a complete view of the market.
The next time you see two charts showing different trends, remember this simple idea.
The market is not contradicting itself. You are simply looking at the same story from different distances.
By @BrightRally_Research on @TradingView  Education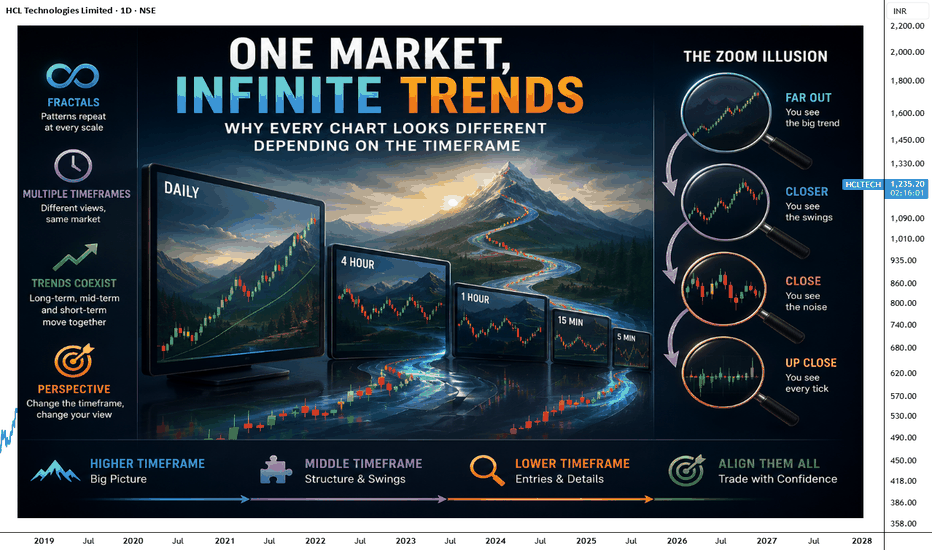
Short 
XAUUSD [1H]: Bearish Rejection at Supply Zone & Trendline ?🔍 Market Structure & Technical Breakdown
Overall Bias: Bearish. The asset experienced a clear Change of Character (CHOCH) at the top left, followed by a sustained Break of Structure (BOS) to the downside.
The Correction: Price temporarily rallied out of a Downward Channel via a Market Structure Shift (MSS), but failed to sustain higher prices, putting the broader bearish momentum back in control.
Confluence Zone: We are currently looking at a high-probability Short Setup forming around the $4,020 - $4,040 region. This setup is heavily reinforced by a strong confluence of factors:
Descending Trendline: Price is reacting directly underneath a well-respected, multi-touch bearish trendline.
Supply Zone: The blue horizontal box represents a key historical order block/supply zone where sellers have previously stepped in aggressively.
📉 Trading Setup (Short Opportunity)
Execution Area: Sell limit or price action rejection within the blue Supply Zone ($4,020 - $4,035), aligned with the descending trendline touch.
Invalidation/Stop Loss: A clean daily close or sustained hourly candle body closing above the trendline and supply zone (above $4,045).
Take Profit (Target): The recent local swing low liquidity pool at $3,965. Short 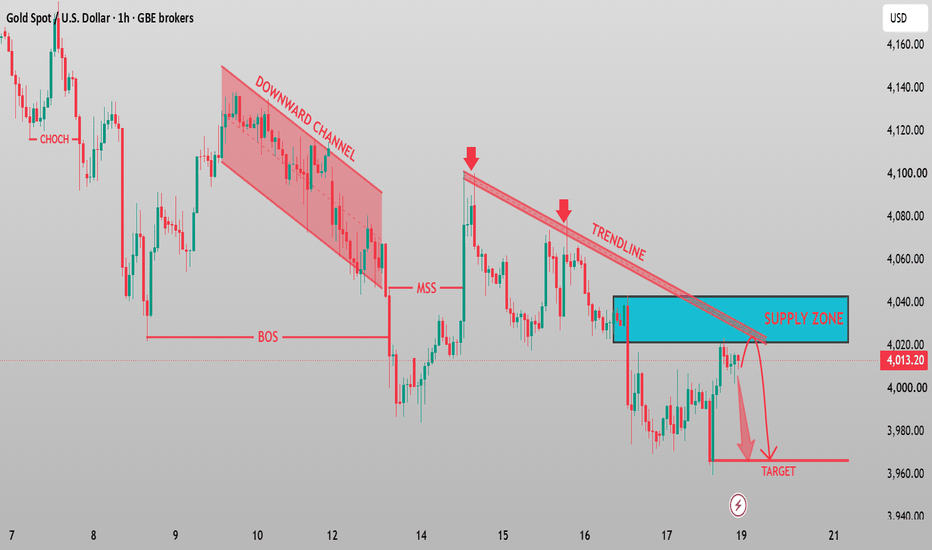
Long 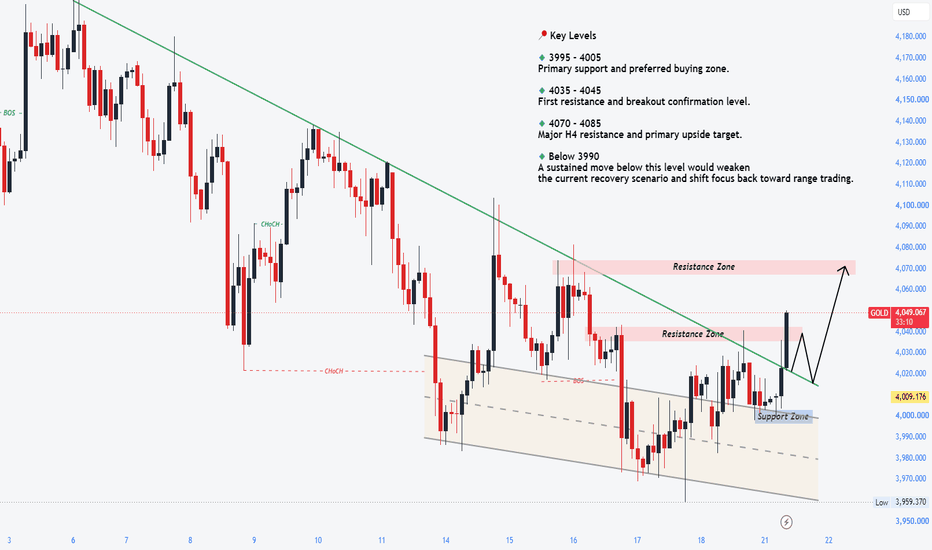
#NIFTY Intraday Support and Resistance Levels - 21/07/2026Nifty is expected to witness a flat opening with no major overnight triggers. The index is consolidating near the 24200–24250 support zone after the recent recovery, indicating that traders should wait for confirmation before taking fresh positions.
If Nifty sustains above 24250–24300 after the opening, traders can consider long positions with upside targets of 24350, 24400, and 24450. A decisive breakout above 24450 will confirm fresh bullish momentum and can extend the rally further.
On the downside, if Nifty fails to hold 24200 and slips below this support, traders can consider short positions with downside targets of 24150, 24100, and 24050. A sustained move below 24050 will strengthen the bearish bias and may lead to further selling pressure.
Overall, a flat opening is expected with range-bound trading likely during the initial session. As long as Nifty holds above the 24200–24250 support zone, buying on dips remains the preferred strategy. Traders should wait for confirmation near the opening range and maintain strict stop-losses while booking profits gradually at the mentioned target levels. #BANKNIFTY Intraday PE & CE Levels(21/07/2026)Bank Nifty is expected to witness a flat opening with no major overnight cues. The index is consolidating near the 57950–58050 zone after Friday's sharp rally, indicating a wait-and-watch approach before the next directional move. Traders should wait for confirmation around key support and resistance levels before initiating fresh positions.
If Bank Nifty sustains above 57550–57600 after the opening, traders can consider buying CE options with upside targets of 57750, 57850, and 57950. A decisive breakout above 58050 will confirm fresh bullish momentum and can extend the rally towards 58250, 58350, and 58450+.
On the downside, if Bank Nifty fails to hold the 57950–57900 resistance zone and shows rejection, traders can consider buying PE options with downside targets of 57750, 57650, and 57550. A breakdown below 57450 will further strengthen the bearish momentum and can drag the index towards 57250, 57150, and 57050.
Overall, a flat opening is expected with stock-specific action likely to dominate during the initial session. As long as Bank Nifty trades above the 57550–57600 support zone, buying on dips remains the preferred strategy. Traders should wait for confirmation near the opening range and maintain strict stop-losses while booking profits gradually at the mentioned target levels. BTCUSD Rejection at Major Resistance? Short Setup Around 65000BTCUSD Analysis: Watching the 65,000–65,100 Resistance Zone
BTCUSD is approaching a key resistance area between 65,000 and 65,100, where sellers could step in and trigger a bearish rejection.
Trade Idea
Entry Zone: 65,000 – 65,100
Bias: Bearish
Stop Loss: 65,710
Target 1: 64,000
Target 2: Below 64,000 (depending on momentum)
Why this setup?
Price is testing a significant resistance zone.
A rejection here could attract fresh selling pressure.
Risk-to-reward becomes attractive if the resistance holds.
Trade Management
Wait for bearish confirmation (such as a rejection candle, bearish engulfing pattern, or lower-timeframe market structure break) before entering. If BTC closes decisively above 65,710, the bearish setup becomes invalid.
Disclaimer: This is a technical analysis idea based on price action and key resistance levels. Always manage your risk and wait for confirmation before entering any trade.
Do you expect BTC to reject this resistance or break through it? Share your view below.
📌 Disclaimer:
This analysis is for educational purposes only and is not financial advice. Always manage risk and follow your trading plan.
Your feedback drives our content and keeps everyone trading smarter. Let’s make those pips together! 🚀
Happy Trading,
– The InvestPro Team  Short
Short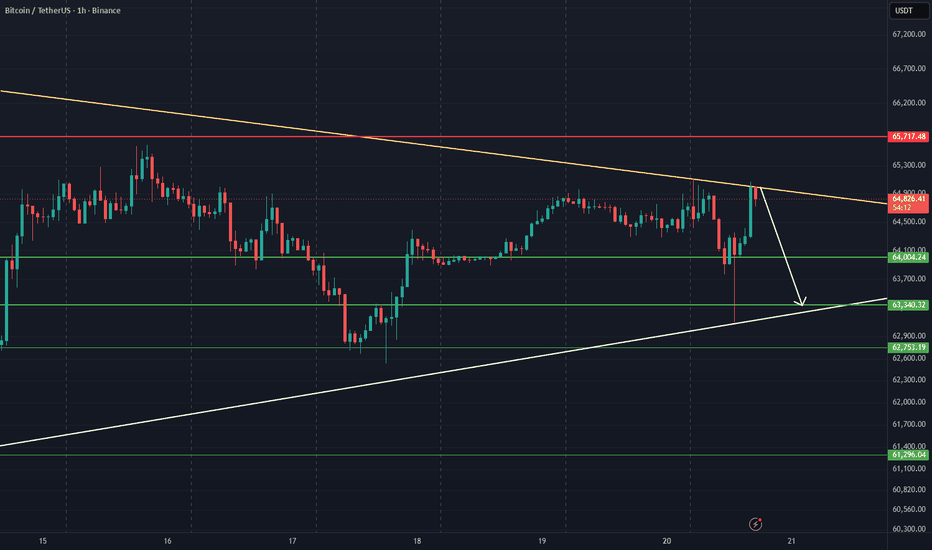
MASON XAUUSD – Key Support And Resistance SetupXAUUSD is trading around 4,010 after recovering from the lower support area, but price is still moving below the main descending trendline. The short-term reaction shows buyers are defending the support zone, but the broader structure still needs confirmation before a stronger bullish move can be trusted.
The priority plan is to trade from strong support and resistance zones, with sell pressure still favoured if gold rejects from the upper Fibonacci resistance areas.
Technical View
Gold is currently trading below the descending trendline, which means the market is still under short-term bearish pressure. Even though price has reacted from the lower area, the recovery remains corrective while gold stays below the trendline and key resistance zones.
The 3,991–3,997 area is the main buy zone on the chart. This zone aligns with the Fibonacci 50 reaction area and sits above the 3,982 support. If gold pulls back into this area and holds, a short-term bullish reaction may appear.
However, the upside still has two important resistance zones. The first one is the 4,051–4,055 sell scalping FVG zone. This area may create the first bearish reaction if price recovers from the buy zone.
The stronger resistance is around 4,078–4,085, marked as the sell zone and Fibonacci 50 area. This zone is important because it aligns with the previous structure, Fibonacci resistance, and the descending trendline region. If gold reaches this zone and rejects, it may confirm another lower high before price turns down again.
The 3,982 level is the key support. If gold loses this level, the bullish reaction becomes weak, and price may move back toward the stronger support range around 3,960–3,970.
Key Zones
Current price: 4,010
Main buy zone: 3,991–3,997
Key support: 3,982
Strong support: 3,960–3,970
Sell scalping FVG zone: 4,051–4,055
Major sell zone: 4,078–4,085
Descending trendline resistance: 4,055–4,085
Invalidation for sell view: above 4,085
Trading Plan
Sell Priority: 4,051–4,055
Condition: wait for bearish rejection, failed breakout above the FVG zone, or price staying below the descending trendline.
SL: above 4,085
TP1: 3,991–3,997
TP2: 3,982
TP3: 3,960–3,970
Alternative Sell Scenario
If gold pushes higher into 4,078–4,085, wait for a clear bearish rejection from this major resistance zone before looking for sell continuation. This would be the stronger resistance-based sell setup.
SL: above 4,095
TP1: 4,051–4,055
TP2: 3,991–3,997
TP3: 3,982
Buy View
Buy is possible only as a short-term reaction from the 3,991–3,997 zone or near 3,982 support. The condition is clear bullish rejection, price holding above support, and a lower-timeframe higher low formation.
Buy Zone: 3,991–3,997
SL: below 3,982
TP1: 4,051–4,055
TP2: 4,078–4,085
Final View
Overall, gold is reacting from support, but the market has not broken the descending trendline yet. The cleaner plan is to wait for price to reach the strong decision zones. A reaction from 3,991–3,997 may support a short-term buy, while rejection from 4,051–4,055 or 4,078–4,085 keeps the bearish structure active.
Will gold hold the 3,991–3,997 support zone and recover, or reject from resistance and return toward 3,982?
Long 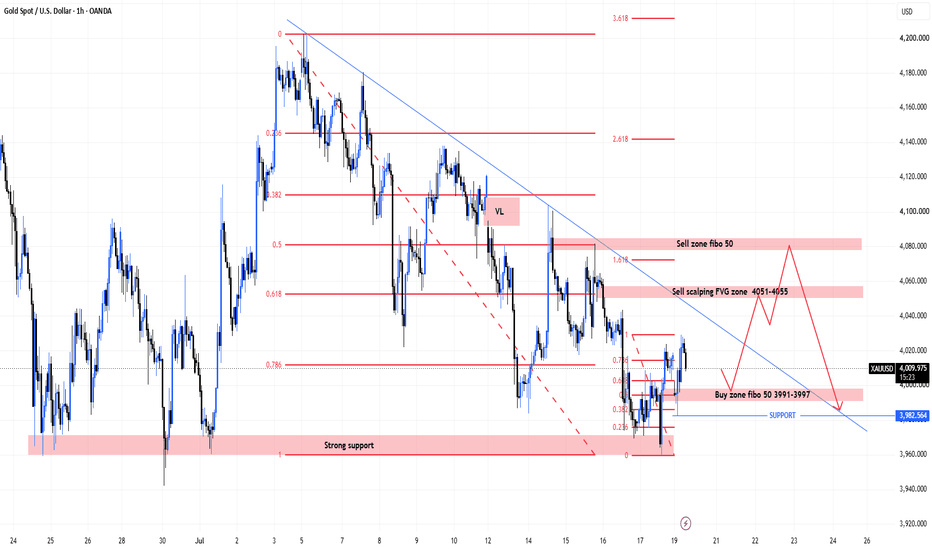
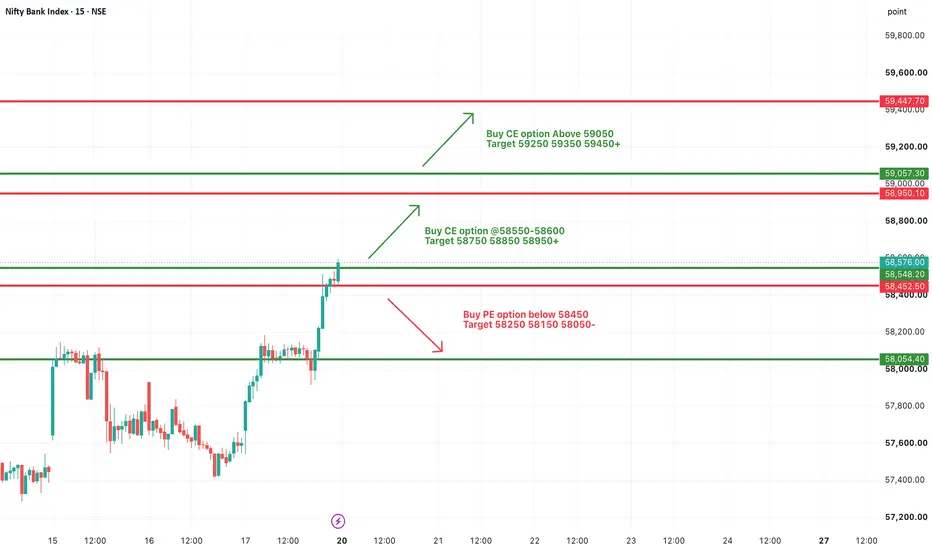
#BANKNIFTY Intraday PE & CE Levels(20/07/2026)Bank Nifty is expected to witness a gap-up opening following Friday's strong bullish momentum. The index has reclaimed the 58550 support zone and is trading near an important resistance area around 58550–58600. Traders should wait for confirmation above this resistance before initiating fresh long positions.
If Bank Nifty sustains above 58550–58600 after the opening, traders can consider buying CE options with upside targets of 58750, 58850, and 58950. A decisive breakout above 59050 will further strengthen the bullish trend and can extend the rally towards 59250, 59350, and 59450+.
On the downside, if Bank Nifty fails to sustain above 58450 and slips below this support, traders can consider buying PE options with downside targets of 58250, 58150, and 58050. Unless 58450 is breached decisively, avoid aggressive bearish positions as the overall momentum remains positive.
Overall, a gap-up opening is expected with a positive intraday bias. As long as Bank Nifty holds above the 58450–58550 support zone, buying on dips remains the preferred strategy. Traders should wait for confirmation near the opening range and maintain strict stop-losses while booking profits gradually at the mentioned target levels. Nifty 50 Weekly Analysis [20 - 24 July, 2026]Probable Scenario Analysis and Trade Plan for the Nifty 50 Index NSE:NIFTY for the Week of 20 - 24 July, 2026.
🟢 Bullish Scenario
Nifty 50 is in a strong bullish zone. Every down move should be doubted and considered as an opportunity to go long. If the Nifty 50 Index stays above 24200, then stay bullish. The probable bullish targets above 24200 would be - 24300, 24400, and 24500. There will be strong resistance at 24500. Next, if the price sustains above 24500, then the probable bullish targets would be - 24600 and 24700. The zone of (24750 - 24700) would be a strong resistance zone.
🔴 Bearish Scenario
Presently, the price is out of the bearish zone. There is no observable bearish setup in the charts. However, level 24100 is a crucial support. If the price breaks down below 24100, then there will be a weak bearish move till 24000. Level 24000 is weak support. Next, if the price decisively breaks down below 24000, then the probable bearish targets would be - 23900 and 23800. The price will receive strong support in the zone of (23850 - 23800).
🟡 No Trading Zone (NTZ): (24200 - 24100).
⏺ Range of Consolidation (ROC): (24500 - 24200).
Here, 24350 is the median of the ROC. The median works like an intraday sentiment evaluator. The price trading above the median would offer bullish sentiment, while the price trading below the median would trigger bearish sentiment within the ROC.
● Event
No high-impact event this week. One medium-impact event is the Euro Interest Rate Decision on 23rd July (Thursday). No holidays this week. Lastly, geopolitical issues are omnipresent.
● Intraday Bias
Establish intraday bias with respect to the opening price. If the price sustains above the opening price, then don't think of shorting. Look for bullish trades only. On the contrary, if the price sustains below the opening price, then don't think of going long. Look for bearish trades in that case.
● Top - Down Analysis
- Monthly TF: A green candle closed far above the close of the previous month. The month is bullish. Strong support at 24200. Immediate resistance is at 24500. The view is bullish.
- Weekly TF: A bullish candle formed within the red long-legged doji of the previous week. It looks like a "Bullish Harami" pattern. The zone of (24250 - 24200) would act as a strong support area. Immediate resistance is 24500. The view is indecision to bullish.
- Daily TF: A strong bullish candle showing signs of strong momentum. Level 24200 is strong support. It seems that level 24500 is possible. Doubt every down move. The view is bullish.
- 30-minute TF: The higher-highs and lower-lows structure is intact. The zone (24250 - 24200) is strong support. The view is bullish.
● Disclaimer + End Note
- All the analyses would fail in the case of a major gap up, gap down, or price structure anomaly. Thus, practice PRAGMATISM in the live session.
- Trade only if there is a set-up. Remember, not trading is an extension of the trading activity.
- Mark your points. Trade your points. Price is GOD. Anything can happen in the markets. Thus, trade what you see, not what you believe.
- Always PRACTICE RISK MANAGEMENT. Always PROTECT YOUR CAPITAL. Be RESPONSIBLE.
- Be Strategic. Be Courageous. Be Patient. Be Wise.
- Every day is a new day. Thus, do not carry the baggage of past successes or failures. Leave the gardens of winning and losing. Establish yourself in equanimity. Always think from a new perspective.
- Let the joy of trading drive your effectiveness, not greed or fear. Believe in Possibilities.
Happy Trading! Trading Masterclass #1Institutional trading means trading like hedge funds, banks, prop firms, and professional desks. They do not trade based on emotions, random tips, or gambling. They use systems, probabilities, risk control, position sizing, discipline, and psychology.
Retail traders often lose because they focus only on “entry.” Institutions focus on:
Risk Management
Capital Protection
Position Sizing
Probability
Psychology
 Education

Technical AnalysisCore of Technical Analysis
Technical Analysis is the study of past price movements, volume, and market trends to predict future price direction.
3 Main Principles:
Market Discounts Everything
All news, emotions, and fundamentals are already reflected in price.
Prices Move in Trends
Markets usually move in uptrend, downtrend, or sideways trends.
History Repeats Itself
Human psychology creates repeating chart patterns.
Key Tools:
Charts (Candlestick, Line, Bar)
Support & Resistance
Trendlines
Indicators (RSI, MACD, Moving Averages)
Volume Analysis Education

 Education