#BANKNIFTY Intraday PE & CE Levels(16/07/2026)Bank Nifty is expected to witness a flat opening, indicating a balanced start between buyers and sellers. The index is currently trading near the 57550–57600 support zone, making this level crucial for today's intraday direction. Traders should wait for confirmation before initiating fresh positions rather than reacting to the opening move.
The immediate support is placed at 57550–57600. If Bank Nifty sustains above this zone and attracts buying interest, traders can consider CE positions with targets of 57750, 57850, and 57950. A decisive breakout above 58050 will confirm stronger bullish momentum and may extend the rally towards 58250, 58350, and 58450.
On the downside, if Bank Nifty slips below 57950–57900 and faces rejection from higher levels, traders can consider PE positions with targets of 57750, 57650, and 57550. A sustained breakdown below 57450 will strengthen the bearish trend and may push the index towards 57250, 57150, and 57050.
Overall, a flat opening is expected. As long as Bank Nifty holds above the 57550 support zone, buying on dips remains the preferred strategy. Fresh short positions should only be considered after a confirmed breakdown below 57450 or a rejection from the 57950–58000 resistance zone, with strict stop-losses and disciplined profit booking at each target level. XAUUSD: Is the Pullback an Opportunity for Sellers to Return?XAUUSD is showing signs of a technical rebound from the support zone around $4,000. However, the H4 structure remains largely unchanged, as the price continues to trade below the downtrend line and has failed to break through the $4,083–$4,093 resistance zone.
Notably, selling pressure emerges quickly whenever gold approaches the downtrend line, creating a clear series of lower highs. This indicates that sellers remain in control of the primary trend, while the current upward movement is merely a corrective phase following the previous decline.
Fundamentally, gold remains under pressure as US bond yields stay elevated. Meanwhile, the market awaits further PPI data and statements from the Federal Reserve to gauge the interest rate trajectory. Reuters also reports that rising oil prices have reignited inflation concerns, fueling expectations that the Fed will maintain a tight monetary policy for longer, thereby dampening gold's appeal.
If the price rallies to the $4,083–$4,093 zone but fails to close above the downtrend line, selling pressure could intensify, pushing XAUUSD back down to test the $3,933 support level.
Suggested Strategy: Prioritize SELL positions if signs of rejection appear around the $4,083–$4,093 zone. Target: $3,933.  Short
Short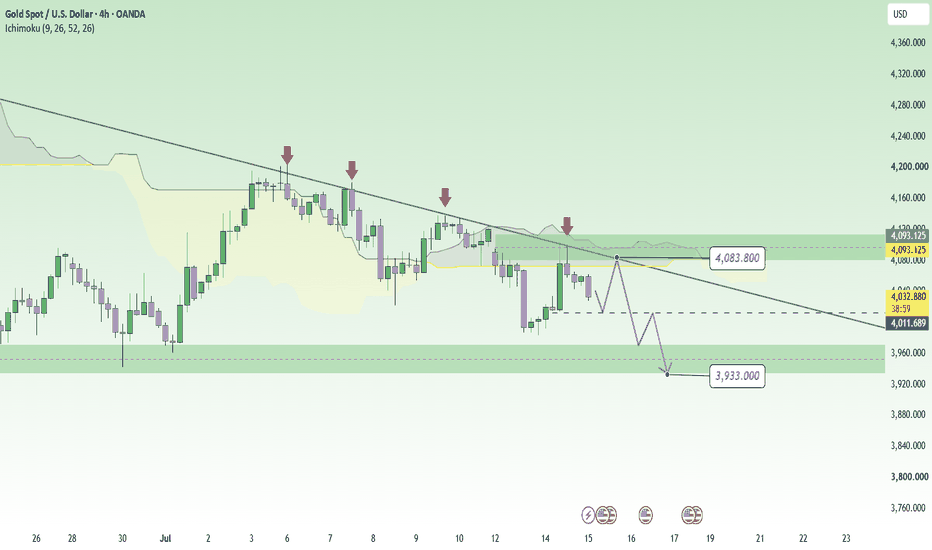
 Education

Trading Masterclass #1Institutional trading means trading like hedge funds, banks, prop firms, and professional desks. They do not trade based on emotions, random tips, or gambling. They use systems, probabilities, risk control, position sizing, discipline, and psychology.
Retail traders often lose because they focus only on “entry.” Institutions focus on:
Risk Management
Capital Protection
Position Sizing
Probability
Psychology
Consistency
Repeatable Edge
In options trading, if you think like institutions, your results can improve significantly
 Education

ABB Symmetrical Triangle Consolidation________________________________________
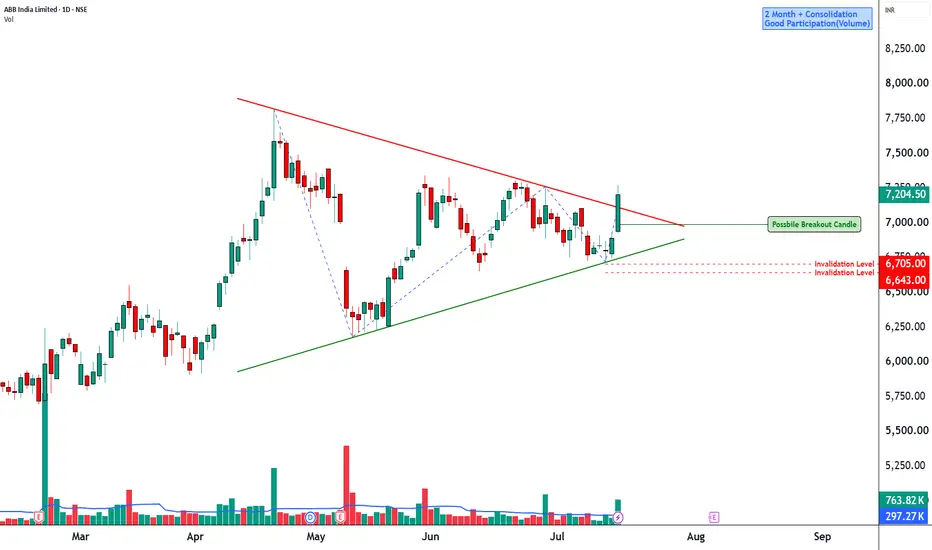
📊 ABB India: Daily Technical Snapshot – Symmetrical Triangle Consolidation
📊 STWP Technical Analysis
________________________________________
MARKET STRUCTURE SNAPSHOT | NSE: ABB
Closing Price: ₹7,204.50 (+₹312.50 | +4.53%)
Core Trend: Long-Term Uptrend
Market State: Consolidation Within Uptrend
Price Structure: Price is consolidating inside a Symmetrical Triangle, reflecting a period of compression following the previous rally. The structure suggests that buyers and sellers are reaching equilibrium, with a breakout likely to determine the next directional move.
________________________________________
OPERATIONAL PRICE GRID & KEY REFERENCE LEVELS
Model Reference Level: ₹7,270.00
Hard Invalidation Level: ₹6,643.20
Structural Risk: ₹626.80 (8.62%)
Resistance Levels: R1 ₹7,340.83 | R2 ₹7,477.17 | R3 ₹7,684.33
Support Levels: S1 ₹6,997.33 | S2 ₹6,790.17 | S3 ₹6,653.83
Range Structure: Low ₹6,643.20 | High ₹7,684.33
Higher Timeframe Observation Zones: ₹7,477 | ₹7,684 | ₹8,000
________________________________________
MOMENTUM, PARTICIPATION & CPR DATA
Volume Profile: 763.82K Shares
Volume Character: Strong Relative Participation
RSI: 58.93 (Positive Momentum Zone)
ADX: 11.75 (Low Trend Strength – Compression Phase)
ROC: +3.86%
MACD Status: Momentum Improving
CCI: +68.25 (Positive Momentum)
Stochastic Reading: 88.19 (Strong Momentum Zone)
Current Bias: WAIT FOR BREAKOUT CONFIRMATION
CPR State: Bullish Zone | CPR Moving Up (Wide)
Today's CPR: Pivot ₹6,852.00 | Top ₹6,872.00 | Base ₹6,832.00
Tomorrow's CPR (Projected): Pivot ₹7,133.65 | Top ₹7,169.10 | Base ₹7,098.25
________________________________________
📚 EDUCATIONAL OBSERVATION
ABB India continues to consolidate within a Symmetrical Triangle, a chart pattern that commonly develops after a strong directional move as the market enters a temporary period of balance between buyers and sellers. The series of lower highs and higher lows reflects gradually narrowing price swings, often preceding a volatility expansion.
The stock remains within its broader uptrend despite the ongoing consolidation. Rather than signalling weakness, the current structure appears to represent a pause following the previous advance. Such consolidation phases frequently allow momentum indicators to cool before the next significant move develops.
Momentum indicators remain constructive despite the consolidation. The RSI at 58.93 remains comfortably above the neutral zone, suggesting buyers continue to hold an advantage. ROC at +3.86% reflects positive price momentum, while CCI at +68.25 remains in bullish territory. MACD is stabilising after the previous correction, indicating improving momentum. Meanwhile, ADX at 11.75 confirms the market is currently in a low-trend environment, which is typical during triangle formations before a decisive breakout.
The projected Central Pivot Range (CPR) for the next trading session has shifted higher, with the projected Pivot at ₹7,133.65. A rising and widening CPR generally reflects improving acceptance of higher prices and provides a supportive backdrop should a breakout emerge.
The immediate technical focus remains on the upper boundary of the Symmetrical Triangle, which coincides with the resistance zone between ₹7,340 and ₹7,477. A decisive close above this region, supported by stronger-than-average trading volume, would confirm the continuation breakout and strengthen the probability of a move towards ₹7,684 and potentially the psychological ₹8,000 level. Conversely, failure to hold the lower trendline could shift attention towards the support levels near ₹6,997 and ₹6,790.
________________________________________
🏢 BUSINESS OVERVIEW
ABB India is a leading provider of electrification, industrial automation, robotics and motion technologies. The company benefits from India's ongoing investment in manufacturing, infrastructure, renewable energy, data centres and industrial automation. Rising capital expenditure across these sectors continues to support long-term demand for ABB India's products and engineering solutions.
________________________________________
📖 Educational Note
Support and resistance levels should be treated as observation zones rather than predictive targets. Chart patterns, price action, volume analysis, momentum indicators and CPR are educational tools that help market participants understand evolving market structure within a disciplined risk-management framework.
________________________________________
⚠️ Disclaimer
This analysis is provided strictly for educational and informational purposes.
It does not constitute financial, investment or trading advice and should not be interpreted as a recommendation to buy or sell any security.
Stock market investments are subject to market risks, including the possible loss of capital.
Historical performance, chart patterns and technical indicators do not guarantee future results.
Please conduct your own research and consult a SEBI-registered investment adviser before making investment decisions.
STWP assumes no responsibility or liability for any financial loss arising directly or indirectly from the use of this analysis.
 Long
Long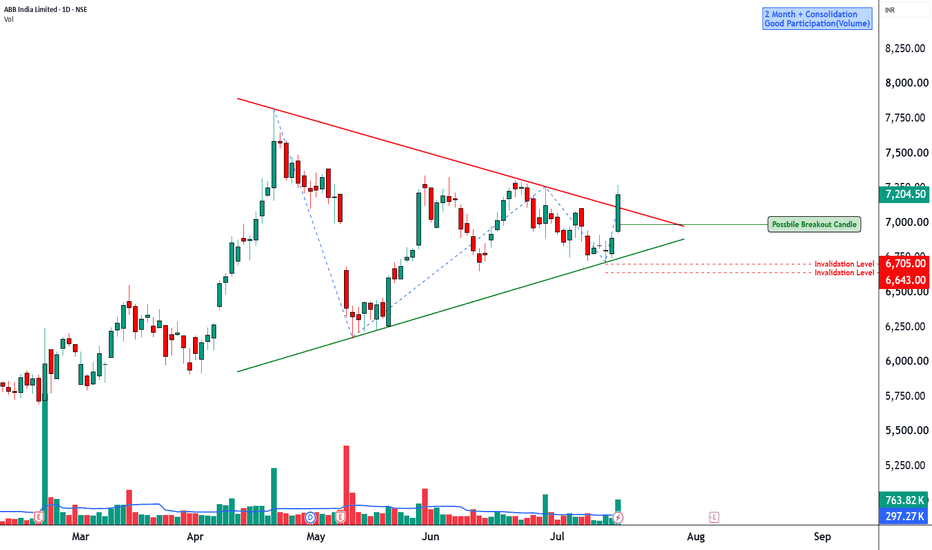
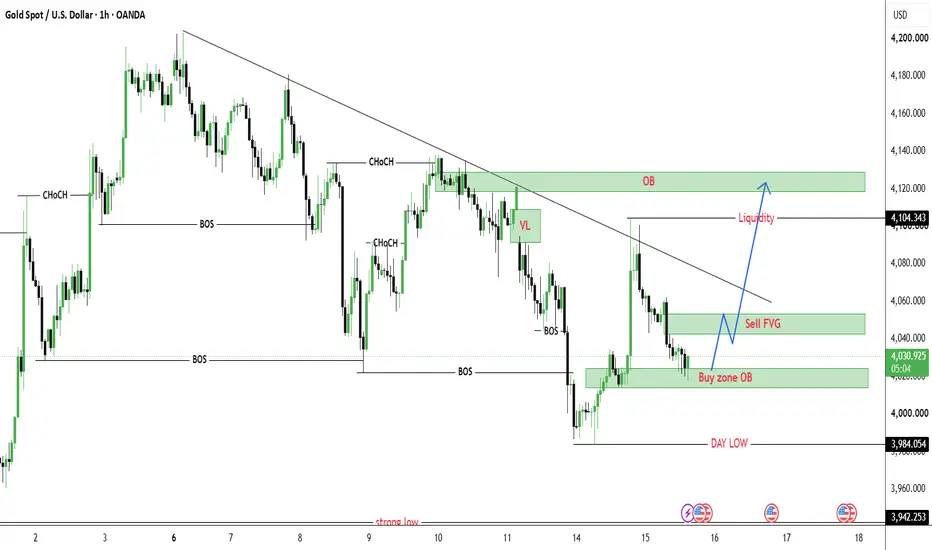
XAUUSD — Buy Zone Holding, Bullish Recovery SetupXAUUSD — Buy Zone Holding, Bullish Recovery Setup
Gold is trading around $4,029 after pulling back into the short-term Buy zone OB. The market reacted from the lower structure near $3,984 and is now trying to build a recovery from the current demand area.
From an SMC perspective, gold has already swept the day low liquidity and started to recover above the buy zone. The recent pullback into $4,017–$4,030 looks more like a liquidity retest than a full bearish continuation. As long as price can hold above this OB area, buyers still have a chance to push gold back toward the Sell FVG zone first, then the higher liquidity around $4,104.
The main plan is to avoid selling low after price has already reached the demand area. If gold holds the Buy zone OB and forms bullish confirmation, the next move can target $4,045–$4,052 first. A clean break above that area would open the path toward the liquidity zone around $4,104 and the upper OB area near $4,120–$4,130.
Buy setup 1
Condition:
Gold holds the Buy zone OB around $4,017–$4,030 and forms bullish rejection with lower timeframe MSS / CHOCH.
Entry: $4,017–$4,030
SL: below $3,984
TP1: $4,045–$4,052
TP2: $4,075
TP3: $4,104
TP4: $4,120–$4,130
Buy setup 2
Condition:
If gold breaks above the Sell FVG area and retests it as support, bullish continuation becomes stronger.
Entry: above $4,052 after breakout retest
SL: below $4,017
TP1: $4,075
TP2: $4,104
TP3: $4,120–$4,130
Buy setup 3
Condition:
If gold sweeps below the current buy zone but quickly reclaims $4,017–$4,030, this can create a stronger liquidity-trap buy setup.
Entry: after reclaim above $4,017–$4,030
SL: below the sweep low
TP1: $4,045–$4,052
TP2: $4,075
TP3: $4,104
Sell scalping setup
Condition:
Selling is not the main priority. A sell scalp is only valid if gold reaches the Sell FVG zone around $4,045–$4,052 and shows clear bearish rejection.
Entry: $4,045–$4,052 after rejection
SL: above $4,075
TP1: $4,030
TP2: $4,017
TP3: $3,984
Key levels
Current price area: $4,029
Buy zone OB: $4,017–$4,030
Day low liquidity: $3,984
Strong low liquidity: $3,942
Sell FVG reaction zone: $4,045–$4,052
Short-term liquidity: $4,104
Upper OB target zone: $4,120–$4,130
Bullish continuation confirmation: clean break above $4,052
Stronger bullish confirmation: clean break above $4,104
Bullish invalidation: clean 2H close below $3,984
My current view is that gold is trying to build a bullish recovery from the Buy zone OB. The Prime Gold plan is to avoid selling into demand and wait for confirmation around $4,017–$4,030. If buyers defend this area, gold may recover toward $4,045, $4,075, $4,104 and potentially the upper OB zone around $4,120–$4,130.
No confirmation, no trade.
Long 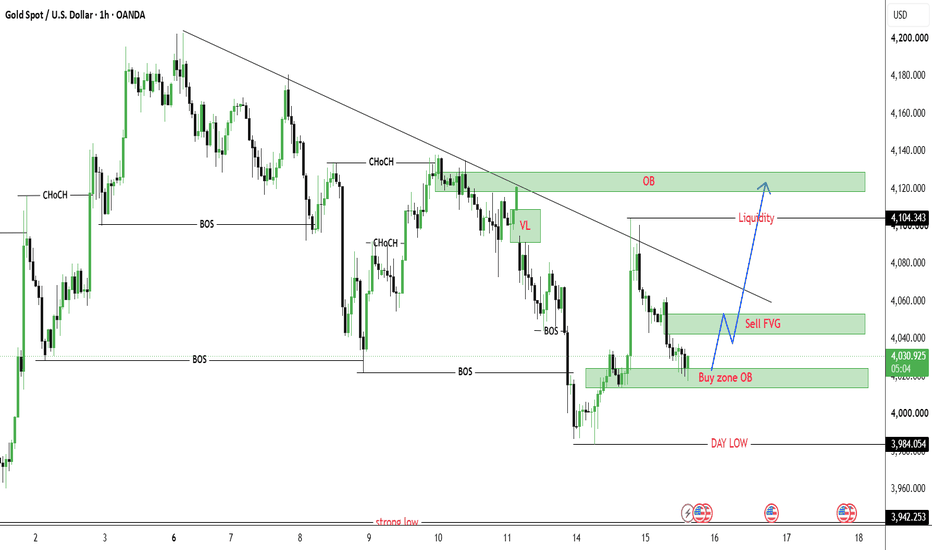
HFCL Limited (1W): Decoding the 2,700%+ Macro Rally & SM InflowOverview: HFCL Limited (NSE: HFCL) is displaying absolute dominance on the weekly (1W) timeframe. The stock is currently in a powerful, parabolic uptrend, trading near the ₹223 zone. This isn't just a technical rally; it is heavily backed by a massive influx of institutional capital, making it a prime candidate for momentum and trend traders.
Fundamental Catalyst (The "Smart Money" Factor):
The most striking element of this setup is the massive surge in Foreign Institutional Investor (FII) interest. As noted on the chart, HFCL appeared on the "14 FII Standouts" screener.
FII Holdings have more than doubled, jumping from 7.1% in March 2026 to a staggering 15.7% in June 2026 (QnQ).
Major New Entrants include heavyweight funds like BNP Paribas Financial Markets, Quadrature Capital Vector Sp Limited, and Smallcap World Fund, Inc. This kind of institutional accumulation provides immense structural support to the ongoing rally.
Key Technical Observations:
Macro Breakouts: The stock has successfully cleared multiple historical resistance ceilings, most notably breaching the ₹61.80 and ₹170.76 levels. It has recently pushed past the ₹221.48 mark, marking an extraordinary multi-year climb from its absolute bottom (a 2,700%+ structural move).
Moving Average Ribbon: The price is trading significantly above its primary weekly MA Ribbon (with the closest band at ₹157.12 and the deepest at ₹91.35). While this confirms an incredibly strong bullish trend, the wide separation also suggests the price is highly extended.
Overbought RSI: The weekly RSI is currently sitting high at 86.09 (above its MA of 84.01). While an RSI this high indicates extreme buyer enthusiasm and momentum, it also warrants caution for a potential short-term cooling off or sideways consolidation before the next leg up.
Key Levels to Watch:
Immediate Resistance: The recent swing high of ₹229.50. A weekly close above this opens the door to the psychological ₹250.00 level.
Immediate Support: The recent breakout zone at ₹221.48.
Macro Support: If a deeper mean-reversion occurs, the ₹170.76 structural level and the top of the MA ribbon (₹157.12) will act as major demand zones.
Conclusion:
The trend is your friend, and HFCL's trend is undeniably up. The aggressive FII buying justifies the premium valuation and the parabolic technical structure. For existing holders, trailing stop-losses below key weekly lows makes sense. For new entries, chasing here carries risk due to the overbought RSI; waiting for a slight retracement or a flag consolidation might offer a safer risk-to-reward ratio.
Disclaimer: This analysis is for educational purposes only and does not constitute financial advice. Please do your own research and manage your risk accordingly.  Long
Long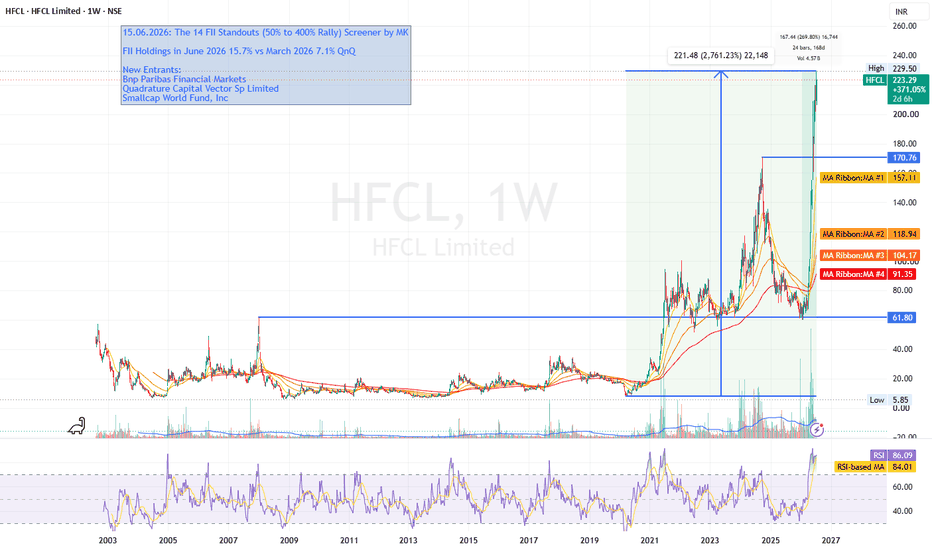
KSSMART: Massive FII Entry & Deep Retracement – A Hidden Setup?Overview: KS Smart Technologies Ltd (BSE: KSSMART) has experienced extreme volatility recently, going through a parabolic rally followed by a deep retracement. After hitting an All-Time High (ATH) of ₹290.95, the stock has corrected significantly and is currently trading around the ₹135.00 zone. However, a major fundamental catalyst combined with key support levels makes this an interesting chart to watch.
Fundamental Catalyst (The "Smart Money" Factor):
A critical detail driving the macro narrative is the significant institutional interest. KSSMART recently appeared on the "14 FII Standouts (50% to 400% Rally) Screener." More importantly, the Vikasa India EIF I Fund has entered with a massive 8.53% stake (14,000,000 shares) as of the March 2026 quarter. This strong Foreign Institutional Investor (FII) backing suggests long-term conviction despite the recent price correction.
Key Technical Observations:
Historical Breakouts: The chart clearly defines two massive structural breakouts. The "1st Major Breakout" occurred near ₹38.70, and the "2nd Major Breakout" happened at ₹99.10. Both levels serve as powerful historical reference points.
Current Price Action & Moving Averages: The stock has pulled back below its primary Moving Average Ribbon (which currently ranges from ₹140 to ₹179). The price is actively consolidating near the ₹135 level. To regain a strong bullish trend, the price will need to reclaim and close above this MA ribbon.
RSI Divergence / Recovery: The RSI on the daily timeframe is currently sitting at 41.32, having recently crossed above its RSI-based moving average (33.45). This indicates that the bearish momentum is cooling off, and we may be seeing early signs of a base forming.
Key Levels to Watch:
Immediate Resistance: The bottom of the MA ribbon at ₹140.36, followed by the heavier overhead resistance zone between ₹165 - ₹180.
Macro Target: The All-Time High at ₹290.95.
Critical Support: The ₹130 level is providing immediate support, but the ultimate macro support sits at the "2nd Major Breakout" line of ₹99.10. A breakdown below ₹99 would invalidate the broader bullish structure.
Conclusion:
KSSMART is currently in a "show me" phase. The deep pullback has washed out weak hands, bringing the price back to a more reasonable valuation following its 190%+ rally. With heavy FII backing, this zone between ₹100 and ₹135 could act as a significant accumulation area. Watch for a strong volume breakout above the ₹140 moving average to confirm the next leg up.
Disclaimer: This analysis is for educational purposes only and does not constitute financial advice. Please manage your risk and position sizing carefully.  Long
Long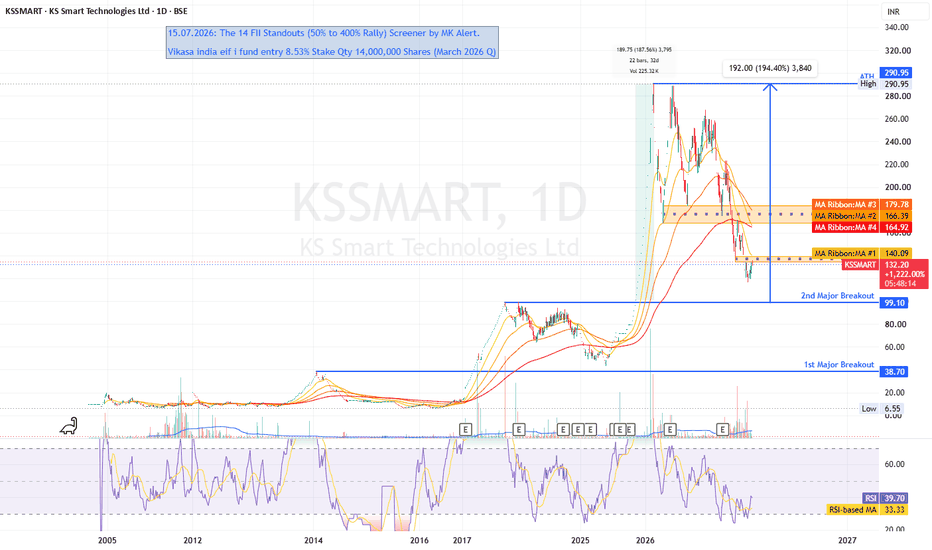
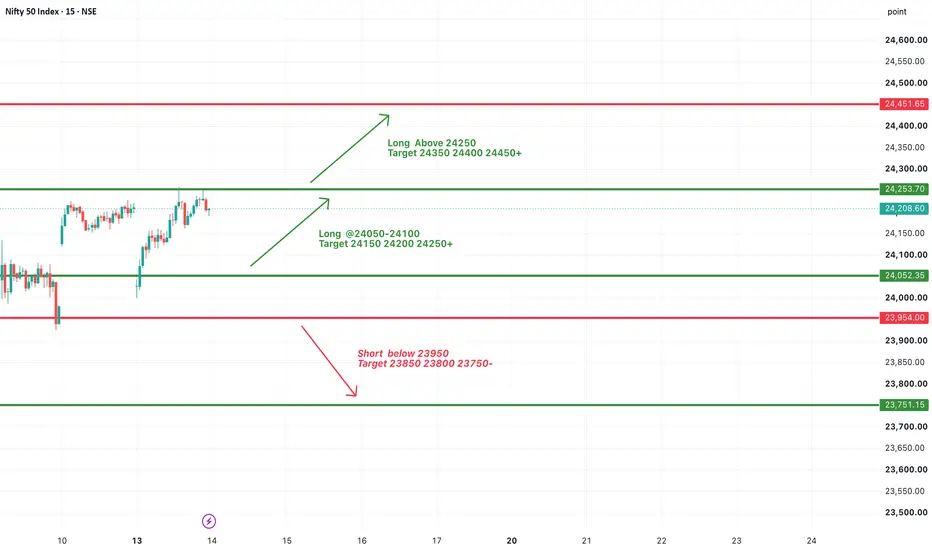
#NIFTY Intraday Support and Resistance Levels - 15/07/2026Nifty is expected to open with a slightly gap-up bias. The index is hovering near the crucial 24050 support zone, making today's opening important for determining the next intraday direction. Traders should wait for confirmation before initiating fresh positions, as sustained buying above support can trigger further upside.
The immediate support is placed at 24050–24100. If Nifty sustains above this zone after the slightly gap-up opening, traders can consider long positions with targets of 24150, 24200, and 24250. A decisive breakout above 24250 will confirm fresh bullish momentum and may extend the rally towards 24350, 24400, and 24450+.
On the downside, if Nifty slips below 23950, traders can consider short positions with targets of 23850, 23800, and 23750. A sustained breakdown below 23950 will strengthen the bearish trend and may accelerate the decline toward lower support levels.
Overall, a slightly gap-up opening is expected. As long as Nifty holds above the 24050 support zone, buying on dips remains the preferred strategy. Fresh short positions should only be considered after a confirmed breakdown below 23950, with strict stop-losses and disciplined profit booking at each target level.  Education

Core of Technical AnalysisCore of Technical Analysis
Technical Analysis is the study of past price movements, volume, and market trends to predict future price direction.
3 Main Principles:
Market Discounts Everything
All news, emotions, and fundamentals are already reflected in price.
Prices Move in Trends
Markets usually move in uptrend, downtrend, or sideways trends.
History Repeats Itself
Human psychology creates repeating chart patterns.
Key Tools:
Charts (Candlestick, Line, Bar)
Support & Resistance
Trendlines
Indicators (RSI, MACD, Moving Averages)
Volume Analysis
Patterns (Head & Shoulders, Double Top, Triangle)  Education

 Education
Education

XAUUSD — Is 4,080 the Sell Trap?Gold is still moving inside a descending price channel.
Price is trading around 4,050 - 4,060, right near the middle zone of the channel.
This is not a clean buy area.
And it is not the best place to chase a sell either.
For me, today’s chart is about one question:
Will gold retest the sell zone first before dropping deeper?
The simple read
Gold remains under short-term bearish pressure while price stays inside the descending channel.
The nearest sell reaction area is around 4,080 - 4,091.
This zone also lines up with the Fibonacci reaction area and the upper part of the current correction.
If gold pushes into this zone and shows rejection, sellers may try to take control again.
The first downside area to watch is 4,043 - 4,027.
If that support fails, the next deeper target becomes 3,985, then the key support zone near 3,945.
Key price zones
Current price area: 4,050 - 4,060
Middle channel zone: 4,050
Sell reaction zone: 4,080 - 4,091
First support: 4,043 - 4,027
Fibo extension support: 3,985
Key support zone: 3,945
Bearish pressure weakens above: 4,091
Trading plan
📉 Sell reaction scenario
If gold retests 4,080 - 4,091 and shows clear rejection:
Sellers may try to push price back toward 4,043 - 4,027.
If this support zone breaks, the next downside area to watch is 3,985.
A deeper move may target the key support zone near 3,945.
I prefer waiting for rejection confirmation instead of selling randomly in the middle.
📈 Short-term bounce scenario
If gold holds above 4,043 - 4,027:
A small recovery may appear.
Price could retest 4,080 - 4,091 again.
But this bounce is still only a reaction while gold remains inside the descending channel.
A stronger bullish view needs price to break and hold above 4,091.
📉 Deeper correction scenario
If 4,027 fails clearly:
The correction structure becomes stronger.
Gold may continue toward 3,985, where the Fibonacci extension support is waiting.
If buyers still fail to react there, the key support zone near 3,945 becomes important.
Gold is not giving a clean reversal signal yet.
The chart is still respecting the descending channel.
That means I do not want to chase the current price.
I want to see either:
A clean rejection from 4,080 - 4,091.
Or a confirmed reaction from 4,043 - 4,027.
Main view:
Gold remains cautious below 4,091.
4,080 - 4,091 is the sell reaction zone.
4,043 - 4,027 is the first support.
3,985 and 3,945 are the deeper zones if the correction continues.
Reaction first.
Confirmation second.
Trade last.
No confirmation = no trade.
Do you think gold will reject from 4,080 - 4,091, or break the channel first? Short 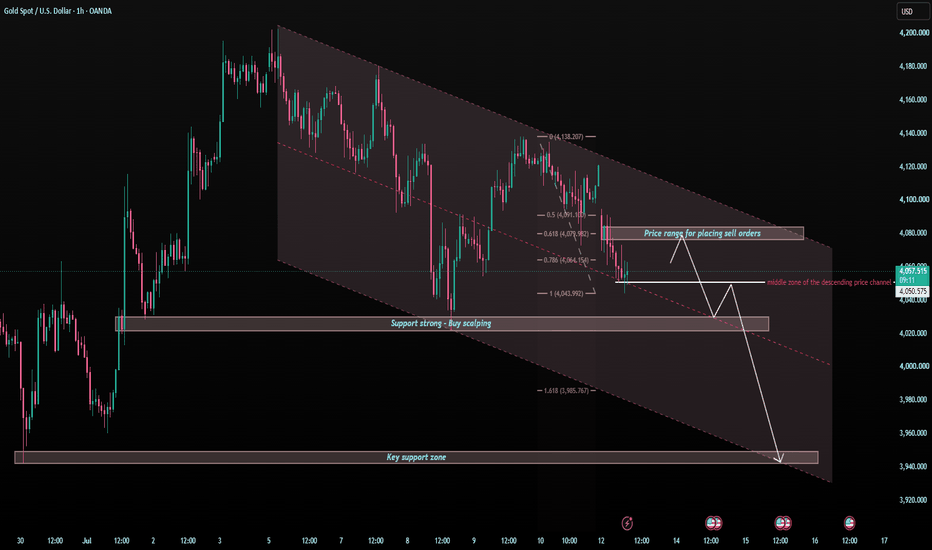
XAUUSD — Bearish Pressure Below Liquidity Sell Zone
Fundamental Analysis
Gold remains sensitive to USD momentum, Treasury yields, and upcoming U.S. macro data. For now, the market is still showing defensive price action, with sellers controlling the structure after price failed to hold above the previous trendline.
Technical Analysis
On the 1H chart, XAUUSD is trading around 4,026 after breaking below the short-term uptrend structure. The nearest reaction area is the liquidity buy scalping zone at 3,998 - 4,004, where price may create a short bounce. However, the main area to watch is 4,074 - 4,080. This zone aligns with previous liquidity, Fibonacci reaction, and the broken trendline retest. If gold recovers into this area and rejects, the bearish continuation setup remains valid toward the lower target around 3,890.
Important Key Levels
Current price: 4,026
Buy scalping zone: 3,998 - 4,004
Liquidity sell test zone: 4,074 - 4,080
Short-term resistance: 4,040 - 4,050
Main downside target: 3,890 - 3,885
Invalidation: above 4,080
Trading Scenario
Main Sell Setup
Entry: 4,074 - 4,080
Stop Loss: 4,105
Take Profit 1: 4,004
Take Profit 2: 3,950
Take Profit 3: 3,890 - 3,885
Sell Condition
Wait for gold to recover into the 4,074 - 4,080 liquidity sell test zone. A valid sell setup needs bearish rejection, such as a long upper wick, failed reclaim, bearish engulfing candle, or price closing back below the zone. If price rejects and breaks below 3,998 - 4,004, downside momentum may expand toward 3,950 and 3,890. If price breaks and holds above 4,080, the sell setup becomes weaker.
Overall View
The main view remains bearish while XAUUSD trades below the broken trendline and under the liquidity sell test zone. Gold may bounce first from 3,998 - 4,004, but the preferred plan is to wait for a cleaner sell reaction around 4,074 - 4,080 before looking for continuation toward the lower Fibonacci target.
Do you share the same bearish view on gold, or are you waiting for a stronger rejection from the 4,074 - 4,080 zone?
Short 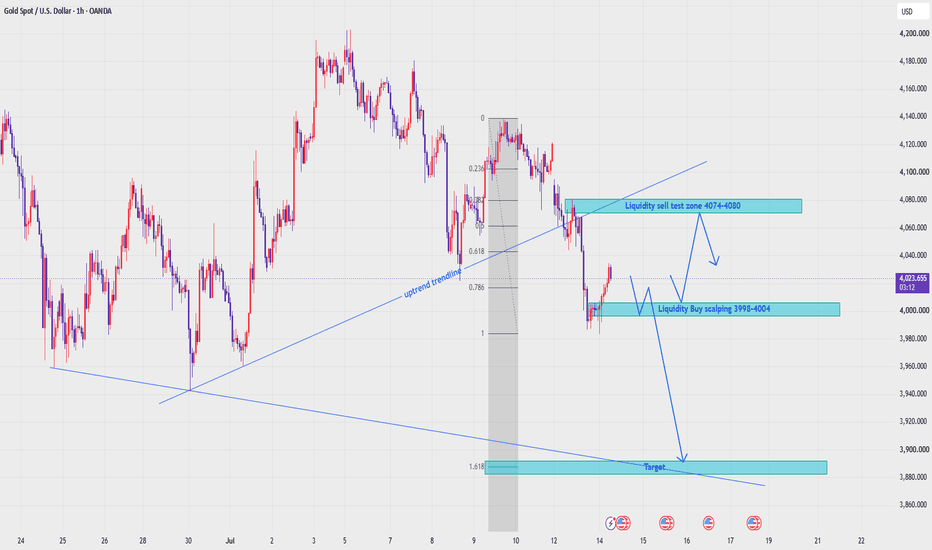
XAUUSD — Bearish Structure Holding Below Trendline
Gold is trading around $4,022 after rejecting from the short-term recovery area and moving back into the FVG sideways zone. The current structure remains bearish because price is still trading below the descending trendline, while the recent BOS confirms that sellers are still controlling the short-term direction.
From an SMC perspective, gold failed to build a strong bullish recovery after the previous downside move. Price rejected from the VL area, broke lower structure, and is now consolidating inside the FVG sideways area. This type of movement usually shows temporary accumulation before the next directional move, but as long as price stays below the OB + trendline sell zone, the main bias remains bearish.
The key area to watch is the sell zone around $4,065–$4,078. This zone aligns with the descending trendline and the previous supply reaction, making it the main area where sellers may defend the structure again. If gold pulls back into this zone and forms bearish rejection, another downside continuation toward the day low around $3,984 and the strong low near $3,942 remains possible.
Sell setup 1
Condition:
Gold pulls back into the OB + trendline sell zone around $4,065–$4,078 and forms bearish rejection with lower timeframe MSS / CHOCH.
Entry: $4,065–$4,078
SL: above $4,100
TP1: $4,040
TP2: $4,000
TP3: $3,984
TP4: $3,942
Sell setup 2
Condition:
If gold breaks below the FVG sideways area and retests it as resistance, bearish continuation remains valid without waiting for a deeper pullback.
Entry: below $4,015 after breakdown retest
SL: above $4,040
TP1: $4,000
TP2: $3,984
TP3: $3,960
TP4: $3,942
Sell setup 3
Condition:
If gold sweeps above the FVG sideways area but fails to break the trendline, this can create a liquidity-trap sell setup.
Entry: after rejection below $4,065–$4,078
SL: above the sweep high
TP1: $4,022
TP2: $4,000
TP3: $3,984
Buy scalping setup
Condition:
Buying is not the main priority. A buy scalp is only valid if gold sweeps the day low around $3,984 and forms a strong bullish rejection.
Entry: $3,984 after bullish rejection
SL: below $3,960
TP1: $4,000
TP2: $4,022
TP3: $4,040
Key levels
Current price area: $4,022
FVG sideways area: $4,015–$4,040
OB + trendline sell zone: $4,065–$4,078
VL reaction area: $4,095–$4,110
Day low liquidity: $3,984
Strong low liquidity: $3,942
Bearish continuation confirmation: clean break below $4,015
Stronger bearish confirmation: clean break below $3,984
Bearish invalidation: clean 2H close above $4,100
My current view is that gold remains in a bearish structure while price stays below the descending trendline and the OB sell zone. The Prime Gold plan is to avoid buying too early inside the FVG sideways area and wait for either a pullback into $4,065–$4,078 or a clean breakdown below $4,015 before looking for sell confirmation. If sellers continue to defend the trendline, gold may extend lower toward $3,984 and potentially $3,942.
No confirmation, no trade.
Short 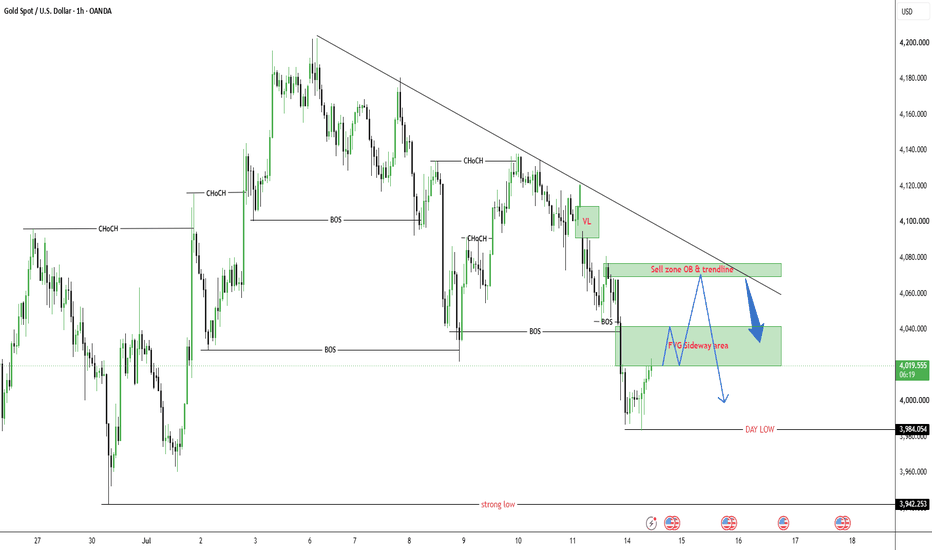
XAUUSD — Bearish Structure, Sell Around OBXAUUSD — Bearish Structure, Sell Around OB
Gold is trading around $4,057 after breaking down from the short-term recovery structure. Price has rejected from the upper reaction area and is now pressing directly into the sell-side liquidity around $4,055, showing that sellers are still controlling the current structure.
From an SMC perspective, gold has already shown a bearish shift after failing to hold the previous bullish recovery. The recent move created weakness below the local BOS area, then price dropped strongly into the lower liquidity zone. As long as gold stays below the $4,078–$4,085 OB sell zone and below the $4,121 buy-side liquidity area, the main structure remains bearish.
The main plan is to avoid buying too early while price is still under the OB zone. If gold pulls back into $4,078–$4,085 and forms bearish rejection, this area can act as the key sell zone before another downside continuation toward the buy scalping liquidity around $4,020–$4,030 and the lower OB zone near $3,960–$3,975.
Sell setup 1
Condition:
Gold pulls back into the OB sell zone around $4,078–$4,085 and forms bearish rejection with lower timeframe MSS / CHOCH.
Entry: $4,078–$4,085
SL: above $4,105
TP1: $4,055
TP2: $4,020–$4,030
TP3: $3,975
TP4: $3,960
Sell setup 2
Condition:
If gold breaks cleanly below $4,055 and retests this level as resistance, bearish continuation remains valid without waiting for a deeper pullback.
Entry: below $4,055 after breakdown retest
SL: above $4,078
TP1: $4,030
TP2: $4,020
TP3: $3,975
TP4: $3,960
Sell setup 3
Condition:
If gold sweeps back above the OB zone but fails to reclaim $4,121, this can create a stronger liquidity-trap sell setup.
Entry: after rejection below $4,121
SL: above $4,135
TP1: $4,078
TP2: $4,055
TP3: $4,020–$4,030
Buy scalping setup
Condition:
Buying is not the main priority. A buy scalp is only valid if gold sweeps the $4,020–$4,030 liquidity zone and forms a strong bullish rejection.
Entry: $4,020–$4,030 after bullish rejection
SL: below $4,000
TP1: $4,055
TP2: $4,078–$4,085
TP3: $4,105
Key levels
Current price area: $4,057
Immediate sell-side liquidity: $4,055
OB sell zone: $4,078–$4,085
VL reaction zone: $4,090–$4,105
Buy-side liquidity: $4,121
Buy scalping liquidity: $4,020–$4,030
Lower OB target zone: $3,960–$3,975
Major upper liquidity: $4,221
Bearish continuation confirmation: clean break below $4,055
Stronger bearish confirmation: clean break below $4,020
Bearish invalidation: clean 2H close above $4,121
My current view is that gold remains in a bearish structure while price stays below the OB sell zone. The Prime Gold plan is to wait for a pullback into $4,078–$4,085 or a clean breakdown below $4,055 before looking for sell confirmation. If sellers continue to defend the OB, gold may extend lower toward $4,020–$4,030 and potentially $3,960–$3,975.
No confirmation, no trade.
Short 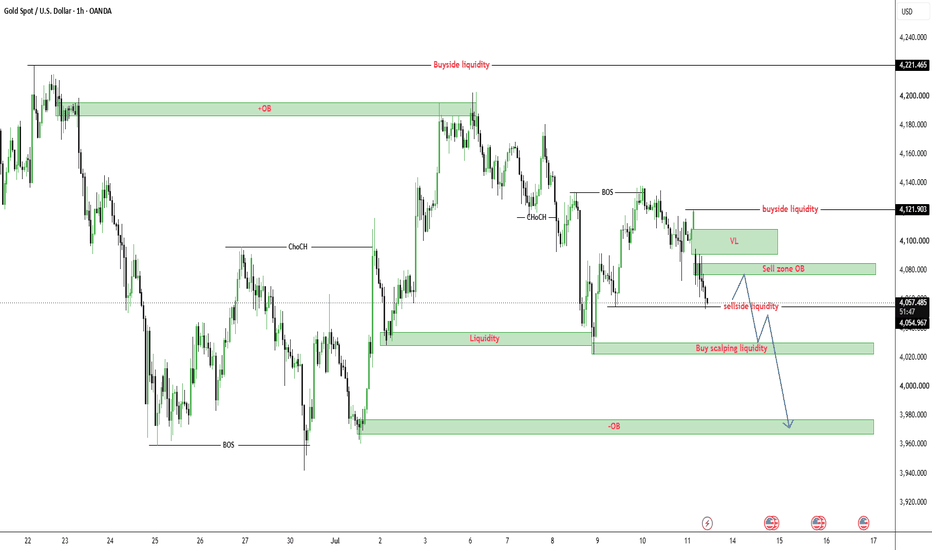
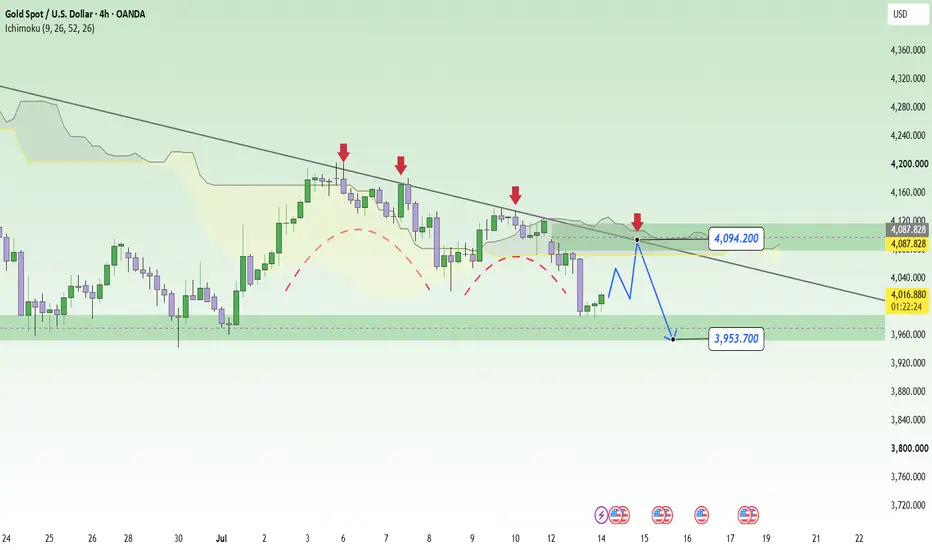
XAUUSD: Bearish Trendline Continues to Cap Recovery MomentumXAUUSD has bounced off the support zone around 3,960–3,980, but the current rebound is insufficient to alter the bearish structure on the H4 timeframe. Prices remain below the descending trendline—which has repeatedly triggered selling pressure—while the area above is further reinforced by the Ichimoku Cloud and a resistance zone around 4,087–4,094.
Notably, recent highs have been progressively lower. Whenever gold approaches the bearish trendline, buying momentum quickly fades and sellers step back in. This suggests the current rally is likely just a technical rebound following the sharp decline, rather than a confirmed reversal signal.
On the macroeconomic front, gold remains under pressure from the US dollar and US bond yields, which are holding at elevated levels ahead of inflation data. Rising oil prices have also fueled concerns that the Fed may need to maintain a hawkish monetary policy for longer, thereby increasing the opportunity cost of holding gold.
If the price rallies to the 4,087–4,094 range but fails to secure a firm close above the bearish trendline, selling pressure could drive XAUUSD back toward the 3,953.7 level. This is a critical support level and a clear downside target on the chart.
Suggested Strategy: Sell around 4,087–4,094 upon signs of rejection; Take Profit (TP) at 3,953.7; invalidate the trade if the price closes above 4,110 on the H4 timeframe. Short 
#NIFTY Intraday Support and Resistance Levels - 14/07/2026Nifty is expected to open with a gap-down bias near the 24,000 psychological support zone. Despite the weak opening, the index continues to hold above the key 24050 support area, indicating that buyers may step in if this level sustains. Traders should avoid aggressive positions at the open and wait for confirmation before entering trades.
The immediate support is placed at 24050–24100. If Nifty sustains above this zone after the gap-down opening, traders can consider long positions with targets of 24150, 24200, and 24250. A decisive breakout above 24250 will confirm fresh bullish momentum and may extend the rally towards 24350, 24400, and 24450+.
On the downside, if Nifty slips below 23950, traders can consider short positions with targets of 23850, 23800, and 23750. A sustained breakdown below this level will indicate renewed selling pressure and may accelerate the downside move.
Overall, a gap-down opening near the 24,000 level is expected. As long as Nifty holds above the 24050 support zone, buying on dips remains the preferred strategy. Fresh short positions should only be considered after a confirmed breakdown below 23950, with strict stop-losses and disciplined profit booking at each target level. #BANKNIFTY Intraday PE & CE Levels(14/07/2026)Bank Nifty is expected to open with a gap-down bias. Despite the weak opening, the index continues to trade above the crucial 58050 support zone, keeping the overall intraday structure positive. Traders should avoid chasing the opening move and wait for confirmation before entering fresh positions.
The immediate support is placed at 58050–58100. If Bank Nifty sustains above this zone and attracts buying interest, traders can consider CE positions with targets of 58250, 58350, and 58450. A decisive breakout above 58550 will confirm fresh bullish momentum and may extend the rally towards 58750, 58850, and 58950+.
On the downside, if Bank Nifty slips below 57950–57900, traders can consider PE positions with targets of 57750, 57650, and 57550. A sustained breakdown below 57450 will strengthen the bearish trend and may push the index towards 57250, 57150, and 57050.
Overall, a gap-down opening is expected. As long as Bank Nifty holds above the 58050 support zone, buying on dips remains the preferred strategy. Fresh short positions should only be considered after a confirmed breakdown below 57950, with strict stop-losses and disciplined profit booking at each target level. XAUUSD: Long-term trend line continues to exert pressureFollowing a brief rebound late last week, XAUUSD once again approached the downtrend line extending from late June but failed to achieve a breakout. Prices quickly reversed and are currently hovering just above the short-term support zone around 4,058, indicating cautious buying sentiment ahead of a series of key US economic data releases this week.
Fundamentally, the market favors holding the USD as US bond yields remain elevated and investors await the CPI report and fresh signals from the Federal Reserve. Reuters also notes that the dollar continues to be supported by expectations that interest rates will remain higher for longer, prompting a temporary shift of capital away from non-yielding assets like gold.
On the H4 timeframe, the price remains below the downtrend line and has yet to clear the 4,058–4,080 resistance zone. This area also represents an Ichimoku convergence point, raising the likelihood of another rejection. Should selling pressure persist in this zone, XAUUSD could break through the nearest support level and extend its decline toward the 3,965 area.
Entry: Sell around 4,058–4,080 upon a rejection signal.
TP: 3,965
SL: Above 4,100 Short 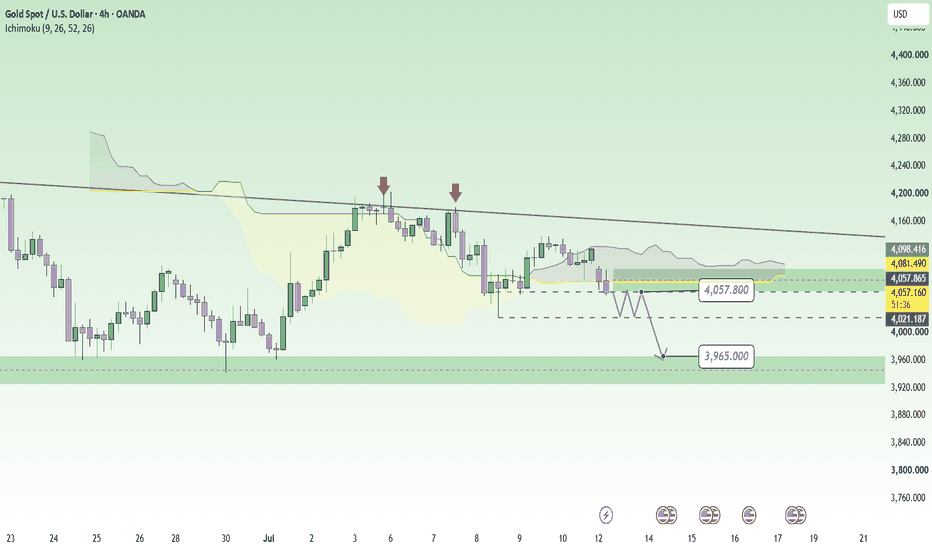
HCLTECH Falling Wedge Breakout After Strong Q1 FY27 Results📊 HCL Technologies: Daily Technical Snapshot – Falling Wedge Breakout After Strong Q1 FY27 Results
📊 STWP Technical Analysis
________________________________________
MARKET STRUCTURE SNAPSHOT | NSE: HCLTECH | DAILY
Closing Price: 1,221.20 (+57.10 | +4.91%)
Core Trend: Recovery within Long-Term Uptrend
Market State: Confirmed Falling Wedge Breakout
Price Structure: Price has broken above a multi-month Falling Wedge, supported by a strong bullish breakout candle and significantly higher trading volume. The breakout signals weakening selling pressure and improving buyer conviction.
________________________________________
OPERATIONAL PRICE GRID & KEY REFERENCE LEVELS
Model Reference Level: 1,237.00
Hard Invalidation Level: 1,119.00
Structural Risk: 118.00 (9.54%)
Resistance Levels: R1 1,251.47 | R2 1,281.73 | R3 1,326.47
Support Levels: S1 1,176.47 | S2 1,131.73 | S3 1,101.47
Range Structure: Low 1,119.00 | High 1,326.47
Higher Timeframe Observation Zones: 1,355.00 | 1,472.95
________________________________________
MOMENTUM, PARTICIPATION & CPR DATA
Volume Profile: 9.03 Million Shares
Volume Character: Very High Relative Participation
RSI: 62.89 (Strong Momentum Zone)
ADX: 14.20 (Early Trend Development Phase)
ROC: +10.78%
MACD Status: Fresh Bullish Momentum Structure
CCI: +174.99 (Strong Bullish Momentum)
Stochastic Reading: 92.37 (Extended Momentum Zone)
Current Bias: BUY ON PULLBACKS
CPR State: Bullish Zone | CPR Moving Up (Wide)
Today's CPR: Pivot 1,169.70 | Top 1,166.90 | Base 1,172.50
Tomorrow's CPR (Projected): Pivot 1,206.75 | Top 1,213.95 | Base 1,199.50
________________________________________
📚 EDUCATIONAL OBSERVATION
HCL Technologies has confirmed a breakout from a multi-month Falling Wedge, a chart pattern widely regarded as a bullish reversal formation that often develops after an extended corrective phase. The breakout is supported by a strong bullish candle, improving momentum indicators and significantly higher trading volume, reflecting renewed buying interest and strengthening market participation.
A Falling Wedge forms as prices create progressively lower highs and lower lows within converging trendlines. As the pattern matures, selling pressure gradually weakens while buyers begin accumulating at lower levels. A decisive breakout above the upper boundary often signals that the corrective phase may be ending and that a fresh upward trend could be developing.
Momentum indicators continue to support the improving technical structure. The RSI at 62.89 reflects healthy bullish momentum without entering an extreme overbought zone. MACD has generated a fresh bullish crossover, indicating strengthening upside momentum, while the ROC of +10.78% highlights strong price acceleration. The CCI reading of +174.99 confirms robust buying pressure, and the Stochastic reading of 92.37 reflects sustained momentum, although elevated readings also suggest that short-term consolidations or pullbacks remain a normal possibility after a sharp breakout.
The projected Central Pivot Range (CPR) for the next trading session has shifted higher, with the projected Pivot at 1,206.75. A rising and widening CPR generally reflects improving market acceptance of higher prices and often supports trend continuation when accompanied by healthy participation. The current dashboard therefore maintains a constructive outlook with a preference for buying on pullbacks rather than chasing extended moves.
Immediate attention remains focused on the resistance zone between 1,251 and 1,282. A sustained move above this region could strengthen the breakout further and bring the higher-timeframe observation zones near 1,355 and 1,473 into focus. On the downside, 1,176 remains the first important support, while the structural invalidation level is positioned near 1,119.
________________________________________
🏢 BUSINESS & FUNDAMENTAL UPDATE
HCL Technologies recently announced its Q1 FY27 financial results (quarter ended June 2026), delivering a strong operational performance despite a challenging environment for the global IT services sector.
Key Highlights
Net Profit: 4,624 crore, up 20.32% year-on-year from 3,843 crore.
Revenue: 34,579 crore, representing 13.94% year-on-year growth from 30,349 crore.
Interim Dividend: The Board declared an interim dividend of 12 per equity share (face value 2) for FY27. The record date is 17 July 2026, while the dividend will be paid on 27 July 2026.
FY27 Guidance: Management reiterated its constant currency revenue growth guidance of 1–4%, maintaining its earlier outlook despite macroeconomic uncertainty.
The quarterly performance comes at a time when the broader IT sector continues to face headwinds from cautious enterprise technology spending, reduced discretionary budgets and increasing discussions around AI-driven pricing pressure across traditional IT services. Against this backdrop, HCLTech's stronger-than-expected profitability, double-digit revenue growth and stable guidance demonstrate operational resilience and disciplined execution.
Interestingly, the stock had already attracted strong buying interest ahead of the earnings announcement, rallying nearly 5% in the previous trading session. The combination of robust quarterly earnings, a healthy dividend announcement, stable management guidance and a technically confirmed Falling Wedge breakout provides both fundamental and technical support for the improving market structure.
________________________________________
📖 Educational Note
Support and resistance levels should be viewed as observation zones rather than predictive targets. Chart patterns, price action, volume analysis, momentum indicators and CPR are educational tools that help market participants understand evolving market structure within a disciplined risk-management framework. Similarly, strong quarterly results can improve investor sentiment but should always be evaluated alongside broader market conditions, valuation and risk management principles.
________________________________________
⚠️ Disclaimer
This analysis is provided strictly for educational and informational purposes.
It does not constitute financial, investment or trading advice and should not be interpreted as a recommendation to buy or sell any security.
Stock market investments are subject to market risks, including the possible loss of capital.
Past performance, historical observations, chart patterns, earnings performance and technical indicators do not guarantee future results.
Please conduct your own research and consult a SEBI-registered investment adviser before making investment decisions.
STWP assumes no responsibility or liability for any financial loss arising directly or indirectly from the use of this analysis.
 Long
Long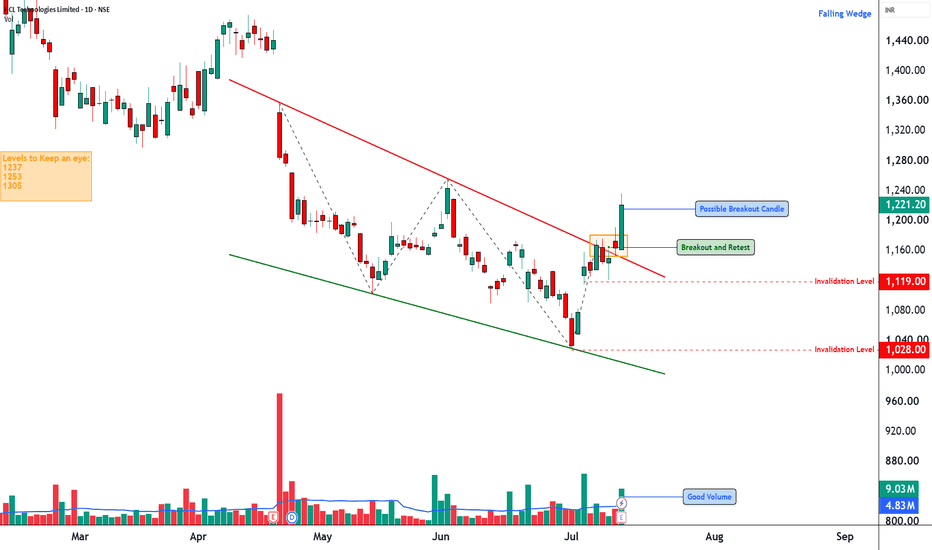
Bitcoin Remains Bearish Below $64K–$66K Despite Modest ReboundBitcoin has rebounded modestly from its July 1 low, while Ethereum has shown relative strength by avoiding a new July low.
However, Bitcoin continues to form lower highs and lower lows, keeping the broader trend bearish. The recent sideways action looks more like consolidation than a confirmed recovery.
Key Trading Levels
Resistance: $64,000–$66,000
Support: $53,000–$56,000
Downside Target: $40,000–$45,000
Outlook: Bearish to sideways
Bitcoin remains bearish unless it can reclaim and hold above $66,000.