Layered Structures: Multi patterns formations Explained The Ascending Parallel Channel
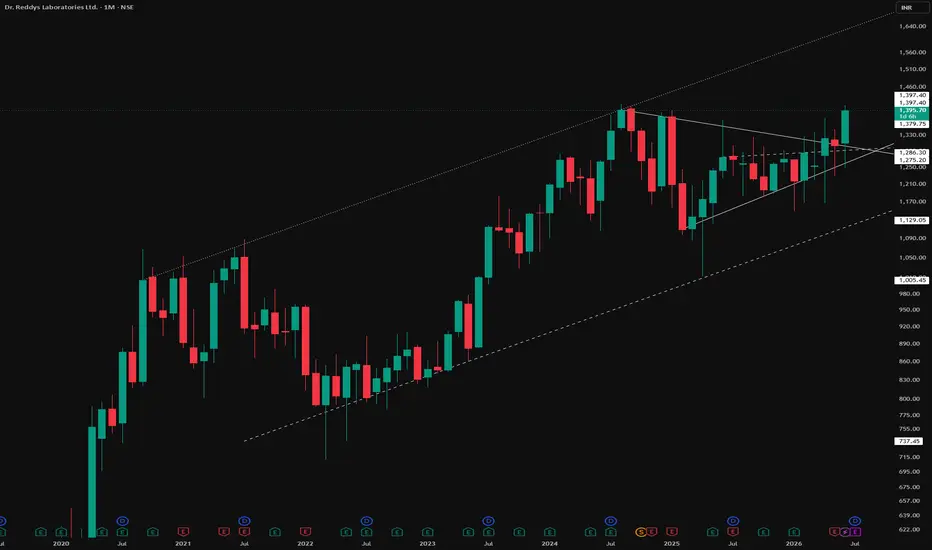
Marked by the dotted lines, this is a rising channel — two parallel trendlines, both sloping upward, containing price action between them. It reflects a steady, structured uptrend where price oscillates between a rising support line and a rising resistance line.
The Symmetrical Triangle Within It
Inside this channel, a symmetrical triangle has formed — converging highs and lows compressing into a tighter range. What stands out here is its location: this triangle consolidated near the upper half of the channel, not near the base.
Why Location Matters
This is the core lesson of this chart. The same pattern can behave very differently depending on where it forms inside a larger structure:
1) When consolidation happens near the bottom of a channel, a breakout from there is often referred to as a base breakout — these tend to be the cleaner, more reliable setups to observe, since price is breaking out from a zone of accumulated support.
2) When consolidation happens near the top of a channel, a breakout from there is more of a horizontal top breakout — these are generally less favorable for trading and are better suited for observation only.
The Bigger Picture
This chart is a reminder that multiple patterns often exist within each other, and recognizing not just the pattern but where it sits inside the broader structure is what separates surface-level pattern reading from a deeper understanding of price behavior.
Disclaimer: This post is for educational and informational purposes only. It does not constitute financial advice, a forecast, or a recommendation to buy, sell, or hold any security. Please conduct your own research and consult a licensed financial advisor before making any investment decisions.
XAUUSD — Corrective Recovery After Rejecting $4,022 Low
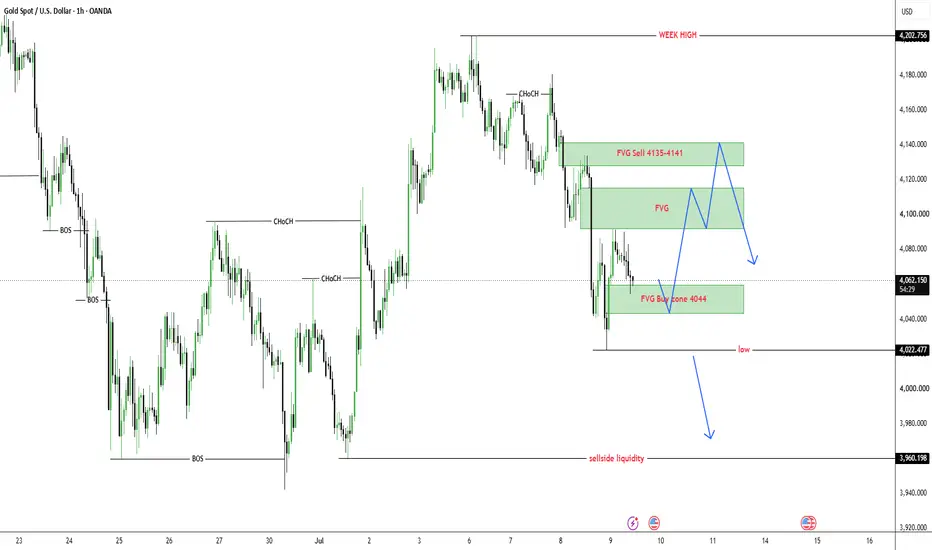
Gold is trading around $4,062 after rejecting the lower area near $4,022. The market failed to continue the immediate downside move, so today gold may first create a corrective recovery before deciding the next larger direction.
From an SMC perspective, gold has already swept the lower liquidity near $4,022 and reacted from the FVG buy zone around $4,044–$4,060. This reaction shows that sellers may be losing short-term momentum, but the overall structure is not fully bullish yet. Price still needs to reclaim the upper FVG areas before a stronger recovery can be confirmed.
The main plan for today is to watch how gold reacts after the rejection from $4,022. If price holds above the FVG buy zone and forms bullish confirmation, gold may correct higher toward the middle FVG area first, then the FVG sell zone around $4,135–$4,141. That upper zone remains important because sellers may defend the structure there.
Buy setup 1
Condition:
Gold holds above the FVG buy zone around $4,044–$4,060 and forms bullish rejection with lower timeframe MSS / CHOCH.
Entry: $4,044–$4,060
SL: below $4,022
TP1: $4,090
TP2: $4,110–$4,115
TP3: $4,135–$4,141
Buy setup 2
Condition:
If gold breaks above the middle FVG area and retests it as support, the corrective recovery can continue toward the upper sell zone.
Entry: above $4,115 after breakout retest
SL: below $4,080
TP1: $4,135–$4,141
TP2: $4,160
TP3: $4,202 weekly high
Sell setup 1
Condition:
Gold reaches the FVG sell zone around $4,135–$4,141 and shows clear bearish rejection.
Entry: $4,135–$4,141 after rejection
SL: above $4,160
TP1: $4,090
TP2: $4,044–$4,060
TP3: $4,022
Sell setup 2
Condition:
If gold fails to hold above $4,022 and breaks the low cleanly, the correction view becomes invalid and sell-side liquidity may become the next target.
Entry: below $4,022 after breakdown retest
SL: above $4,060
TP1: $4,000
TP2: $3,980
TP3: $3,960 sell-side liquidity
Key levels
Current price area: $4,062
FVG buy zone: $4,044–$4,060
Rejected low: $4,022
Middle FVG reaction zone: $4,090–$4,115
FVG sell zone: $4,135–$4,141
Short-term resistance: $4,160
Weekly high liquidity: $4,202
Sell-side liquidity: $3,960
Bullish correction confirmation: clean break above $4,115
Stronger bullish confirmation: clean break above $4,141
Bearish continuation confirmation: clean break below $4,022
My current view is that gold may correct higher today after rejecting the decline at $4,022. The Prime Gold plan is to avoid selling low after the sweep and wait for either a buy confirmation around $4,044–$4,060 or a clearer sell reaction from $4,135–$4,141. If the $4,022 low breaks cleanly, the downside path toward $3,960 becomes active again.
No confirmation, no trade.
 Long
Long
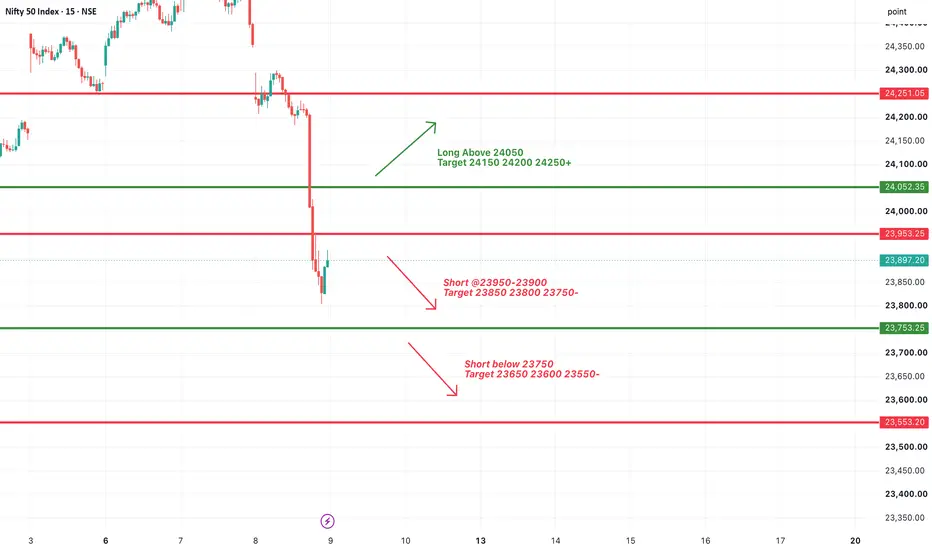
#NIFTY Intraday Support and Resistance Levels - 09/07/2026Nifty is expected to open with a slightly gap-up bias after yesterday's sharp decline. However, the overall trend remains bearish, and any early pullback should be treated cautiously unless the index reclaims key resistance levels.
The immediate resistance is placed at 23950–24000. If Nifty fails to sustain above this zone, traders can consider short positions with targets of 23850, 23800, and 23750. A decisive breakdown below 23750 will confirm fresh bearish momentum and may extend the decline towards 23650, 23600, and 23550.
On the upside, if Nifty recovers strongly and sustains above 24050, traders can consider long positions with targets of 24150, 24200, and 24250+. The bullish momentum will strengthen only after a sustained move above this resistance zone.
Overall, a slightly gap-up opening is expected, but the index remains under selling pressure. Unless Nifty sustains above 24050 after the initial volatility, traders should prefer selling on rise. Follow strict stop-losses and book profits gradually at each target level. #BANKNIFTY Intraday PE & CE Levels(09/07/2026)Bank Nifty is expected to open with a gap-down bias after the sharp bearish breakdown seen in the previous session. The index is currently attempting a pullback from the 56550 support zone, but the overall trend remains weak unless key resistance levels are reclaimed.
The immediate support is placed at 56550. If Bank Nifty sustains above this level and confirms buying momentum, traders can consider CE positions above 56550 with upside targets of 56750, 56850, and 56950+. However, the recovery will gain further strength only after a decisive move above 56950.
On the downside, the immediate selling zone is 56450–56400. If the index breaks below this range, traders can consider PE positions with targets of 56250, 56150, and 56050. A sustained breakdown below 55950 will confirm fresh bearish momentum and may extend the decline towards 55750, 55650, and 55550.
Overall, a gap-down opening is expected. Traders should avoid aggressive buying unless Bank Nifty sustains above 56550 after the opening volatility. If the index fails to hold support, selling pressure is likely to continue. Follow strict stop-losses and book profits gradually at each target level. MASON XAUUSD – Short-Term Sell Bias Below Ichimoku
XAUUSD is trading around 4,125 after failing to show a clear bullish continuation. Price is still under the Ichimoku resistance area, and the buying pressure looks weak around the current recovery zone.
The priority view remains sell with the short-term trend, especially if gold retests the sell order liquidity zone near the descending trendline and Fibonacci area.
Technical View
Gold is currently moving below the Ichimoku structure, which shows that buyers have not fully regained control. The cloud and Ichimoku lines above price are acting as dynamic resistance, so any recovery should still be treated carefully.
The recent bounce from 4,096 shows that buyers reacted from support, but the move is not strong enough to confirm a clean bullish reversal. Price is still below the trendline resistance, and the structure remains corrective.
The 4,135–4,145 area is the key sell order liquidity zone on the chart. This zone is important because it aligns with the descending trendline, Fibonacci reaction area, and short-term Ichimoku resistance. If gold reaches this area and rejects, it may confirm another lower high before continuation lower.
The 4,096 level is the nearest support. If price breaks below this area, bearish pressure may continue toward the Fibonacci 50 reaction zone around 4,070–4,080.
The deeper downside target is around 4,035–4,045, which is marked as the next target zone on the chart. This area becomes more likely if gold loses 4,096 and fails to recover above the sell zone.
Key Zones
Current price: 4,125
Sell order liquidity zone: 4,135–4,145
Ichimoku resistance area: 4,151–4,156
Nearest support: 4,096
Fibonacci 50 reaction zone: 4,070–4,080
Downside target: 4,035–4,045
Major resistance: 4,221
Invalidation: above 4,156
Trading Plan
Sell Priority: 4,135–4,145
Condition: wait for bearish rejection, failed breakout above the trendline, or price staying below the Ichimoku resistance area.
SL: above 4,156
TP1: 4,096
TP2: 4,070–4,080
TP3: 4,035–4,045
Alternative Scenario
If gold breaks below 4,096 directly, wait for a retest of this level as resistance before looking for sell continuation toward 4,070 and 4,035.
Buy View
Buy is not the priority while price remains below the Ichimoku structure and descending trendline. A short-term buy reaction may appear near 4,070–4,080, but it needs clear bullish confirmation first.
Final View
Overall, gold has not confirmed a strong bullish reversal yet. Price is still under Ichimoku pressure, and the cleaner plan is to watch for sell confirmation around 4,135–4,145. If this zone rejects, the next downside focus remains 4,096, 4,070, and 4,035.
Will gold reject from the trendline and Ichimoku zone, or break above 4,156 to weaken the short-term sell view?
Short 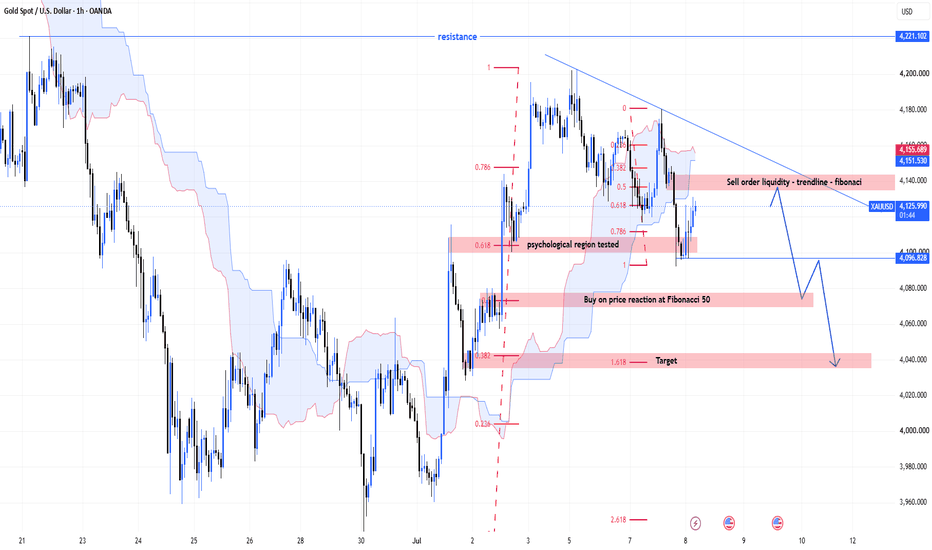
MCX Falling Wedge Recovery Setup📊 MCX: Daily Technical Snapshot – Falling Wedge Recovery Setup
📊 STWP Technical Analysis
________________________________________
MARKET STRUCTURE SNAPSHOT | NSE: MCX | DAILY
Closing Price: 2,742.00 (+98.80 | +3.74%)
Core Trend: Downtrend (Swing Structure)
Market State: Recovery Attempt Within Falling Wedge
Price Structure: Price is trading inside a Falling Wedge, a bullish reversal pattern, after forming a Bullish Engulfing near the lower boundary. Buyers have defended support, and the stock is now attempting to challenge the upper boundary of the wedge.
________________________________________
OPERATIONAL PRICE GRID & KEY REFERENCE LEVELS
Model Reference Level: 2,766.00
Hard Invalidation Level: 2,571.80
Structural Risk: 194.20 (7.02%)
Resistance Levels: R1 2,807 | R2 2,872 | R3 2,978
Support Levels: S1 2,636 | S2 2,530 | S3 2,465
Range Structure: Low 2,571.80 | High 2,978.00
Higher Timeframe Observation Zones: 2,872 | 2,978 | 3,100 | 3,180
________________________________________
MOMENTUM, PARTICIPATION & CPR DATA
Volume Profile: 4.93 Million Shares
Volume Character: Strong Relative Participation
RSI: 42.96 (Recovering Momentum Zone)
ADX: 20.18 (Trend Development Phase)
ROC: -3.14%
MACD Status: Negative Momentum Showing Signs of Stabilization
CCI: -155.33 (Recovering from Oversold Zone)
Stochastic Reading: 35.72 (Recovering from Oversold Zone)
Current Bias: WAIT FOR BREAKOUT CONFIRMATION
CPR State: Bullish Zone | CPR Moving Down (Normal)
Today's CPR: Pivot 2,651.55 | Top 2,655.75 | Base 2,647.40
Tomorrow's CPR (Projected): Pivot 2,701.00 | Top 2,721.50 | Base 2,680.50
________________________________________
📚 EDUCATIONAL OBSERVATION
MCX has shown encouraging signs of recovery after forming a Bullish Engulfing candlestick near the lower boundary of a Falling Wedge, a chart pattern commonly associated with bullish reversals following a corrective phase. The recent price action suggests that selling pressure is gradually weakening while buyers have started defending lower price levels.
The recent decline briefly pushed prices below nearby support before buyers quickly regained control, creating characteristics of a liquidity sweep (false breakdown). Such behaviour often reflects seller exhaustion, where weak hands exit the market before stronger buying interest emerges. The subsequent bullish engulfing candle reinforces this recovery attempt and highlights improving short-term sentiment.
Several technical observations are currently supporting the developing structure:
Falling Wedge Recovery Setup
Bullish Engulfing Candlestick
Liquidity Sweep / False Breakdown
Strong Bullish Recovery Candle
Bullish VWAP Position
Strong Relative Volume Participation
Buyers Regaining Short-Term Control
Momentum indicators are beginning to stabilise after the recent correction. The RSI at 42.96 remains below the stronger momentum zone but has started recovering, indicating improving buying interest. MACD continues to remain below the zero line, suggesting that the broader corrective trend is still intact, although downside momentum appears to be slowing. The CCI reading of -155.33 reflects a deeply oversold condition from which the stock has begun recovering, while the Stochastic reading of 35.72 also points towards improving momentum after emerging from oversold territory.
The projected Central Pivot Range (CPR) for the next trading session has shifted moderately higher, with the projected Pivot at 2,701.00. While this reflects improving market acceptance of higher prices, the setup continues to favour patience until a clearer directional breakout develops.
The immediate technical focus remains on the upper boundary of the Falling Wedge, which also coincides with the resistance zone between 2,807 and 2,872. A decisive close above this region, supported by stronger-than-average trading volume, would confirm the wedge breakout and significantly improve the probability of a broader bullish reversal. Upon confirmation, the higher-timeframe observation zones near 2,978, 3,100, and 3,180 may become relevant for future market structure analysis.
From a business perspective, Multi Commodity Exchange of India (MCX) is India's leading commodity derivatives exchange, facilitating trading across precious metals, base metals, energy and agricultural commodities. Continued growth in commodity market participation, increasing institutional activity and expansion of derivative products provide a constructive long-term backdrop for the company.
Support and resistance levels should be viewed as observation zones rather than predictive targets. Chart patterns, candlestick analysis, price action, volume studies, momentum indicators and CPR are educational tools that help market participants understand evolving market structure within a disciplined risk-management framework.
________________________________________
⚠️ Disclaimer
This analysis is provided strictly for educational and informational purposes.
This is not financial, investment or trading advice and should not be considered a recommendation to buy or sell any security.
Stock market investments are subject to market risks, including the possible loss of capital.
Past performance, historical observations, chart patterns and technical indicators do not guarantee future results.
Please conduct your own research and consult a SEBI-registered investment adviser before making investment decisions.
STWP assumes no responsibility or liability for any financial loss arising directly or indirectly from the use of this information.
 Long
Long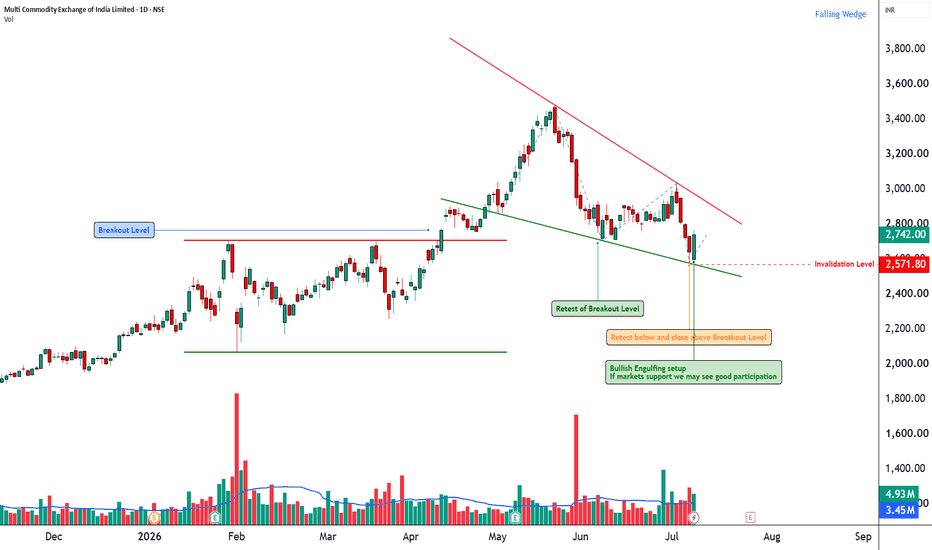
 Education

XAUUSD — Waiting Sell From EMA Value Zone
Fundamental Analysis
Gold remains sensitive to USD momentum, Treasury yields, and upcoming U.S. macro data. For now, the market is still moving with short-term bearish pressure, so any recovery should be treated as a pullback unless price can reclaim the upper resistance zone.
The better plan is to wait for price to return to a clear sell value zone instead of chasing the move after a strong drop.
Technical Analysis
On the 1H chart, XAUUSD is trading around 4,053 after reacting strongly from the 0.382 Fibonacci area near 4,041. This reaction shows that buyers are trying to defend the short-term support, but the overall structure is still not bullish yet.
Price remains inside a descending channel, and the EMA structure is still acting as dynamic resistance above the current price. The recent bounce looks more like a corrective recovery inside a bearish trend rather than a full reversal.
The main sell zone is around 4,094 - 4,101. This area aligns with the previous support turned resistance, Fibonacci reaction zone, descending trendline pressure, and EMA value area. If price recovers into this zone and rejects, sellers may continue to push gold lower.
The downside target remains around 4,003 first, followed by the psychological Fibonacci target zone near 3,990 - 3,988.
Important Key Levels
Current price area: 4,053
Fibonacci reaction support: 4,041
Main sell zone: 4,094 - 4,101
Upper resistance: 4,135
Short-term downside level: 4,003
Main Fibonacci target: 3,990 - 3,988
Invalidation area: above 4,135
Trading Scenario
Main Sell Scenario
Entry: 4,094 - 4,101
Stop Loss: 4,135
Take Profit 1: 4,041
Take Profit 2: 4,003
Take Profit 3: 3,990 - 3,988
Sell Condition
The preferred setup is to wait for gold to pull back into the 4,094 - 4,101 sell zone. This is the key value area because it combines Fibonacci structure, EMA resistance, and the descending channel reaction zone.
A sell setup becomes more valid if price forms bearish rejection from this area, such as a long upper wick, bearish engulfing candle, failed breakout, or lower high below 4,101.
If price rejects from the sell zone and breaks back below 4,041, the bearish continuation view becomes stronger. The next downside focus would be 4,003, followed by the Fibonacci psychological target around 3,990 - 3,988.
Alternative Buy Scenario
Entry: above 4,135 after breakout confirmation
Stop Loss: 4,101
Take Profit 1: 4,160
Take Profit 2: 4,180
Take Profit 3: 4,200
Buy Condition
This is not the main view. A buy setup should only be considered if gold breaks above 4,135 and holds above the descending structure with strong confirmation.
If price cannot break and hold above 4,135, the bearish setup remains the priority.
Entry Conditions
Wait for price to retest 4,094 - 4,101.
Look for bearish rejection before entering sell.
Do not sell aggressively at the low without a pullback.
A break below 4,041 confirms stronger downside pressure.
If price breaks and holds above 4,135, the sell setup is invalid.
Overall, the main view remains bearish while XAUUSD trades below the EMA resistance structure and inside the descending channel. The preferred plan is to wait for a pullback into 4,094 - 4,101, then look for sell confirmation toward 4,041, 4,003, and 3,990 - 3,988.
Do you share the same bearish view on gold, or are you waiting for a cleaner rejection from the EMA value zone first?
Short 
XAUUSD: Bearish Trendline Continues to Cap RecoveryFollowing a rebound in early July, XAUUSD is showing signs of weakness, repeatedly failing to break above the bearish trendline extending from mid-June. The $4,140–$4,150 zone remains a key resistance area where selling pressure has repeatedly halted bullish recovery attempts.
Fundamentals also favor the sellers. The US dollar remains strong as the market awaits the FOMC minutes, while elevated US bond yields diminish gold's appeal. Consequently, current rebounds appear primarily technical in nature rather than signaling the start of a new uptrend.
On the H4 chart, the price remains below the bearish trendline and the Ichimoku Cloud, indicating that the prevailing trend remains unchanged. If XAUUSD faces continued rejection around the $4,147 level, selling pressure is likely to intensify, paving the way for a decline toward the $3,959 support zone.
Entry: Sell upon signs of rejection around $4,140–$4,147.
TP: $3,959.
SL: Above $4,175. Short 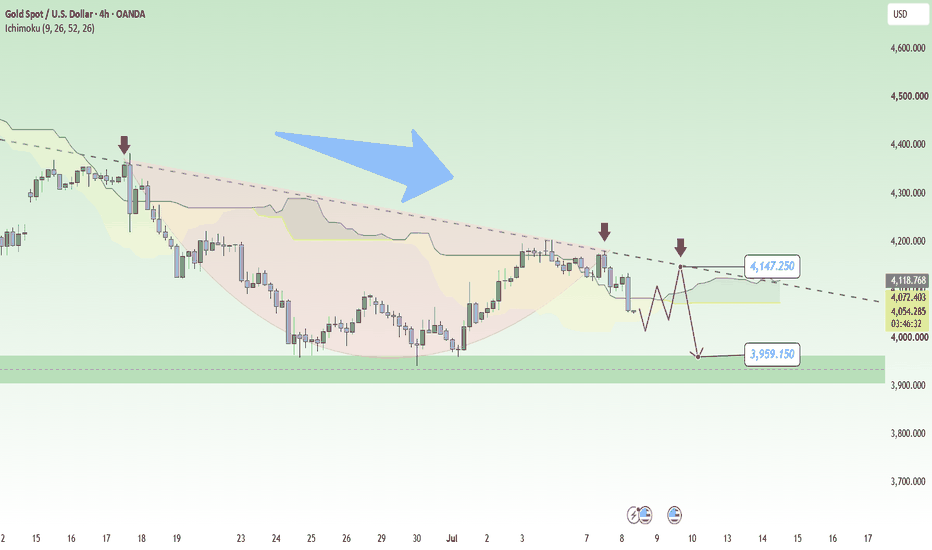
XAUUSD — FVG Fill Before Bullish Continuation
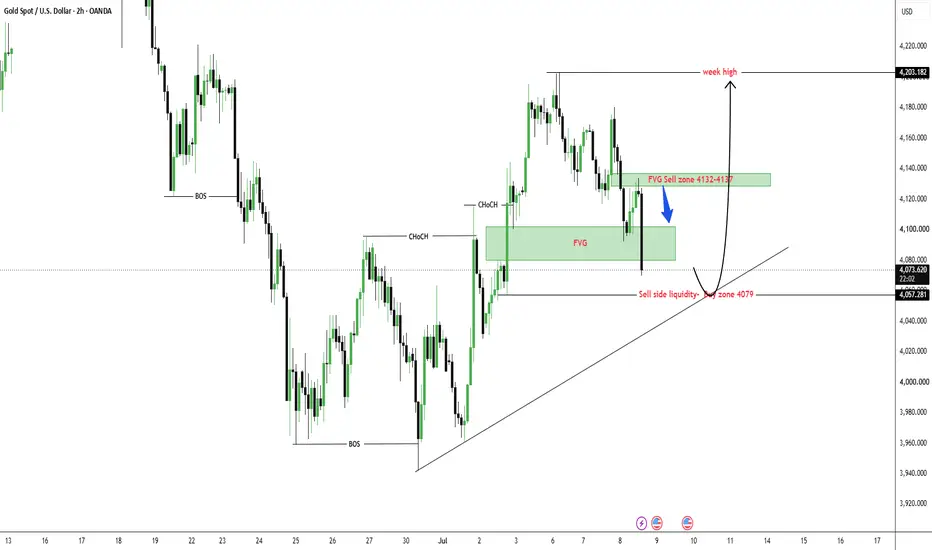
Gold is trading around $4,089 after pulling back from the short-term FVG sell zone at $4,132–$4,137. The current move is now filling the lower FVG area, which is the main liquidity zone where buyers may start defending the bullish structure again.
From an SMC perspective, the larger short-term structure has already shifted bullish after the previous CHOCH and BOS from the lower base. The current decline does not look like a full bearish reversal yet. It looks more like price is filling the imbalance and testing liquidity before attempting another move with the main recovery trend.
The key area to watch is the FVG buy zone around $4,079–$4,100. Price has already moved into this zone, so the next reaction is important. If gold holds this area and forms bullish rejection, the market may rotate higher again toward $4,132–$4,137 first, then $4,160 and the weekly high around $4,203.
Buy setup 1
Condition:
Gold holds inside the FVG buy zone around $4,079–$4,100 and forms bullish rejection with lower timeframe MSS / CHOCH.
Entry: $4,079–$4,100
SL: below $4,057
TP1: $4,132–$4,137
TP2: $4,160
TP3: $4,203
TP4: $4,220
Buy setup 2
Condition:
If gold sweeps the sell-side liquidity near $4,057 and quickly reclaims back above the FVG zone, this can create a stronger liquidity-trap buy setup.
Entry: after reclaim above $4,079–$4,100
SL: below the sweep low
TP1: $4,132–$4,137
TP2: $4,160
TP3: $4,203
Buy setup 3
Condition:
If gold reacts from the current FVG zone and breaks back above $4,137, bullish continuation remains valid after a breakout retest.
Entry: above $4,137 after breakout retest
SL: below $4,100
TP1: $4,160
TP2: $4,203
TP3: $4,220
Sell scalping setup
Condition:
Selling is not the main priority. A sell scalp is only valid if gold retests the $4,132–$4,137 FVG sell zone and shows clear bearish rejection before buyers confirm continuation.
Entry: $4,132–$4,137 after rejection
SL: above $4,160
TP1: $4,100
TP2: $4,079
TP3: $4,057
Key levels
Current price area: $4,089
Main FVG buy zone: $4,079–$4,100
Sell-side liquidity: $4,057
FVG sell zone: $4,132–$4,137
Short-term resistance: $4,160
Weekly high liquidity: $4,203
Next bullish liquidity area: $4,220
Bullish continuation confirmation: clean break above $4,137
Stronger bullish confirmation: clean break above $4,160
Bullish invalidation: clean 2H close below $4,057
My current view is that gold is filling FVG liquidity before attempting another bullish continuation. The Prime Gold plan is to avoid selling low inside the FVG area and wait for confirmation around $4,079–$4,100. If buyers defend this zone, gold can recover toward $4,132, $4,160 and potentially the weekly high around $4,203.
No confirmation, no trade.
Long 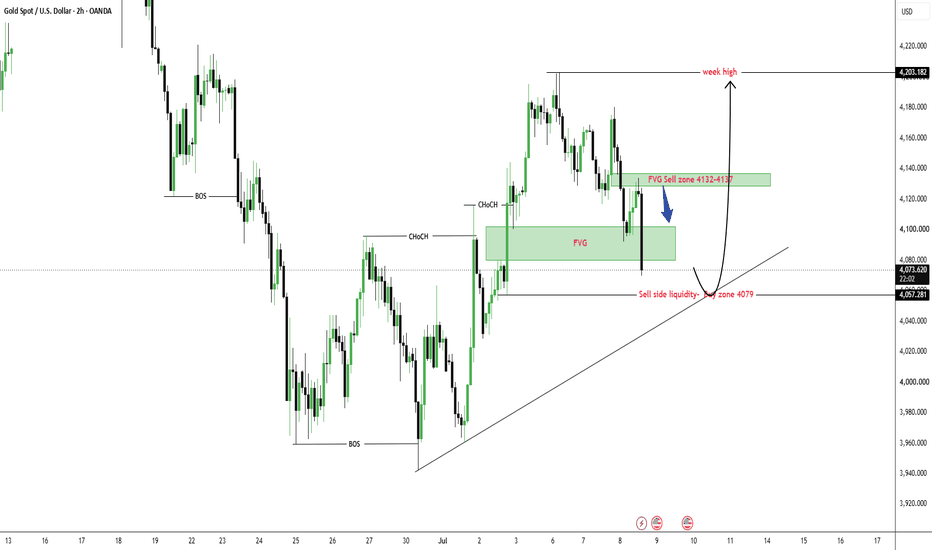
XAUUSD: Watch This Level Before You Jump In!📊 Market Context & Structure
XAUUSD is currently trading at a massive technical crossroads. After a strong expansion earlier this month, the price retraced downward but aggressively front-ran the major high-timeframe discount arrays. It found strong buying pressure right around the 4,096 level, reversing hard just above the unmitigated FVG (Fair Value Gap) and the 4-Hour POI (Point of Interest).
The fact that institutions stepped in early to buy the dip without letting price fully mitigate those lower structural targets displays strong underlying bullish intent. However, we have now arrived at the immediate decision zone.
🔍 The 1-Hour POI Battleground
Price has rallied straight into the 1-Hour POI (~Around 4,140 Zone). This is our critical pivot level for the session. Before putting on any major position size, we need to observe how the lower timeframes (LTF) react right here.
We have two distinct paths laid out on the chart:
The Bearish Rejection Path : If the 1-Hour POI (~Around 4,140 Zone) holds as solid supply, expect sellers to take control. A clear rejection here will likely result in a downward move.
The Bullish Expansion Path : If buyers display strong displacement and break cleanly above 4,140, this zone flips from supply to demand. A successful retest of this newly formed demand will clear the path for a major push upwards.
🎯 Ultimate Targets: If the bullish structure confirms, the market is highly likely to draw toward the rest-period buy-side liquidity targets marked at the xxx swing highs (4,180 and 4,200).
⚠️ Fundamental Catalyst: June FOMC Meeting Minutes Today
Do not forget the macro driver! Today at 2:00 PM ET, the Federal Reserve will release the minutes from its June policy meeting.
Why it matters: Markets came away from the June meeting viewing the Fed's stance as inherently hawkish. If the minutes heavily confirm that multiple policymakers are pushing for interest-rate hikes later this year, the U.S. Dollar will strengthen, likely triggering a sharp rejection at our 1-Hour POI.
Conversely, if the minutes show signs of internal policy disagreement or economic concerns behind closed doors, it could act as the exact fuel needed to break 4,145 and rocket toward the 4,200 liquidity pool.
🛠️ Execution Plan
Conservative Traders: Avoid entering positions directly inside the 1-Hour POI immediately before the FOMC release. Wait for the post-news volatility to clear, look for a 5m/15m Change of Character (CHoCH), and trade the clear structural breakout or rejection.
Risk Management: If you managed to catch the long move from the initial ~4,096 floor, this 1-Hour POI resistance is a prime spot to lock in partial profits and move your stop-loss to break-even ahead of the high-impact news.
What do you think? Will the FOMC minutes spark a deeper correction into the 4-Hour POI, or are we flying straight to 4,200? Drop your thoughts and setups in the comments below! 👇
Disclaimer: This is for educational purposes only and does not constitute financial advice. Bull Trap at 24500 [Analysis for 08.07.2026: Wednesday]Probable Scenario Analysis of Nifty 50 for the 08th of July, 2026. The day is Wednesday.
🟢 Bullish Scenario
There is no observable setup for bullish trades. Be bullish only if the price sustains above the level of 24500. The probable bullish targets above 24500 would be - 24550 and 24600.
🔴 Bearish Scenario
Stay bearish if the price remains below the level of 24400. The probable bearish targets below the level of 24400 would be - 24350, 24300, and 24250. The price would receive good support at 24250, as an unfilled gap at 24271 would be filled. Next, if the price breaks down below 24250, then the probable bearish targets would be - 24200 and 24150. There is another unfilled gap at 24167.
🟡 No Trading Zone (NTZ): (24500 - 24400).
⏺ Range of Consolidation (ROC): (24500 - 24300).
Here, 24400 is the median of ROC. The median works like a sentiment. The price trading above the median would offer bullish sentiment, while the price trading below the median would trigger bearish sentiment.
● Event
This week (06th to 10th July), there is one high-impact event (the U.S. FOMC minutes). The event is on Wednesday, 08th of July. Thus, today is the high-impact day. FOMC meeting is at 11:30 PM IST (night). Our markets will be closed. Also, tomorrow is the SENSEX weekly expiry.
● Intraday Bias
Establish intraday bias with respect to the opening price. If the price sustains above the opening price, then don't think of shorting. Look for bullish trades only. On the contrary, if the price sustains below the opening price, then don't think of going long. Look for bearish trades in that case.
● Disclaimer + End Note
- All the analyses would fail in the case of a major gap up, gap down, or price structure anomaly. Thus, practice PRAGMATISM in the live session.
- Trade only if there is a set-up. Remember, not trading is an extension of the trading activity.
- Mark your points. Trade your points. Price is GOD. Anything can happen in the markets. Thus, trade what you see, not what you believe.
- Always PRACTICE RISK MANAGEMENT. Always PROTECT YOUR CAPITAL. Be RESPONSIBLE.
- Be Strategic. Be Courageous. Be Patient. Be Wise.
- Every day is a new day. Thus, do not carry the baggage of past successes or failures. Leave the gardens of winning and losing. Establish yourself in equanimity. Always think from a new perspective.
- Let the joy of trading drive your effectiveness, not greed or fear. Believe in Possibilities.
Happy Trading! #NIFTY Intraday Support and Resistance Levels - 08/07/2026Nifty is expected to open with a slightly gap-down bias around the 24350–24380 zone. The index is approaching an important intraday support area near 24250, where buying interest could emerge if the level holds.
The immediate support lies at 24250–24300. If Nifty sustains above this zone and shows buying momentum, traders can consider long positions with targets of 24350, 24400, and 24450. A decisive breakout above 24500 will confirm fresh bullish strength and may extend the rally towards 24650, 24700, and 24750+.
On the downside, if Nifty faces rejection near 24400–24450, traders can consider short positions targeting 24350, 24300, and 24250. A sustained breakdown below 24200 will strengthen the bearish trend and may drag the index towards 24150, 24100, and 24050.
Overall, a slightly gap-down opening is expected. Since the index is opening close to a key support zone, traders should wait for confirmation before initiating fresh trades. Holding above 24250 favors a recovery, while a breakdown below 24200 may trigger fresh selling pressure. Follow strict stop-losses and book profits gradually at each target level. #BANKNIFTY Intraday PE & CE Levels(08/07/2026)Bank Nifty is expected to open with a slightly gap-down bias around the 58100–58150 zone. Despite the weak opening, the index is trading near an important support area, making price action around 58050 crucial for determining the intraday trend.
The immediate support lies at 58050–58100. If Bank Nifty holds this support and attracts buying interest, traders can consider CE positions with targets of 58250, 58350, and 58450+. A sustained breakout above 58550 can trigger fresh bullish momentum towards 58750, 58850, and 58950+ levels.
On the downside, if Bank Nifty fails to sustain above 58050 and faces rejection near 58400–58450, traders can consider PE positions targeting 58250, 58150, and 58050. A decisive breakdown below 57950 will strengthen the bearish bias and may extend the decline towards 57750, 57650, and 57550.
Overall, a slightly gap-down opening is expected, but the market is opening near a key demand zone. Traders should wait for confirmation around 58050 before taking fresh positions. Holding above support favors a recovery, while a breakdown below 57950 could lead to increased selling pressure. Maintain strict stop-losses and book partial profits at each target due to expected intraday volatility. Physics of Trading: Why Price Moves Like an Object in Motion?When traders open a chart, they usually focus on candles, indicators, or chart patterns. But what if there was another way to understand the market? Instead of thinking like a trader, imagine thinking like a physicist.
While financial markets do not actually follow the laws of physics, many principles from physics can help explain how price behaves. Just as objects move in response to different forces, the market also moves as buyers and sellers continually compete. Concepts such as momentum, friction, acceleration, exhaustion, and gravity can offer a completely different perspective on price action.
Momentum:
Imagine pushing a bicycle. The hardest part is getting it moving. Once it starts rolling, it becomes much easier to keep it moving. The market behaves in a similar way.
When strong buying or selling enters the market, price usually does not stop after a single candle. As more traders notice the move, they join in, creating even more buying or selling pressure. This is why strong trends often continue longer than beginners expect.
Many traders try to predict reversals too early, but momentum teaches us that a moving market often prefers to keep moving until something significant changes.
Friction:
Every moving object eventually experiences resistance. In physics, this resistance is called friction. It slows objects down and makes it harder for them to continue moving at the same speed.
The market also experiences friction. During an uptrend, some traders begin taking profits while others start selling because they believe the price has risen too much. During a downtrend, buyers begin stepping into the market.
This creates hesitation. Candles become smaller, long wicks begin to appear, and the market may start moving sideways. Friction does not always mean the trend is ending. Sometimes it simply means the market is taking a break before deciding its next move.
Acceleration:
Think about a car leaving a traffic signal. It starts slowly, but as the driver presses the accelerator, the speed increases quickly.
Price behaves the same way. Sometimes the market moves quietly for hours, and then suddenly everything changes. A major news event, a breakout above resistance, or heavy institutional buying can cause price to move much faster than before.
Large candles begin to appear, volatility increases, and the trend becomes much stronger. This is acceleration. It is often the point where traders realize that the market is no longer drifting but is moving with real strength.
Exhaustion:
No object can keep gaining speed forever. Eventually, it begins to lose energy.
The same thing happens in trading. Every trend reaches a stage where buyers or sellers start running out of strength. Price still moves in the same direction, but each move becomes smaller. Candles lose their size, momentum fades, and new highs or lows become harder to achieve.
This stage is called exhaustion. It does not always mean a reversal is about to happen, but it often tells us that the trend is becoming weaker. Experienced traders pay close attention to these signs because they know that every strong move eventually slows down.
Gravity:
Throw a ball into the air, and it will eventually come back down. Gravity always pulls it back.
The market has a similar tendency. After a very strong rally, many traders begin taking profits. New buyers hesitate because the price already looks expensive. The same thing happens after a sharp decline, where sellers begin closing their positions and buyers start seeing value.
As a result, price often pulls back before continuing its journey. This does not happen because of real gravity, but because markets naturally seek balance after moving too far in one direction.
My Thoughts:
Every candle on a chart is the result of forces acting between buyers and sellers. Momentum pushes price forward. Friction slows it down. Acceleration creates explosive moves. Exhaustion shows that the trend is losing energy. Gravity reminds us that no market can move in one direction forever.
The next time you open a chart, try looking beyond the candles. Instead of asking whether the market will go up or down, ask yourself what forces are acting on price. Sometimes, changing the way you see the market can be more valuable than learning another trading strategy.
@BrightRally_Research on @TradingView Education 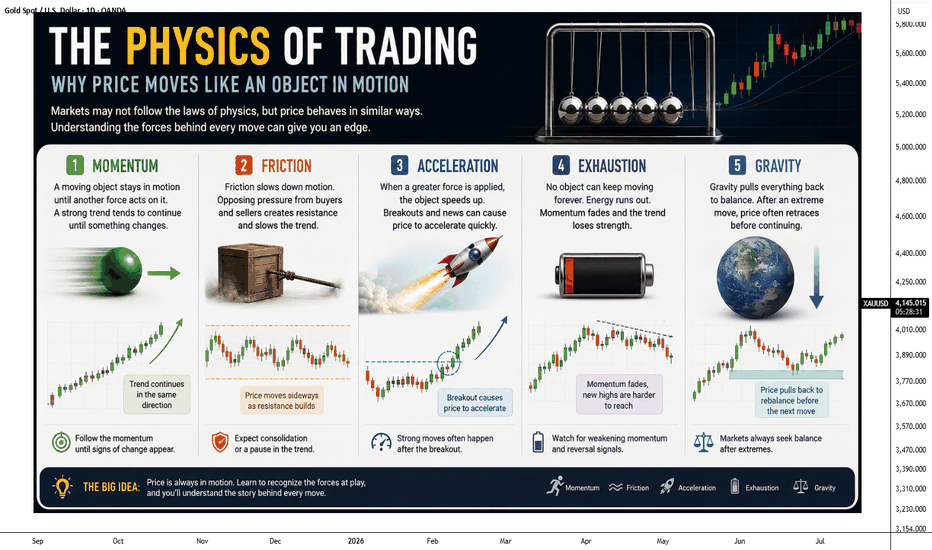
XAUUSD — Bullish Structure Holding, Buy Setup Still Priority
Gold is trading around $4,128 after forming a short-term correction from the upper reaction zone. The main structure remains bullish because price is still holding above the rising trendline and the recent market structure continues to show multiple CHOCH and BOS signals to the upside.
From an SMC perspective, gold has already shifted from the previous bearish leg into a recovery structure. The current movement looks more like accumulation and correction rather than a confirmed bearish reversal. Price is now moving inside a smaller descending correction, and this accumulation phase may continue until the US session before the next stronger move appears.
The main zone to watch is the $4,100–$4,110 buy zone test liquidity. This area is important because it sits below the current price, aligns with the correction structure, and may act as the final liquidity test before buyers attempt to push gold higher again. As long as price holds above this zone, the bullish recovery structure remains valid.
Buy setup 1
Condition:
Gold pulls back into the $4,100–$4,110 buy zone test liquidity and forms bullish rejection with lower timeframe MSS / CHOCH.
Entry: $4,100–$4,110
SL: below $4,080
TP1: $4,150
TP2: $4,175–$4,190
TP3: $4,220
TP4: $4,280
Buy setup 2
Condition:
If gold breaks above the short-term descending correction line and retests it as support, bullish continuation remains valid without waiting for a deeper pullback.
Entry: above $4,150 after breakout retest
SL: below $4,120
TP1: $4,175–$4,190
TP2: $4,220
TP3: $4,280
Sell scalping setup
Condition:
Selling is not the main priority. A sell scalp is only valid if gold reaches the $4,175–$4,190 OB sell scalping zone and shows clear bearish rejection.
Entry: $4,175–$4,190 after rejection
SL: above $4,210
TP1: $4,150
TP2: $4,128
TP3: $4,100–$4,110
Key levels
Current price area: $4,128
Main buy zone test liquidity: $4,100–$4,110
Short-term FVG reaction zone: $4,150–$4,160
OB sell scalping zone: $4,175–$4,190
Buy-side liquidity: $4,220
Main bullish target: $4,280
Bullish continuation confirmation: clean break above $4,150
Stronger bullish confirmation: clean break above $4,190
Bullish invalidation: clean 2H close below $4,080
My current view is that gold remains in a bullish structure, but the market may continue to accumulate before the US session. The Prime Gold plan is to avoid chasing price in the middle range and wait for either a pullback into $4,100–$4,110 or a clean breakout above the correction line before looking for buy confirmation. As long as the buy zone holds, the priority remains buying toward $4,175, $4,220 and potentially $4,280.
No confirmation, no trade.
Long 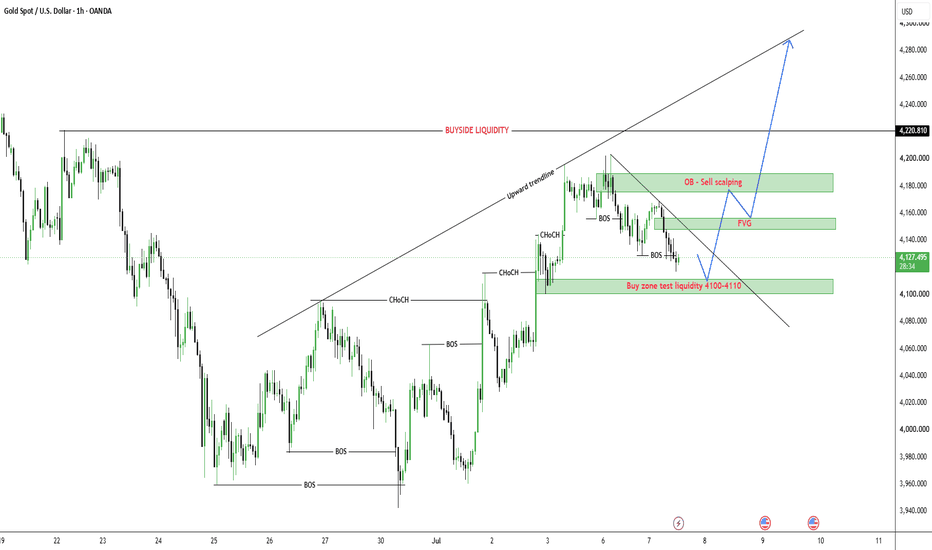
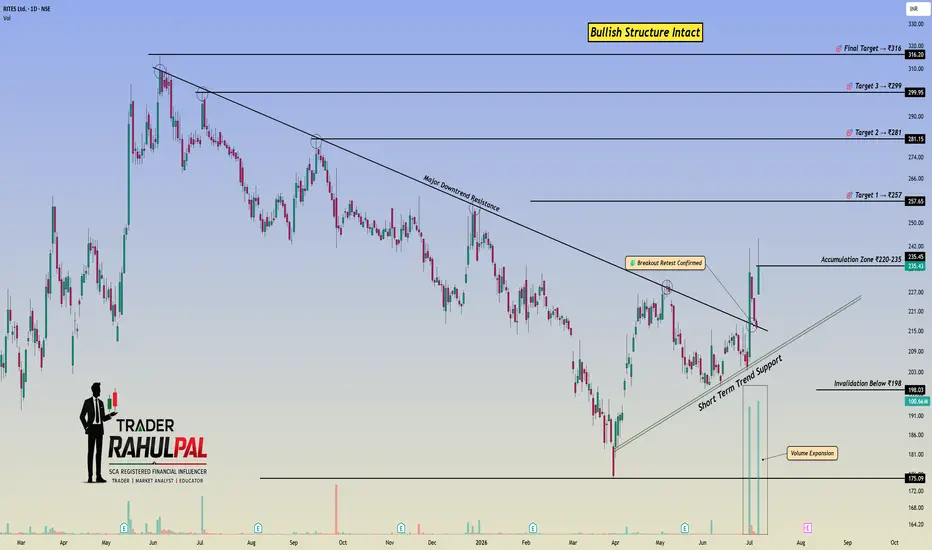
RITES Is Back In Action! Bullish Structure Looks Strong here!Hello Traders! 👋
Today I'm sharing my view on RITES Ltd, one of India's leading transport infrastructure and engineering consultancy companies. The company plays an important role in railway projects, metro systems, highways, ports, and other infrastructure developments, making it an interesting stock from both a business and technical perspective.
After staying under a major downtrend for several months, the chart is finally showing something different. Currently stock has broken above its long term resistance trendline, successfully retested the breakout area, and buyers stepped in with strong volume. This combination usually gets my attention because it shows that market participants are becoming more confident.
What I like the most is that this isn't just a one day breakout. Price respected the breakout zone instead of falling back below it, which makes the overall structure look much healthier.
If the momentum continues and buyers remain active, the stock could gradually move towards the next resistance zones. At the same time, risk management is equally important because every breakout needs confirmation before turning into a sustained trend. For all important support, entry, stop-loss, and target levels, please refer to the chart above.
I'm not saying the stock will move in a straight line from here, but it's definitely a setup that deserves attention over the coming sessions.
What do you think about RITES? Are you bullish on India's railway sector? Let me know your view in the comments.
If you found this analysis useful, don't forget to Boost and Follow for more educational market analysis.
Disclaimer
This analysis is for educational purposes only and reflects my personal market view. Please do your own research and manage your risk before making any investment or trading decisions.
— @TraderRahulPal
SCA Registered Financial Influencer (Dubai, UAE)
XAUUSD — Pullback to Fibonacci Before Bullish Recovery
Fundamental Analysis
Gold remains sensitive to USD momentum, Treasury yields, and upcoming U.S. macro data. For now, the market is still moving inside a technical recovery phase, but traders should avoid chasing price near the middle of the range.
The better plan is to wait for price to return to a clear value zone before looking for continuation.
Technical Analysis
On the 2H chart, XAUUSD is trading around 4,129 after losing short-term momentum near the current EMA area. Price is still holding above the lower recovery structure, but the market may need one more pullback before buyers step in again.
The key area to watch is the Fibonacci and liquidity buy zone around 4,056 - 4,073. This zone aligns with the previous reaction area, Fibonacci support, and short-term liquidity.
If gold drops into this zone and forms bullish rejection, the recovery scenario may continue toward the resistance and Fibonacci zone around 4,212 - 4,231.
However, if price fails to hold the buy zone, the downside may extend toward 4,001.
Important Key Levels
Current price area: 4,129
Short-term EMA reaction area: 4,110 - 4,135
Main buy zone: 4,056 - 4,073
Deeper downside liquidity: 4,001
Near resistance: 4,151 - 4,160
Main upside target: 4,212 - 4,231
Invalidation area: below 4,001
Trading Scenario
Main Buy Scenario
Entry: 4,056 - 4,073
Stop Loss: 4,001
Take Profit 1: 4,110
Take Profit 2: 4,151
Take Profit 3: 4,212 - 4,231
Buy Condition
The preferred setup is to wait for gold to pull back into the 4,056 - 4,073 Fibonacci and liquidity buy zone. This area is important because it gives a cleaner value entry instead of buying in the middle of the current range.
A buy setup becomes more valid if price forms bullish rejection from this zone, such as a long lower wick, bullish engulfing candle, higher low formation, or a clean reclaim above 4,073.
If gold reacts from the buy zone and breaks back above 4,151, the bullish recovery view becomes stronger. The next upside focus would be 4,212 - 4,231.
Alternative Sell Scenario
Entry: below 4,001 after breakdown confirmation
Stop Loss: 4,056
Take Profit 1: 3,960
Take Profit 2: 3,930
Take Profit 3: 3,900
Sell Condition
This is not the main view. A sell setup should only be considered if gold breaks below 4,001 and fails to recover the Fibonacci buy zone.
If price loses 4,001 with strong bearish momentum, the recovery structure becomes weaker and gold may continue toward lower liquidity areas.
Entry Conditions
Wait for price to test 4,056 - 4,073.
Look for bullish rejection before entering buy.
Do not chase price while it is still between support and resistance.
A break above 4,151 confirms stronger recovery momentum.
If price breaks and holds below 4,001, the buy setup is invalid.
Overall, the main view is that gold may drop first into the Fibonacci and liquidity zone before creating a stronger bullish recovery. The preferred plan is to wait for confirmation around 4,056 - 4,073, then look for continuation toward 4,151 and 4,212 - 4,231.
Do you share the same view that gold needs one more pullback before the next bullish recovery?
Short 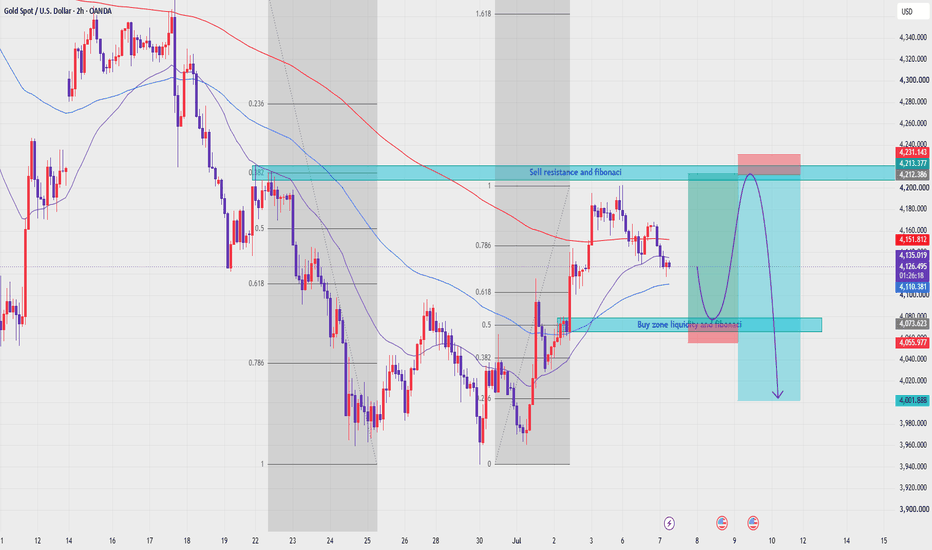
XAUUSD – Gold Corrects Into Fibonacci And Ichimoku Support
XAUUSD is trading around 4,129 after pulling back from the recent high area near 4,190–4,200. The short-term bullish structure is still valid, but price is now correcting into an important Fibonacci and Ichimoku support area.
The priority view remains buy on pullback, as long as gold holds above the key Fibonacci zones and does not break below the rising structure.
Technical View
Gold has created a strong recovery from the previous strong support zone around 3,960. The market moved higher and formed a clear bullish leg, showing that buyers were in control during the recent move.
However, price is now correcting after reaching the upper resistance and descending trendline area near 4,190–4,200. This pullback is normal after a strong bullish move, but the key question is whether buyers can defend the Fibonacci support zones.
The current area around 4,128–4,136 is acting as a short-term reaction zone. Price is testing this area after the pullback, but a clean bullish continuation still needs stronger confirmation.
The first important buy zone is 4,102–4,106. This zone aligns with the Fibonacci 0.618 area and also sits close to the Ichimoku support structure. If gold pulls back here and forms bullish rejection, it may confirm a higher low before the next upside move.
The deeper buy zone is 4,071–4,075, near the Fibonacci 0.5 area. If the first buy zone fails, this lower zone becomes the next area to watch for a stronger reaction.
Ichimoku still supports the recovery structure as long as price holds above the main cloud support and does not close deeply below the lower support zone. A clean break below 4,071 would weaken the bullish view and may open a deeper correction.
The upside target remains around 4,190–4,200, where the descending trendline and recent resistance are located. If gold breaks above this zone, the bullish structure may extend further.
Key Zones
Current price: 4,129
Short-term reaction zone: 4,128–4,136
Buy order zone 1: 4,102–4,106
Buy order zone 2: 4,071–4,075
Ichimoku support area: 4,115–4,166
Upper resistance: 4,190–4,200
Major trendline resistance: around 4,200
Invalidation: below 4,071
Trading Plan
Buy Priority: 4,102–4,106
Condition: wait for bullish rejection, higher low formation, or price holding above the Fibonacci 0.618 zone and Ichimoku support.
SL: below 4,071
TP1: 4,136
TP2: 4,166
TP3: 4,190–4,200
Alternative Scenario
If gold breaks below 4,102–4,106, wait for the deeper buy zone at 4,071–4,075. A bullish reaction from this area may still support continuation, but confirmation must be clearer.
Sell View
Sell is not the priority while price remains above the Fibonacci support zones and the rising structure. A sell setup only becomes safer if gold breaks below 4,071 and fails to recover back above the Ichimoku support area.
Final View
Overall, gold is correcting after a strong bullish move, but the main structure is not broken yet. The cleaner plan is to wait for price to test the Fibonacci and Ichimoku support zones around 4,102–4,106 or 4,071–4,075. If buyers defend these areas, gold may continue toward 4,166 and 4,190–4,200.
Will gold hold the Fibonacci support zone and continue higher, or break lower into a deeper correction first?
Short 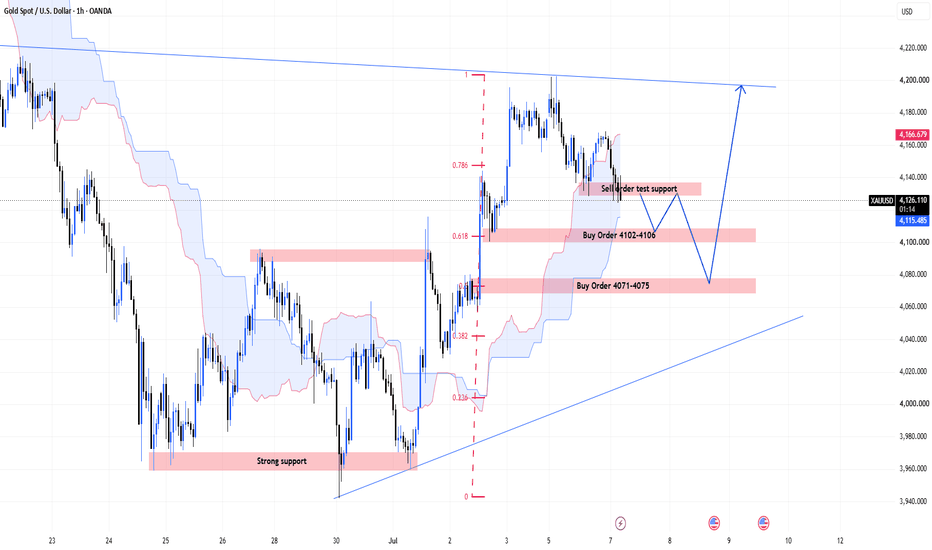
#NIFTY Intraday Support and Resistance Levels - 07/07/2026Nifty is expected to open with a gap-up bias around the 24420–24440 zone, reflecting positive momentum at the start of the session. The index is trading just below a crucial resistance level, and traders should wait for a confirmed breakout before chasing fresh long positions.
The immediate resistance lies at 24450–24500. A sustained move above this zone can trigger fresh buying momentum towards 24650, 24700, and 24750+ levels. As long as Nifty holds above the immediate support, the bullish structure remains intact, with buyers likely to remain active on intraday dips.
On the downside, 24450–24400 acts as an important reversal zone. If Nifty fails to sustain above this resistance and witnesses rejection, short positions can be considered for targets of 24350, 24300, and 24250 levels. Traders should avoid aggressive buying if the index shows weakness near the resistance zone.
Overall, a gap-up opening is expected with a positive bias, but the market is opening near a critical resistance level. Traders should wait for a confirmed breakout above 24500 for fresh long positions, while rejection from 24450–24500 may provide short-selling opportunities. Maintain strict stop-losses and book partial profits at each target due to expected intraday volatility. #BANKNIFTY Intraday PE & CE Levels(07/07/2026)Bank Nifty is expected to open with a gap-up bias around the 58250–58280 zone, indicating a positive start to the session. The index is trading above immediate support but is approaching a crucial resistance zone, where traders should wait for confirmation before initiating aggressive long positions.
The immediate resistance lies at 58450–58550. A sustained breakout above this zone can trigger fresh buying momentum towards 58750, 58850, and 58950+ levels. If Bank Nifty holds above 58050–58100, the bullish trend is likely to remain intact, with buyers expected to dominate on intraday dips.
On the downside, 58450–58400 acts as an important reversal zone. Rejection from this resistance may trigger profit booking, with downside targets of 58250, 58150, and 58050. A further breakdown below 57950 would strengthen the bearish outlook and may extend the decline towards 57750, 57650, and 57550 levels.
Overall, a gap-up opening is expected with a positive bias, but Bank Nifty is trading close to a key resistance zone. Traders should prefer buying on dips near 58050–58100 or wait for a confirmed breakout above 58550 for fresh long positions. Rejection near 58450–58550 or a breakdown below 57950 may offer short-selling opportunities. Maintain strict stop-losses and book partial profits at each target due to expected intraday volatility. Early Signs of Bullish ExhaustionProbable Price Structure Analysis of KOSPI TVC:KOSPI
🟢 Bullish Scenario
There is no setup for a confident bullish move. It seems like a bullish exhaustion phase in the index. For a bullish scenario, the price needs to give a proper breakout above the strong resistance zone (SRZ): (8500 - 8250). If the price sustains above SRZ, then weak bullish moves can be expected till the levels - 8750 and 9000.
🔴 Bearish Scenario
Presently, the price is in an indecision zone. There is a strong support zone (SSZ): (7750 - 7500). If the price decisively breaks down below the SSZ, then the index would enter a proper bearish zone. In that case, bullish sentiment would be totally exhausted. The level of 7500 is the neckline of the probable head-and-shoulder (H&S) pattern. The probable bearish targets below the level of 7500 would be - 7250 and 7000.
⏺ Range of Consolidation (ROC): (8500 - 7500)
Here, the level of 8000 is the median of the ROC. The median works like a sentiment. The price trading above the median would offer bullish sentiment, while the price trading below the median would trigger bearish sentiment.
● Disclaimer + End Note
➤ All the analyses would fail in the case of a major gap up, gap down, or price structure anomaly. Thus, practice PRAGMATISM in the live session.
➤ Trade only if there is a set-up. Remember, not trading is an extension of the trading activity.
➤ Mark your points. Trade your points. Price is GOD. Anything can happen in the markets. Thus, trade what you see, not what you believe.
➤ Always PRACTICE RISK MANAGEMENT. Always PROTECT YOUR CAPITAL. Be RESPONSIBLE.
➤ Be Strategic. Be Courageous. Be Patient. Be Wise.
➤ Every day is a new day. Thus, do not carry the baggage of past successes or failures. Leave the gardens of winning and losing. Establish yourself in equanimity. Always think from a new perspective.
➤ Let the joy of trading drive your effectiveness, not greed or fear. Believe in Possibilities.
Happy Trading!  Short
Short