 Long
Long
XAUUSD Analysis: Bears Still Control Below This Key Trendline
Hello everyone, Gold continues to respect a well defined major descending resistance trendline, and the latest rejection once again highlights the importance of this technical level.
Every recent rally into this resistance has attracted selling pressure, creating a sequence of lower highs that keeps the broader short term structure bearish.
As long as price remains below this trendline, sellers continue to hold the technical advantage. A confirmed breakout would change the outlook, but until then, resistance deserves respect.
One area that stands out on the chart is the key liquidity pool below current price. Markets often revisit these zones before making their next meaningful move, making this an important level to monitor rather than predict.
If selling pressure continues, price could gradually rotate lower and test this liquidity area. However, if buyers manage to reclaim the descending resistance with strong confirmation, the bearish structure would begin to weaken.
Instead of chasing every move, I prefer waiting for price to react around high-probability technical zones where risk-to-reward is more favorable.
My focus remains simple:
Respect the trend.
Follow market structure.
Let price confirm the next move.
No predictions, just reacting to what the market is showing.
What do you think?
Will Gold sweep the liquidity below first, or break above the descending resistance before making its next major move? Share your view in the comments. 👇
Disclaimer
This analysis is shared for educational and informational purposes only and should not be considered financial or investment advice. Always conduct your own research and use proper risk management before making any trading decisions.
—@TraderRahulPal
SCA Registered Financial Influencer (Dubai, UAE)
 Short
Short
Ethereum $10K Or $1K? This Zone Will Decide Everything.Ethereum $10K Or $1K? This Zone Will Decide Everything.
My technical outlook on CRYPTOCAP:ETH :
Ethereum is likely to extend its recovery toward the $2,160–$2,400 region. This is a major HTF Bearish Order Block + Fair Value Gap (FVG), making it the most important resistance zone on the chart.
Bullish scenario:
A confirmed HTF close above $2,400 would invalidate the current bearish structure and shift the HTF trend bullish, opening the door toward $7K–$10K.
Bearish scenario:
If ETH gets rejected from the $2,150–$2,400 zone, the probability of revisiting the $1,500–$1,000 range increases significantly. That would be a high-conviction long-term accumulation opportunity.
This is the decision zone. Don't predict the outcome, wait for confirmation and react accordingly. Always DYOR.  Long
Long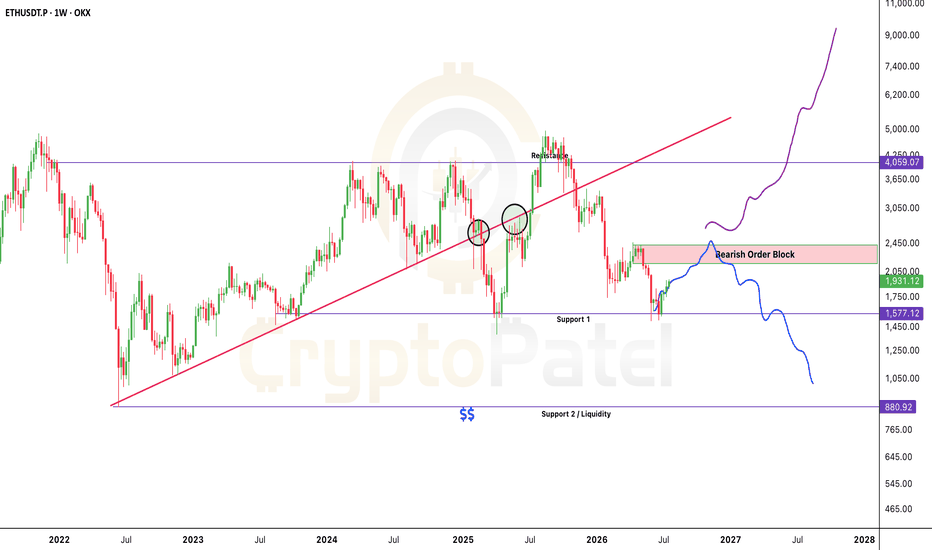
 Long
Long
Long 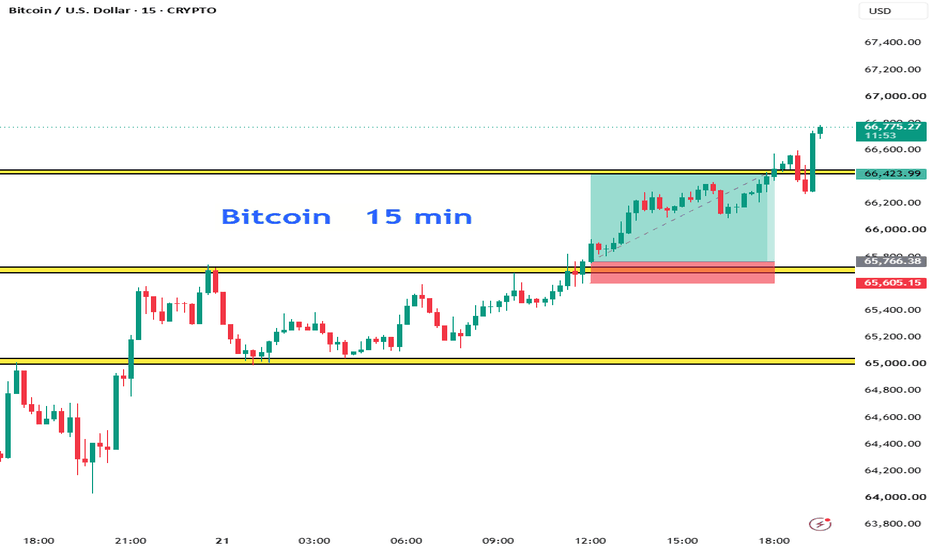
NIFTY DAILY / Short Range Level Analysis for 22nd Jul 2026🔕 SGMN SplD BULLISH Above => 24257.
🔕 SGMN SplD Bearish BELOW => 24122.
Mentioned analysis based on 2 consecutive candle close in 15 min Time Frame.
━━━━━🟥🟧🟨🟩🟦🟪⬛━━━━━
💥Level Interpretation / description:
✍🏻L#1: If the candle crossed & stays above the “Buy Gen”, it is treated / considered as Bullish bias. Cfm=> Confirmation.
L#2: Possibility / Probability of REVERSAL near 🔕RL/TF1 & 🔔RL/TF2
L#3: If the candle stays above “Sell Gen” but below “Buy Gen”, it is treated / considered as Sidewise. Aggressive Traders can take Long position near “Sell Gen” either retesting or crossed from Below & vice-versa i.e. can take Short position near “Buy Gen” either retesting or crossed downward from Above.
L#4: If the candle crossed & stays below the “Sell Gen”, it is treated / considered a Bearish bias.
L#5: Possibility / Probability of REVERSAL near 🔕RL/TF1 & 🔔RL/TF2
HZB (Buy side) & HZS (Sell side) => Hurdle Zone,
✍🏻 *** Specialty of “HZB#1, HZB#2 HZS#1 & HZS#2” is Sidewise (behaviour in Nature)
Rest Plotted and Mentioned on Chart
Color code Used:
Green, BLUE =. Positive bias.
Safron, RED =. Negative bias.
RED in Between Green means Trend Finder / Momentum Change
/ CYCLE Change and Vice Versa.
Notice One thing: HOW LEVELS are Working.
Use any Momentum Indicator / Oscillator or as you "USED to" to Take entry.
━━━━━🟥🟧🟨🟩🟦🟪⬛━━━━━
⚠️ DISCLAIMER:
The information, views, and ideas shared here are purely for educational and informational purposes only. They are not intended as investment advice or a recommendation to buy, sell, or hold any financial instruments. I am not a SEBI-registered financial adviser.
Trading and investing in the stock market involves risk, and you should do your own research and analysis. You are solely responsible for any decisions made based on this research.
"🔔As HARD EARNED MONEY IS YOUR's, So DECISION SHOULD HAVE TO BE YOUR's".
━━━━━🟥🟧🟨🟩🟦🟪⬛━━━━━
❇️ Follow notification about periodical View
💥 Do Comment for Stock WEEKLY Level Analysis.🚀
📊 Do you agree with this view?
✈️ HIT THE PLANE ICON if this technical observation resonates with you. It will Motivate me.
━━━━━🟥🟧🟨🟩🟦🟪⬛━━━━━
💡 If You LOOKING any CHART & want for Level and ANALYZE?
Share your desired stock names in the comments below! I will try to analyze the chart Levels, patterns and share my technical view (so far my Knowledge).
If Viewers think It can identify meaningful setups. Looking forward to hearing from all of you — let's keep this discussion going and help each other make better trading decisions.
___________🔕^^^⚫⚪^🙏🏼🙏🏼🙏🏼^⚪⚫^^^🔔___________ Daily Market Analysis: Nifty 50 Technical Outlook TodayExplore today's Nifty 50 daily market analysis with technical insights, key support and resistance levels, trend outlook, and educational market commentary.
Daily Market Analysis: Nifty 50 Technical Outlook, Key Levels & Market Trend
Welcome to today's Daily Market Analysis, where we examine the current technical structure of the Nifty 50 index using price action, trend analysis, support and resistance levels, and market momentum.
This analysis is intended for educational and informational purposes only. Financial markets are dynamic, and traders should always perform their own research and manage risk before making investment decisions.
Market Overview
The Indian equity market continues to trade within an important technical range as buyers and sellers remain active around key price levels. Recent sessions have shown balanced participation, indicating that market participants are waiting for confirmation before initiating aggressive positions.
Although the broader trend remains constructive, resistance zones continue to limit upside momentum. A decisive breakout or breakdown may determine the market's next directional move.
Current Market Trend
Overall Trend: Neutral to Mildly Bullish
Current price action suggests that Nifty is maintaining its higher-low structure on the daily timeframe while consolidating on lower timeframes. This type of consolidation often precedes a directional move; however, confirmation is essential before drawing conclusions.
Technical Analysis
From a technical perspective, the market continues to respect established support and resistance zones.
Several observations include:
Price is trading above important medium-term support.
Resistance remains active near recent swing highs.
Momentum indicators remain balanced without signaling extreme conditions.
Market participation suggests consolidation rather than trend reversal.
The current structure favors patience until price confirms the next breakout or breakdown.
Key Support Levels
The following support levels may attract buying interest if tested:
Immediate Support
Intraday Support
Short-Term Support
Major Swing Support
A sustained move below major support could indicate increasing selling pressure.
Key Resistance Levels
The following resistance zones remain important for traders to monitor:
Immediate Resistance
Near-Term Resistance
Swing Resistance
Major Resistance Zone
A convincing breakout above resistance may indicate strengthening bullish momentum.
Possible Market Scenarios
Bullish Scenario
If the index sustains above the immediate resistance zone with healthy participation, the market may attempt to extend its upward movement toward higher resistance levels.
Confirmation through price action and volume is generally considered more reliable than anticipating a breakout.
Range-Bound Scenario
Markets often spend time consolidating before making significant directional moves.
If the index continues trading between support and resistance, traders may experience:
Lower volatility
Stock-specific movement
Short-term trading opportunities
Frequent reversals near range boundaries
Bearish Scenario
If selling pressure increases and price closes below important support levels, market sentiment could weaken.
A confirmed breakdown may lead to additional downside movement toward the next technical support area.
Risk Management
Regardless of market direction, disciplined risk management remains one of the most important aspects of trading.
Consider following these general principles:
Trade only after confirmation.
Define your risk before entering a position.
Avoid emotional decision-making.
Maintain appropriate position sizing.
Review multiple timeframes before making trading decisions.
What Traders Should Watch
During the next trading session, market participants may monitor:
Opening price relative to previous close
Strength near support and resistance
Volume participation
Price action during the first trading hour
Global market sentiment
Sector performance
Institutional activity
These factors can provide additional context for understanding short-term market behavior.
Conclusion
Today's Daily Market Analysis suggests that Nifty remains in a consolidation phase within a broader constructive trend. The market is approaching important technical zones that may influence its next directional move.
Rather than predicting future prices with certainty, traders should focus on observing price action, respecting technical levels, and managing risk appropriately.
Consistent analysis, patience, and disciplined execution remain essential components of long-term trading success. Long 
 Long
Long
 Education
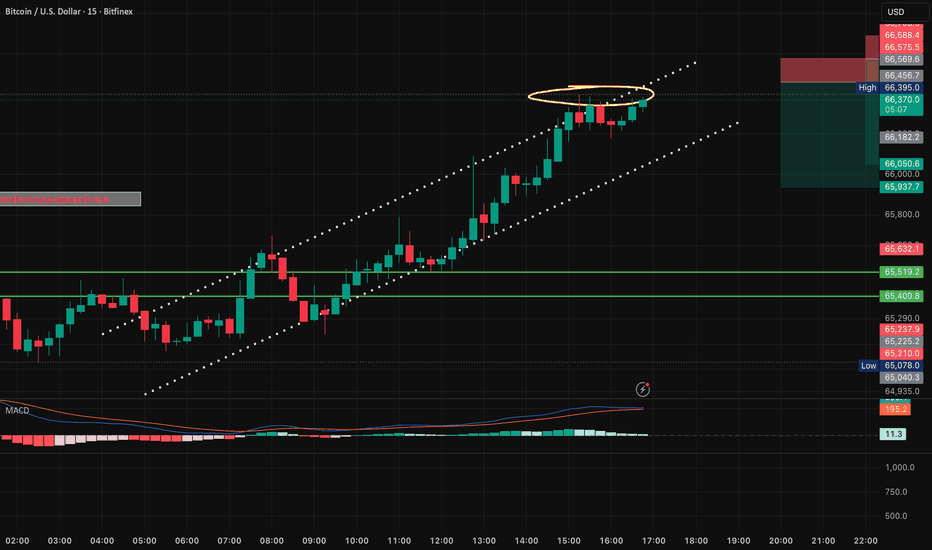
BTCUSDT Bullish Breakout ContinuesBTCUSDT has confirmed a strong Break of Structure (BOS) by pushing above the previous swing high, signaling continued bullish momentum. Price remains above the Ichimoku Cloud, keeping the overall market structure positive.
After the breakout, a short-term pullback into the 64,720–64,340 Fibonacci retracement zone is possible. This area aligns with the Ichimoku Cloud and could act as a strong demand zone for buyers. Holding this support would increase the probability of another bullish leg toward 66,800 and potentially 67,500.
A breakdown below 64,340 would weaken the bullish outlook and expose price to a deeper retracement toward 63,050. Until then, the trend remains in favor of buyers, with pullbacks likely offering continuation opportunities. XAUUSD Eyes 4,094 Resistance After Bullish BreakoutGold (XAU/USD) on the 2H timeframe has confirmed a bullish Change of Character (CHoCH) followed by strong impulsive buying, signaling that buyers have regained short-term control. Price has broken above the recent consolidation and is now trading inside a key supply/resistance zone between 4,070–4,090.
The immediate resistance is the R1 Pivot at 4,094, which aligns with the highlighted supply area. A clean breakout and sustained close above this level could trigger the next bullish expansion toward 4,120 and potentially higher.
However, if sellers defend the resistance zone, a healthy pullback toward the 50% Fibonacci retracement (4,042) and the 61.8% Fibonacci level (4,032) is likely. This area also coincides with previous resistance that may now act as support, making it an attractive buy-on-dip zone.
As long as price remains above the 4,000 support, the overall short-term market structure remains bullish. A successful retest of the Fibonacci support could provide the momentum needed for another leg higher toward 4,094 and 4,120.
Key Levels:
Resistance: 4,094 → 4,120
Support: 4,042 → 4,032
Invalidation: Below 4,000
Bias: Bullish 📈 – Prefer buying on pullbacks while price holds above key Fibonacci support.  Long
Long
XAUUSD Rising Wedge Signals Bearish BreakdownGold (XAU/USD) is trading inside a rising wedge while respecting a higher-timeframe descending trendline, keeping the broader bias bearish. Price is struggling below the 0.618 Fibonacci level (4,068.82) after reclaiming the 0.5 Fibonacci level (4,053.07), showing that buyers are losing momentum.
The recent Change of Character (CHoCH) marked a shift in market structure, but the recovery lacks strong bullish follow-through. As long as price remains below the descending trendline, sellers retain control.
A confirmed break below 4,053 would invalidate the short-term bullish structure and likely trigger a move toward the first demand zone around 3,960–3,975. If bearish momentum accelerates, the next downside target is the major demand zone at 3,925–3,940.
On the bullish side, buyers must break and close above both the descending trendline and 4,068–4,070 to regain momentum. Until then, rallies into resistance may continue to attract sellers.
Key Levels
Resistance: 4,068 → 4,100 → 4,130
Support: 4,053 → 3,975 → 3,935
Bias: Bearish below 4,068, targeting 3,975 and 3,935. Short