Vishnu- Strong Uptrend Continuation with Key Resistance AheadVishnu Chemicals Limited is exhibiting a robust long-term bullish structure on the 4-hour timeframe.
Key Observations:
A significant uptrend is visible with multiple impulsive moves supported by rising volume during advances.
The price is currently trading near the ₹640–643 zone, approaching a critical horizontal resistance at ₹659.25.
Recent price action shows healthy consolidation with reduced selling pressure, indicating potential for continuation.
Technical Levels:
Immediate Resistance: ₹659.25
Major Support: ₹643.00
Stronger Support Zone: ₹600 – ₹620 (previous swing highs)
Outlook:
Bullish bias remains intact as long as price holds above ₹643. A decisive breakout above ₹659.25 with strong volume could open the path toward ₹680–700 in the medium term.
Conversely, a sustained break below ₹643 may lead to a deeper correction toward the ₹600 region.
Timeframe: 4H (NSE)
Current Price: ₹640.10 (+0.84%)
This setup offers a favorable risk-reward for swing traders monitoring the resistance breakout.
Disclaimer: This analysis is for educational and informational purposes only. I am not a SEBI registered investment advisor. Please conduct your own research and consult a qualified financial advisor before making any investment decisions
Trend Analysis
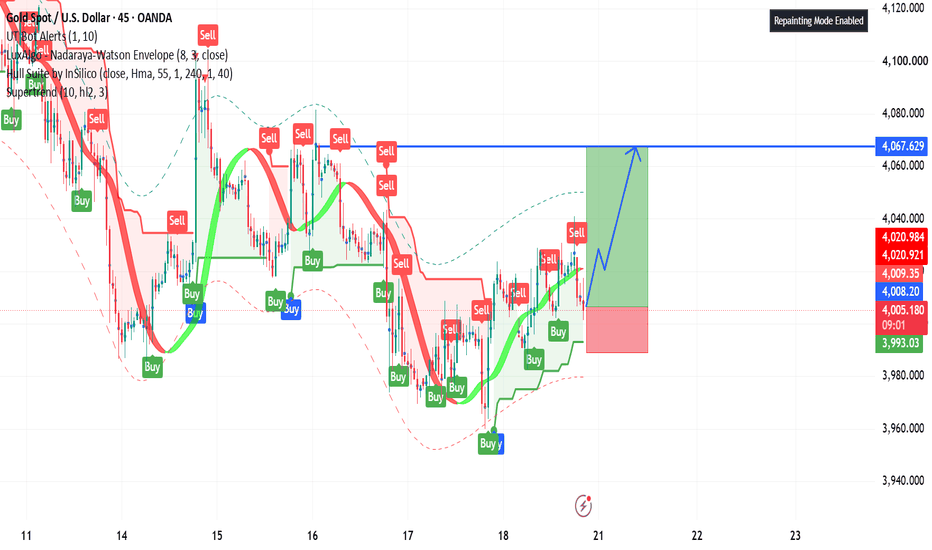
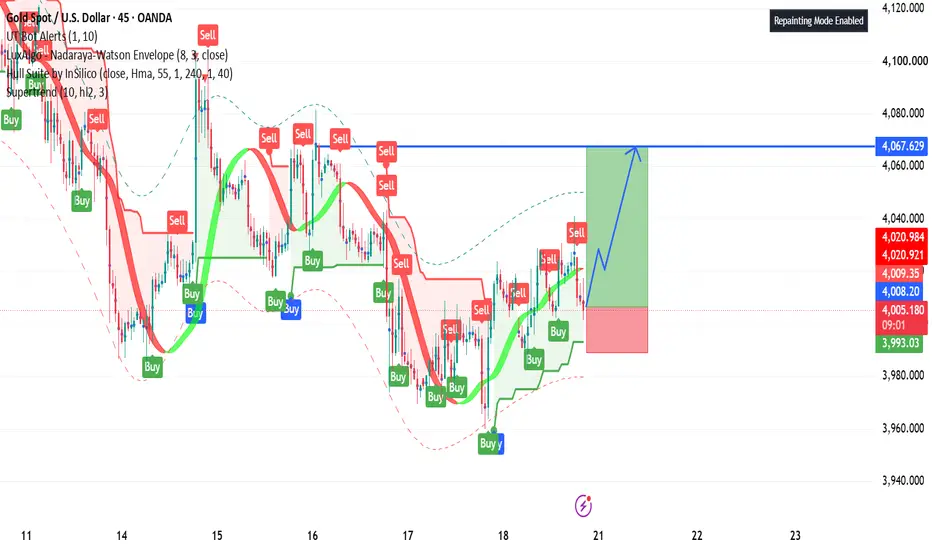
Technical Analysis – Bullish Recovery Eyes Major ResistanMinute Technical Analysis – Bullish Recovery Eyes Major Resistance
The 45-minute XAU/USD chart shows that buyers are attempting to regain control after a sharp corrective decline. Price has established a sequence of higher lows from the recent swing bottom, indicating improving short-term market structure. However, the market is still approaching a significant resistance zone where sellers previously entered aggressively.
Market Structure
The recent recovery has formed a short-term bullish trend with higher lows and higher highs.
Price remains above the dynamic support area (around 3,993–4,000), suggesting buyers are defending pullbacks.
The projected move indicates a continuation toward the overhead resistance near 4,067.60, provided current support remains intact.
Key Technical Levels
Immediate Support: 3,993 – 4,000
Current Price: ~4,004
Major Resistance: 4,067 – 4,070
Bullish Target: 4,067.60
Momentum Analysis
Momentum has shifted in favor of the bulls after the recent rebound. The buy signals and rising trend support indicate improving strength, although intermittent sell signals suggest resistance has not been completely cleared. As long as price continues printing higher lows, bullish momentum remains valid.
Bullish Scenario
A sustained hold above the 4,000 support zone could encourage buyers to push toward 4,067. A decisive breakout above this resistance would confirm renewed bullish momentum and may open the door for a continuation toward higher price levels.
Bearish Scenario
Failure to maintain support around 3,993–4,000 would weaken the current bullish structure. A breakdown below this region could trigger profit-taking and expose price to a deeper retracement toward previous demand zones.
Trading Outlook
The overall short-term bias is moderately bullish while price remains above the recent support base. Rather than chasing price higher, traders may prefer waiting for either:
a confirmed breakout above 4,067, or
a bullish pullback into support with strong confirmation.
Bias Summary
Short-Term Bias: Bullish
Confirmation: Higher lows continue to form and price holds above 4,000.
Invalidation: A 45-minute close below 3,993 would weaken the bullish outlook.
Primary Target: 4,067.60
Conclusion: The chart suggests that XAU/USD is attempting to build bullish momentum after its recent recovery. While the path of least resistance currently favors the upside, the 4,067 resistance zone remains the key hurdle. A successful breakout would strengthen the bullish case, whereas rejection from that level could lead to another corrective pullback before the next directional move.
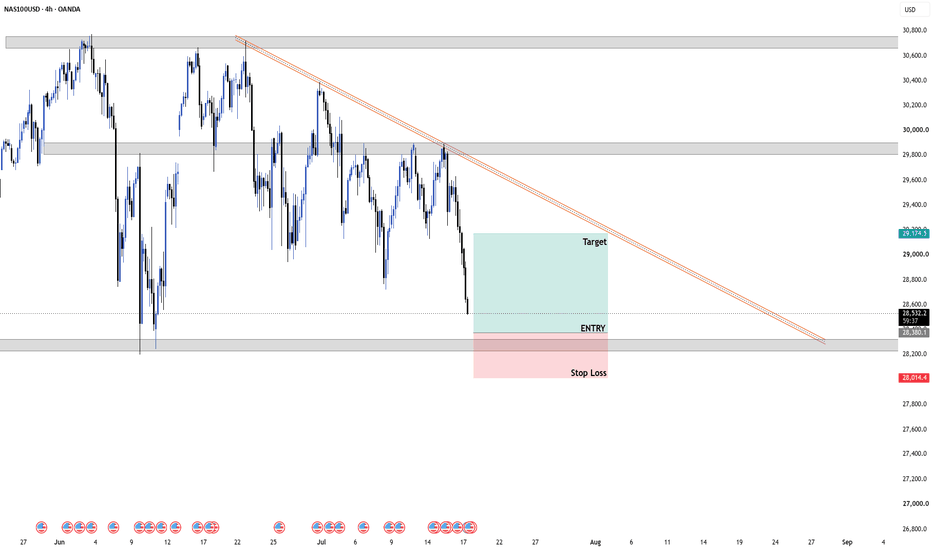
NAS100 | 4H Analysis | Buy SetupPrice has reached a strong higher-timeframe demand zone around 28,250–28,350, where buyers have reacted previously.
Market Structure
The overall trend remains bearish, with price respecting a well-defined descending trendline.
Recent selling pressure has pushed price back into a key support area.
This creates an interesting risk-to-reward opportunity, but confirmation is still required.
Bullish Scenario
A bullish reversal from the current demand zone could trigger:
Initial target: 29,150–29,250
Extended target: 29,800 resistance, where the descending trendline and horizontal resistance converge.
Bearish Scenario
If sellers manage to close decisively below the demand zone, the bullish thesis becomes invalid, and further downside is likely.
Trade Idea
Entry: Near current demand after bullish confirmation (strong rejection or bullish engulfing candle)
Stop Loss: Below the demand zone
Target 1: 29,150
Target 2: 29,800
This setup offers an attractive risk-to-reward ratio while respecting the prevailing market structure.
Key Levels
🟢 Demand: 28,250–28,350
🔴 Resistance: 29,800
📉 Dynamic Resistance: Descending trendline
Disclaimer: This is an educational market analysis, not financial advice. Always wait for confirmation before entering a trade.
NIFTY WEEKLYY Exp / Short Range Level Analysis for 21st Jul 2026🔕 SGMN SplD BULLISH Above => 24309.
🔕 SGMN SplD Bearish BELOW => 24173.
Mentioned analysis based on 2 consecutive candle close in 15 min Time Frame.
━━━━━🟥🟧🟨🟩🟦🟪⬛━━━━━
💥Level Interpretation / description:
✍🏻L#1: If the candle crossed & stays above the “Buy Gen”, it is treated / considered as Bullish bias. Cfm=> Confirmation.
L#2: Possibility / Probability of REVERSAL near 🔕RL/TF1 & 🔔RL/TF2
L#3: If the candle stays above “Sell Gen” but below “Buy Gen”, it is treated / considered as Sidewise. Aggressive Traders can take Long position near “Sell Gen” either retesting or crossed from Below & vice-versa i.e. can take Short position near “Buy Gen” either retesting or crossed downward from Above.
L#4: If the candle crossed & stays below the “Sell Gen”, it is treated / considered a Bearish bias.
L#5: Possibility / Probability of REVERSAL near 🔕RL/TF1 & 🔔RL/TF2
HZB (Buy side) & HZS (Sell side) => Hurdle Zone,
✍🏻 *** Specialty of “HZB#1, HZB#2 HZS#1 & HZS#2” is Sidewise (behaviour in Nature)
Rest Plotted and Mentioned on Chart
Color code Used:
Green, BLUE =. Positive bias.
Safron, RED =. Negative bias.
RED in Between Green means Trend Finder / Momentum Change
/ CYCLE Change and Vice Versa.
Notice One thing: HOW LEVELS are Working.
Use any Momentum Indicator / Oscillator or as you "USED to" to Take entry.
━━━━━🟥🟧🟨🟩🟦🟪⬛━━━━━
⚠️ DISCLAIMER:
The information, views, and ideas shared here are purely for educational and informational purposes only. They are not intended as investment advice or a recommendation to buy, sell, or hold any financial instruments. I am not a SEBI-registered financial adviser.
Trading and investing in the stock market involves risk, and you should do your own research and analysis. You are solely responsible for any decisions made based on this research.
"🔔As HARD EARNED MONEY IS YOUR's, So DECISION SHOULD HAVE TO BE YOUR's".
━━━━━🟥🟧🟨🟩🟦🟪⬛━━━━━
❇️ Follow notification about periodical View
💥 Do Comment for Stock WEEKLY Level Analysis.🚀
📊 Do you agree with this view?
✈️ HIT THE PLANE ICON if this technical observation resonates with you. It will Motivate me.
━━━━━🟥🟧🟨🟩🟦🟪⬛━━━━━
💡 If You LOOKING any CHART & want for Level and ANALYZE?
Share your desired stock names in the comments below! I will try to analyze the chart Levels, patterns and share my technical view (so far my Knowledge).
If Viewers think It can identify meaningful setups. Looking forward to hearing from all of you — let's keep this discussion going and help each other make better trading decisions.
___________🔕^^^⚫⚪^🙏🏼🙏🏼🙏🏼^⚪⚫^^^🔔___________
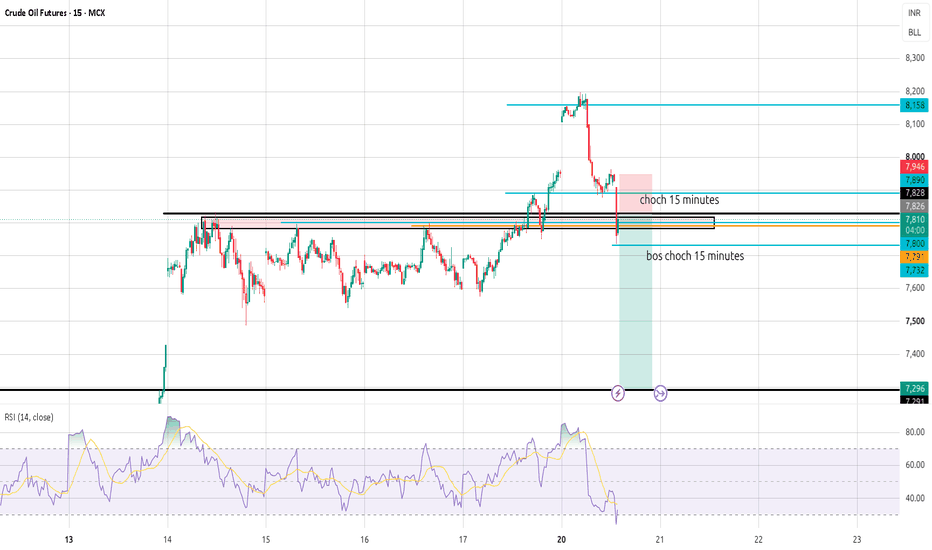
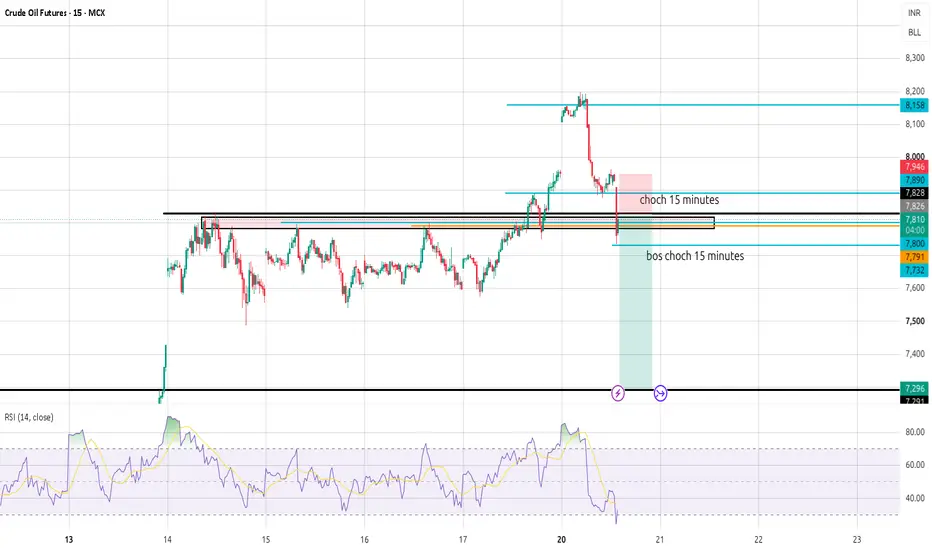
crude looking for a down ward movementCrude on 15 minutes took liquidity sweep and than reached to bos/choch
so now it look like some news like peace negotiation to restart might come, as last time when it starts to move up it looked like that fresh hostilities could increase and it did
as of now below 7720 would be good to short but risky players can sell in range 7810 7850 with sl at 7950 or try 7800 put
target would be 1 hourch choch/bos which is at 7264 so take ur decision accordingly.
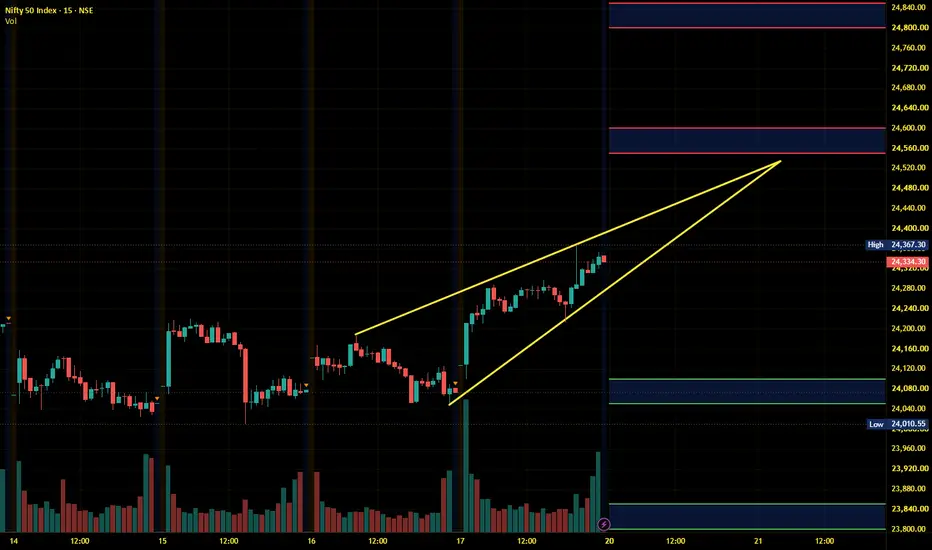
Nifty Intraday Analysis for 20th July 2026NSE:NIFTY
Volatility is expected in the index due to mixed results from banking sector stocks as well as RIL.
The upward movement may lead to 24550 – 24600 resistance range and if the index crosses and sustains above this level then may reach near 24800 – 24850 range.
On the contrary, The downward moment may drag the Index to 24100 – 24050 support range in downward momentum and if this support is broken then index may tank near 23850 – 23800 range.
Banknifty Intraday Analysis for 20th July 2026NSE:BANKNIFTY
Volatility is expected in the index due to mixed results from banking sector stocks.
The upward moment may lead the Index to 59200 – 59300 resistance range in upward momentum and if the index crosses and sustains above this level then may reach near 60000 – 60100 range.
On the contrary, The downward moment may drag the Index to 57800 – 57700 support range in downward momentum and if this support is broken then the index may tank near the 57100 – 57000 range.
Finnifty Intraday Analysis for 20th July 2026NSE:CNXFINANCE
Volatility is expected in the index due to mixed results from banking sector stocks.
The upward movement may lead the Index to 27150 - 27200 resistance range and if the index crosses and sustains above this level then may reach near 27450 - 27500 range.
On the contrary, The downward moment may drag the to 26650 – 26600 support range and if this support too is broken then index may tank near 26350 – 26300 range.
The 30-Second RuleImagine you've found what looks like the perfect setup. The trend is clear, the candles look strong, and your finger is already hovering over the buy or sell button.
Now pause.
Not for five minutes. Not for an hour.
Just **30 seconds**.
Those 30 seconds won't change the market, but they might completely change your decision. In trading, the biggest mistakes are often made in moments of urgency. A short pause creates space between emotion and execution, giving logic one final chance to speak.
1. Stop Reacting, Start Deciding
The market moves fast, but your decisions don't have to. Many losing trades begin with an emotional reaction rather than a planned decision.
A brief pause helps you shift from "I need to enter now" to "Does this trade actually deserve my capital?"
2. Ask One Simple Question
During those 30 seconds, ask yourself: "Would I still take this trade if there were no fear of missing out?"
Your first answer is often emotional. The honest answer usually arrives a few seconds later.
3. Check the Trade, Not the Excitement
Strong candles and sudden momentum can create excitement, but excitement isn't confirmation.
Use those few seconds to review your setup instead of your emotions. Is your reason for entering based on your strategy, or on the speed of the market?
4. Respect Your Risk Before Your Reward
Before thinking about how much you could make, think about what you're willing to lose.
Confirm your stop-loss, position size, and risk-to-reward ratio. If any of them feel uncertain, that's already valuable information.
5. Silence Outside Opinions
Right before entering a trade, don't look for one more tweet, one more indicator, or one more person's opinion.
Your trading plan should make the decision—not the internet.
6. Accept That Missing a Trade Is Okay
Sometimes those 30 seconds will cause you to miss a move. That's perfectly fine.
Missing one opportunity is far less damaging than entering a trade you never truly believed in.
7. Build a Habit, Not a Rule
The goal isn't to literally count to thirty before every trade. The goal is to create a consistent pause between seeing a setup and risking your money.
That small habit can become one of the simplest ways to reduce impulsive decisions.
Conclusion:
Successful trading isn't always about finding better setups. Sometimes it's about creating better habits before acting on them.
The market will still be there after 30 seconds. The real question is whether your decision will be better because you waited.
Remember: A rushed trade can cost you money. A thoughtful pause costs you nothing.
Midnifty Intraday Analysis for 20th July 2026NSE:NIFTY_MID_SELECT
Index is near resistance and if the index sustain above 14750 then -
The upward movement may lead the Index near 14875 – 14900 resistance range and if the index crosses and sustains above this level then may reach 15050 – 15075 range.
On the contrary, The downward moment may drag the index to 14575 – 14550 support range and if this support is broken then index may tank near 14400 – 14375 range.
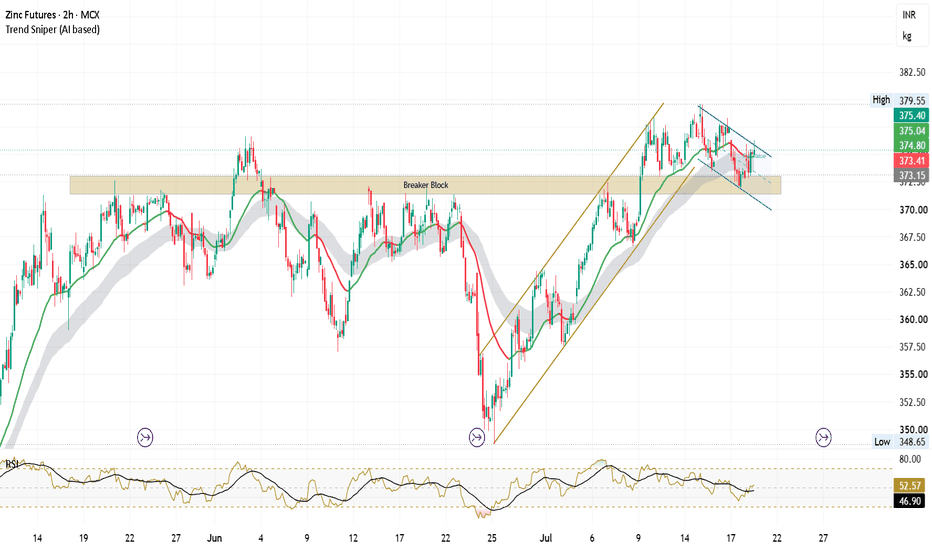
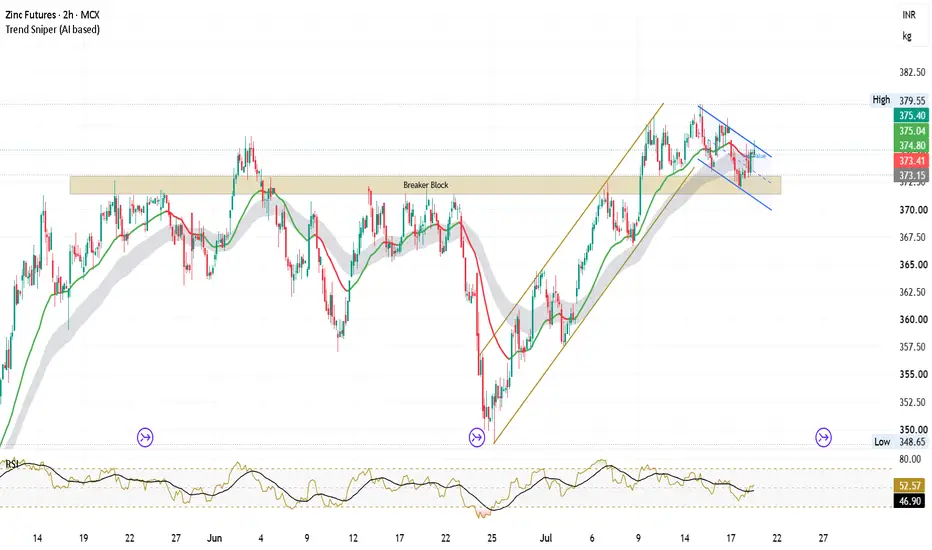
ZINC: Pullback to Breaker Block-Watching for Trend ContinuationMCX:ZINC1!
Zinc Futures are retesting a previously respected breaker block, which aligns with an important support zone after a strong impulsive rally.
The current decline appears corrective , forming a short-term falling channel while the broader market structure remains constructive. A sustained hold above the marked demand area, followed by a breakout from the channel, could indicate renewed bullish momentum.
For now, the reaction around this support zone remains the key area to watch.
Key Levels to Watch
Immediate Support : Breaker Block / Demand Zone around ₹372–373
Major Support : Previous swing low near ₹368–370
Immediate Resistance : Falling channel resistance
Major Resistance : Recent swing high around ₹379–380
Educational Note
This setup highlights how breaker blocks, trend structure, and corrective channels can work together to identify high-probability areas where demand may re-enter the market. Waiting for confirmation before acting is generally more prudent than predicting the next move.
Disclaimer: Shared for educational purposes only. This is not financial advice. Always wait for confirmation and manage risk appropriately.
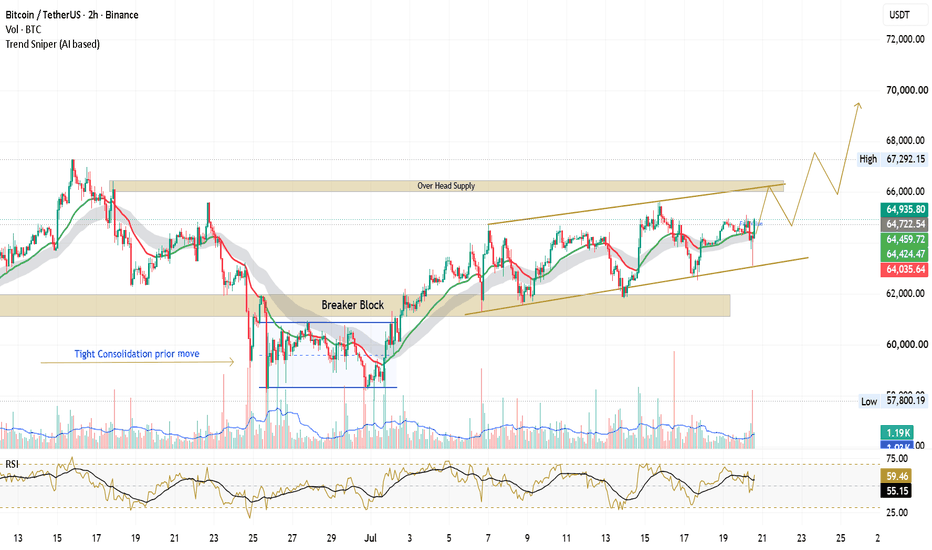
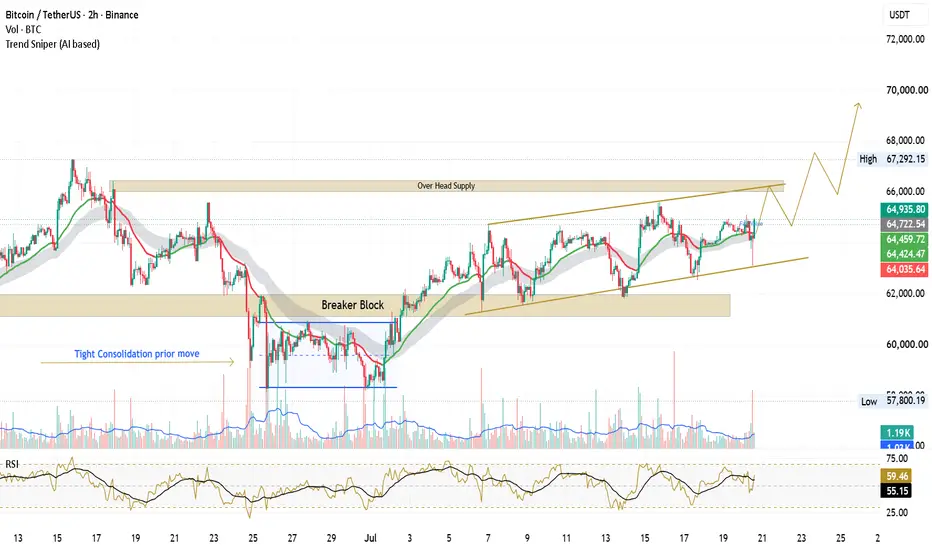
BTCUSDT: Ascending Structure Meets Major Supply Zone – Breakout BINANCE:BTCUSDT
BTCUSDT is approaching a significant overhead supply zone after maintaining a series of higher lows within an ascending structure on the 2H timeframe.
A previous breaker block has successfully acted as support, reinforcing the current bullish market structure. The recent consolidation near resistance suggests buyers are absorbing supply, but confirmation is still required before assuming a sustained breakout.
Key observations:
* Price continues to respect the ascending trendline.
* Breaker block has provided a strong reaction, indicating demand at lower levels.
* Tight consolidation before the impulsive move highlights an important accumulation area.
* Immediate focus remains on the marked overhead supply zone.
Possible scenarios:
* A convincing breakout and acceptance above the supply zone could lead to continuation toward higher price levels.
* Failure to sustain above resistance may result in another pullback toward the ascending trendline or the breaker block for a retest.
As always, confirmation through price action and volume is more important than anticipating the next move.
Disclaimer: This analysis is shared solely for educational and informational purposes. It reflects personal observations of market structure and price action and should not be considered financial or investment advice. Always conduct your own research and manage risk appropriately before making trading decisions.
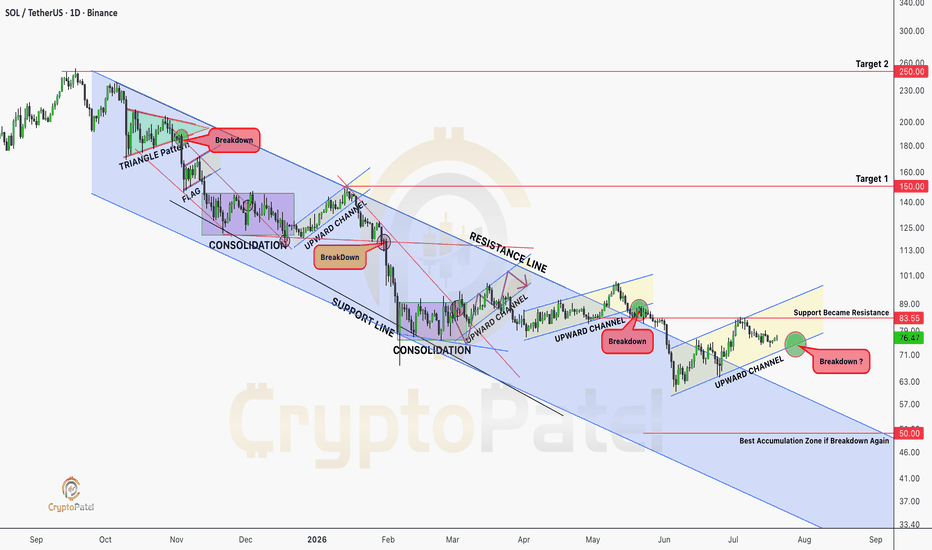
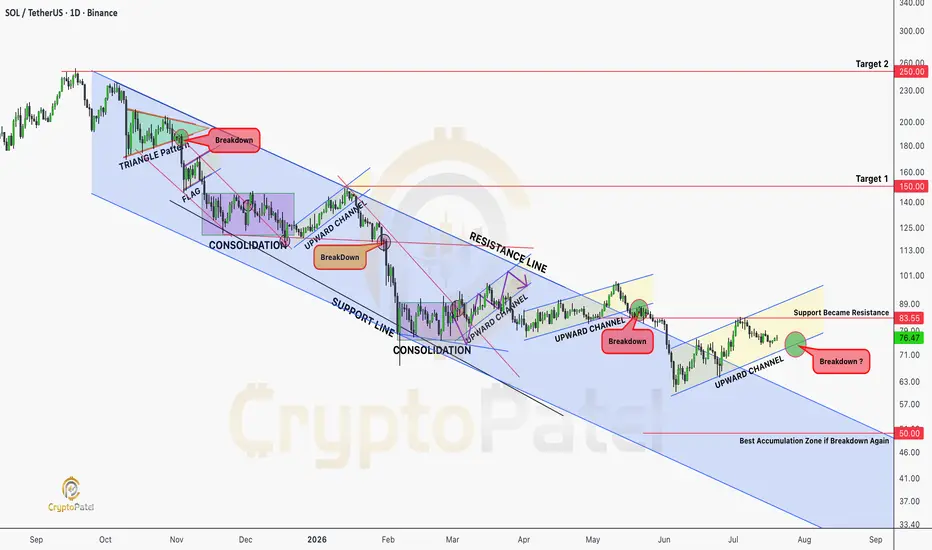
Will Solana Potential $1000 in Next Altseason?CRYPTOCAP:SOL Is Sitting At A Critical HTF Decision Point.
Lose This Rising Channel And A Move Toward The $70–$50 Accumulation Zone Becomes Increasingly Likely. Bulls Must Defend.
Long Term, I'm Highly Confident CRYPTOCAP:SOL Can Reach $500, Then $1,000. That's Why $70–$50 Looks Like A High-Conviction Accumulation Zone For Patient Investors. 🚀
NFa & Always DYOR
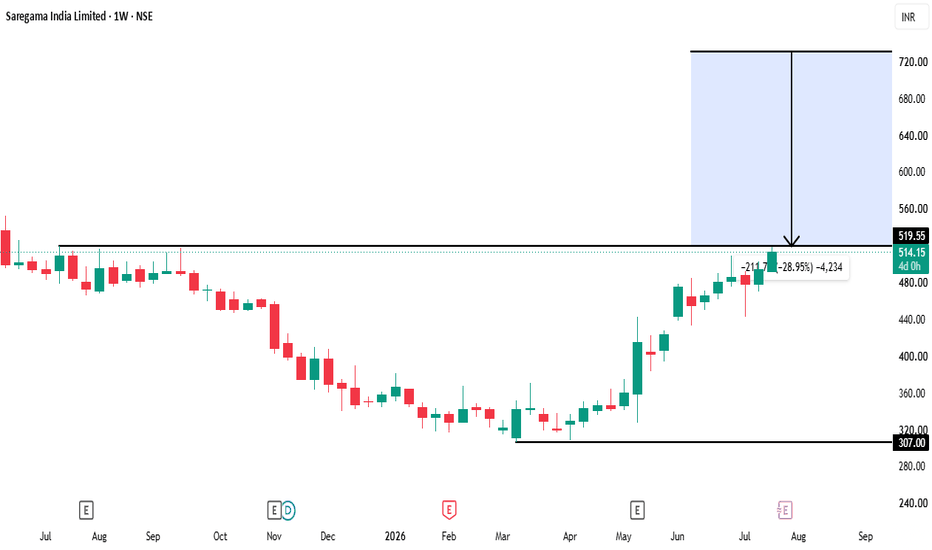
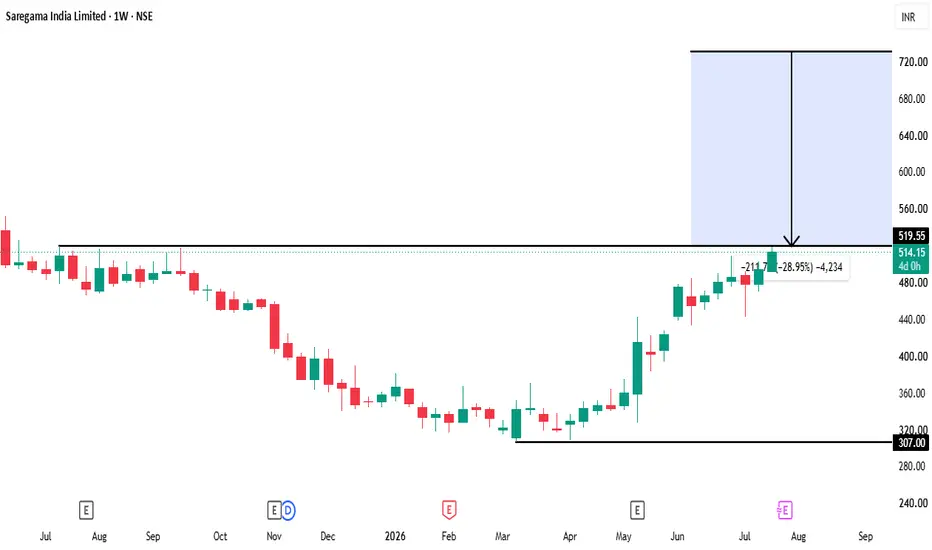
SAREGAMA SAREGAMA | Weekly Breakout Setup
After a prolonged consolidation, Saregama has broken above an important resistance zone and is showing improving momentum on the weekly timeframe.
Key observations:
Strong structural breakout
Higher highs and higher lows
Trend continuation setup
Potential upside toward ₹720 if the breakout sustains
This analysis is based purely on price structure and technical analysis, not financial advice.
💬 Share your view in the comments.
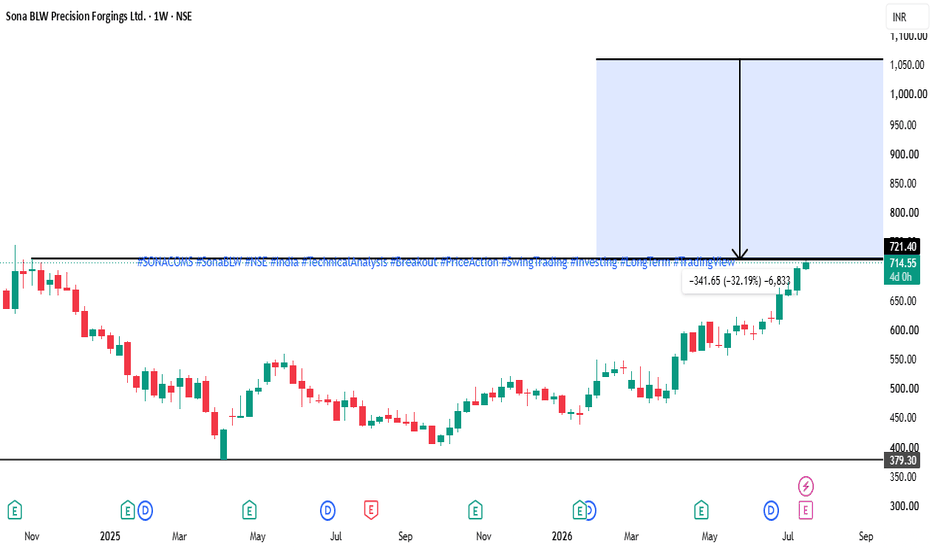
Sona BLW Precision ForgingsSona BLW Precision Forgings | Weekly Breakout Setup Near Multi-Month Resistance
Sona BLW Precision Forgings (SONACOMS) is approaching a key resistance zone near ₹721, following a strong reversal from its long-term base. The overall structure remains bullish, with buyers consistently defending higher levels.
Technical Observations
Strong recovery from the ₹379 support zone.
Clear higher highs and higher lows on the weekly timeframe.
Price is approaching a significant resistance level.
Momentum continues to improve with sustained buying interest.
A confirmed breakout above ₹721 could trigger the next phase of the long-term uptrend.
Key Levels
Current Price: ₹714.55
Breakout Level: ₹721
Immediate Support: ₹680–690
Major Support: ₹379
Long-Term Target Zone: ₹1,050+
Trading Plan
✔ Watch for a strong weekly close above ₹721.
✔ A successful retest of the breakout zone may offer a favorable risk-reward opportunity.
✔ Failure to sustain above ₹721 could lead to short-term consolidation before the next directional move.
Disclaimer: This analysis is shared for educational purposes only and should not be considered investment advice. Always conduct your own research and use proper risk management.
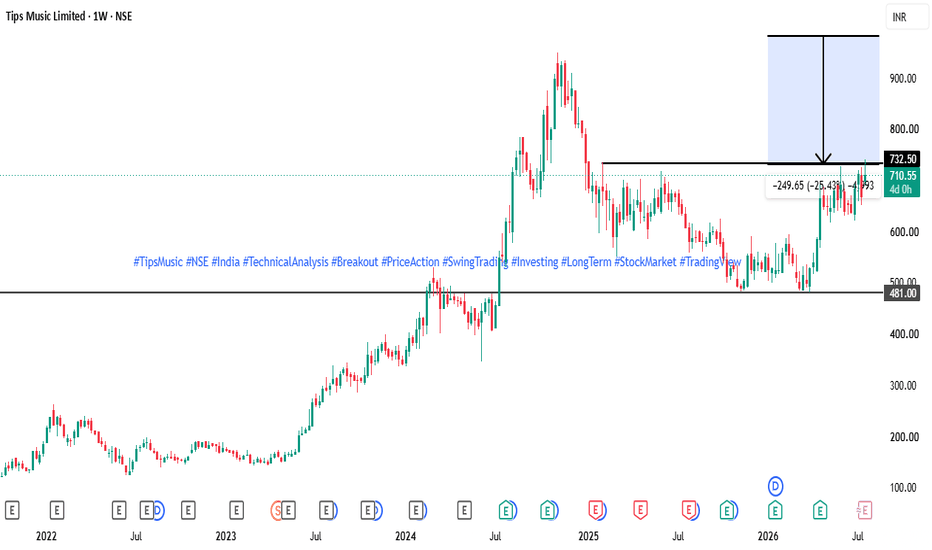
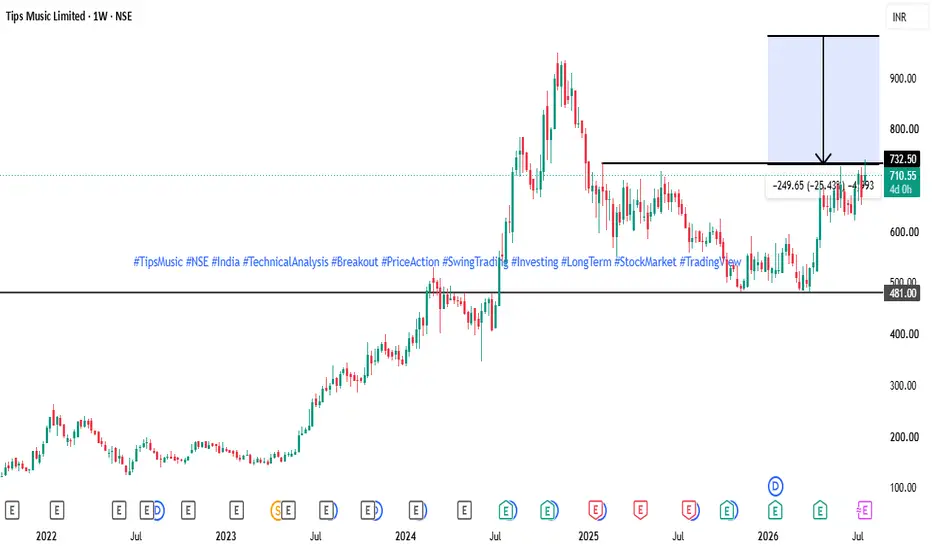
Tips Music LtdTips Music Ltd. | Weekly Chart Approaching a Major Breakout
Tips Music is trading just below a significant resistance zone around ₹732, a level that has capped price advances in recent months. The recent recovery indicates improving momentum, and a breakout could trigger the next leg of the long-term uptrend.
Technical Observations
Strong recovery from the ₹481 base.
Higher highs and higher lows indicate a bullish structure.
Price is consolidating just below key resistance.
Buying pressure continues to build.
A breakout above ₹732 could confirm continuation of the uptrend.
Key Levels
Current Price: ₹710
Breakout Level: ₹732
Immediate Support: ₹680–690
Major Support: ₹481
Long-Term Target Zone: ₹980+
Trading Plan
✔ Watch for a decisive weekly close above ₹732 with sustained momentum.
✔ Pullbacks toward ₹680–690 may offer improved risk-reward if the bullish structure remains intact.
✔ A failure to hold above the breakout level after confirmation may indicate a false breakout.
Disclaimer: This analysis is shared for educational purposes only and should not be considered investment advice. Always do your own research before investing.
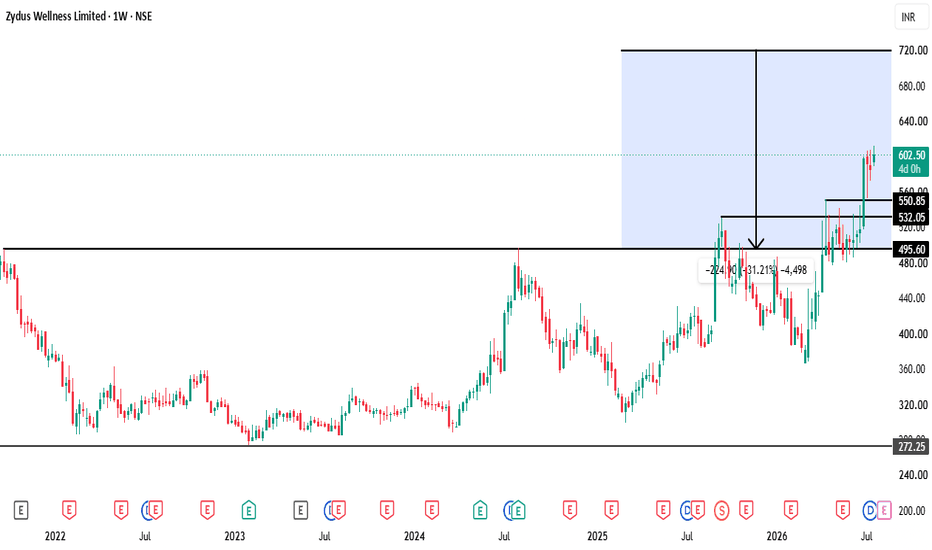
Zydus WellnessZydus Wellness | Weekly Breakout Signals Continuation of Long-Term Uptrend
Zydus Wellness has successfully broken above a major multi-year resistance near ₹495, confirming a continuation of its bullish market structure.
Technical Observations
Strong breakout above long-term resistance.
Higher highs and higher lows remain intact.
Momentum has accelerated after clearing resistance.
Price is trading comfortably above the breakout zone.
Previous resistance is now expected to act as support.
Key Levels
Current Price: ₹602
Immediate Support: ₹550–560
Major Support: ₹495
Long-Term Resistance / Projection: ₹720+
Trading Plan
✔ Watch for sustained weekly closes above ₹550.
✔ Pullbacks toward ₹550–560 or ₹495 may provide better risk-reward entries if supported by price action.
✔ A decisive close below ₹495 would weaken the current bullish setup.
Disclaimer: This analysis is shared for educational purposes only and is not financial advice. Always perform your own research before investing.
Nifty Intraday Outlook for 20-07-2026NIFTY 15 Min: Breakout Active, 24,380 Is Key
NIFTY is trading near 24,344 after a strong breakout above the 24,246 zone.
Current bias: Bullish / breakout continuation, but slightly stretched near resistance
Main view: NIFTY has given a strong upside move from the 24,080–24,100 zone and is now trading near the upper side around 24,340–24,350. The chart structure has clearly improved because price is forming higher highs and higher lows on the 15-min timeframe.
Broader cues are mixed. The previous week ended strong, with NIFTY closing around 24,334 on Friday, supported by IT and financial earnings, but GIFT Nifty was indicating a weaker start today.
The structure has turned bullish on the lower timeframe, but price is now close to immediate resistance near 24,369–24,380. Fresh CE should come only after confirmation.
______________________________
Key Levels
Resistance: 24,369–24,380
Target 1: 24,452
Target 2: 24,566
Support: 24,320–24,300
Breakout Base: 24,246
Lower Levels: 24,167 / 24,050
______________________________
Trade Plan
Bullish above 24,380
Targets: 24,452 / 24,500 / 24,566
Buy-on-dip near 24,320–24,300
Only if bullish rejection appears.
Bearish below 24,246
Targets: 24,167 / 24,050
______________________________
View
NIFTY is bullish, but slightly stretched.
Above 24,380 → buyers continue
Below 24,246 → breakout failure
Inside range → wait for confirmation
______________________________
Educational view only. Trade with strict risk management.
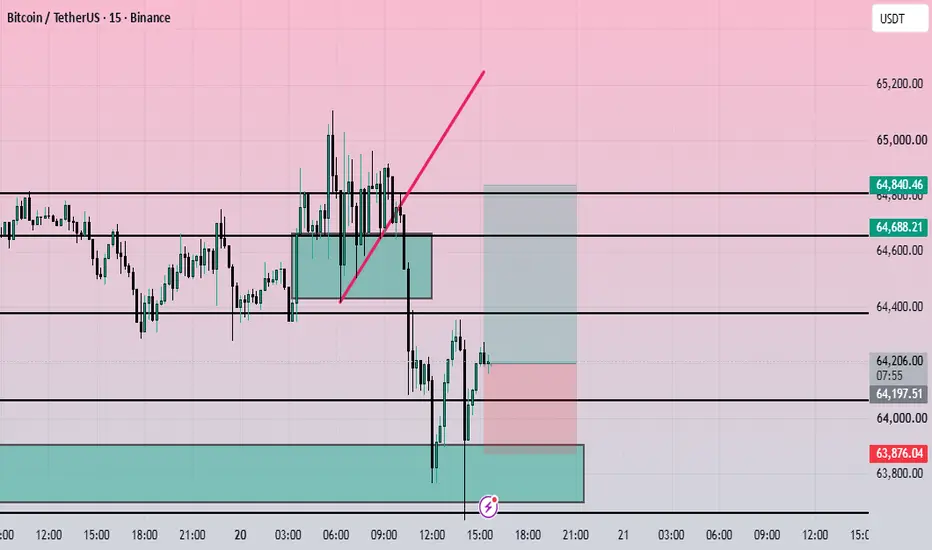
Retracement Perfect retracement setup. It is a 30-minute chart and the stock retrace is back towards the 200 EMA with a good trend because ADX is more than 18 so fairly trending and retraced back to the 200 EMA. It then fell down and broke the structure. After it broke the structure I would recommend entering at the 50% retracement level. I have indicated the exact level in the diagram and I have also put a stop loss and target with a 2:1 risk/reward ratio
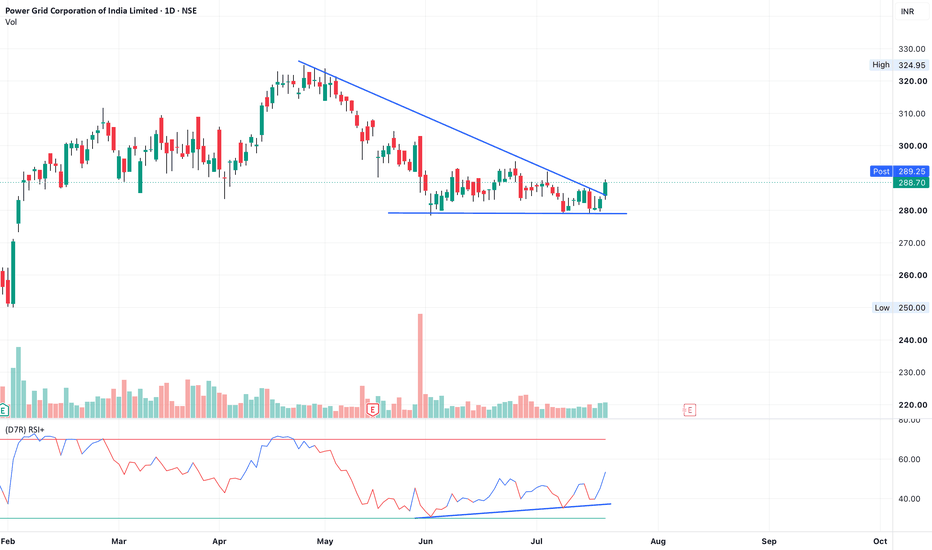
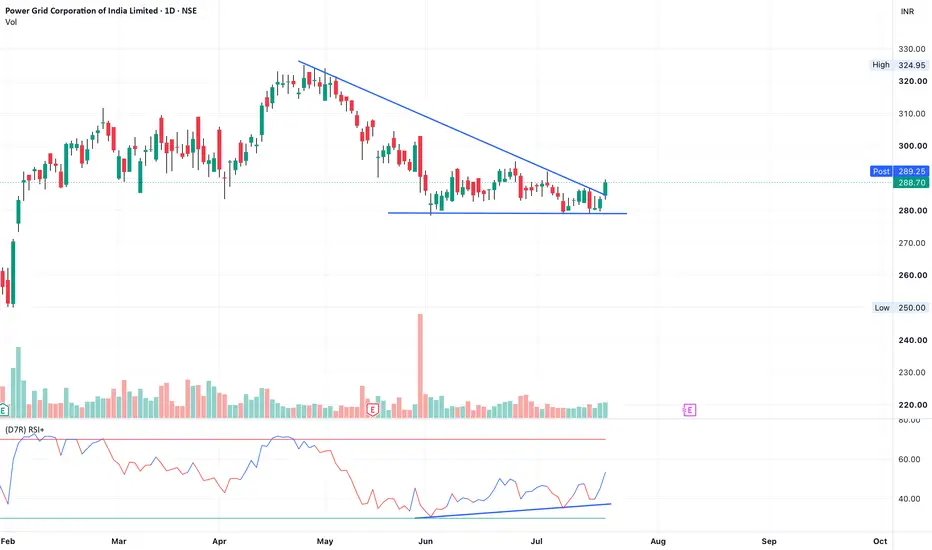
PowerGrid - RSI Bullish DivergencePowergrid has shown up move based on RSI bullish divergence. What this means is, the price was at the same level but the RSI was making higher lows. This is a long setup. Moreover, the price has broken descending triangle.
Note: I am not a registered SEBI member. Hence, please do not consider this as an investment advice. This is just for educational purposes.
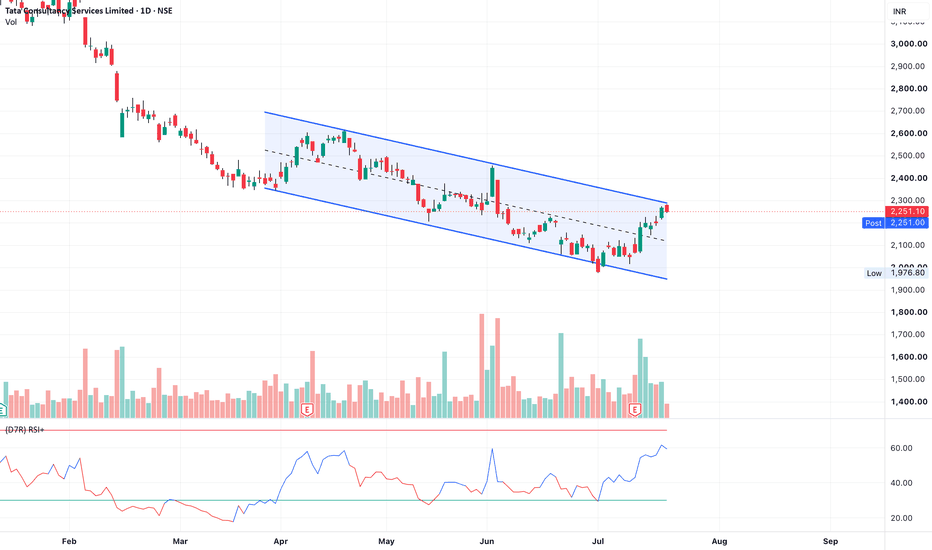
TCS testing resistance with low volumesBased on TCS earnings, there was an up-move with volumes. Currently, the price is near resistance. However, the rejection volume is not high. So keep a watch on this for further up move
Note: I am not a registered SEBI member. Hence, please do not take this as an investment advice. This is just for education purposes only.