Short
Short
MARUTISupport
S1: ₹13,400–13,450
S2: ₹13,180–13,250
S3: ₹12,950–13,000
Resistance
R1: ₹13,800–13,900
R2: ₹14,000–14,250
R3: ₹14,550–14,600
Trading Plan
Bullish Scenario
Buy only on a daily close above ₹13,900
Targets:
₹14,250
₹14,600
Stop Loss: ₹13,550
Bearish Scenario
If price closes below ₹13,180, downside may extend towards:
₹12,950
₹12,700
Stop Loss for short trades: ₹13,450
Technical View
RSI is around the neutral-to-bullish zone, indicating improving momentum.
MACD remains supportive of a recovery.
The stock is trying to form a higher-low structure after a prolonged correction, but confirmation requires a breakout above the immediate resistance zone.
Overall Bias
Above ₹13,900: Bullish continuation likely.
₹13,400–13,900: Range-bound; wait for breakout.
Below ₹13,180: Weakness may resume. BAJFINANCEResistance
R1: ₹1,050–1,056
R2: ₹1,080–1,085
R3: ₹1,100–1,102 (52-week high zone)
Support
S1: ₹1,020–1,025
S2: ₹992–1,000
S3: ₹963–965 (major weekly support)
Trading Plan
🟢 Bullish Scenario
Sustaining above ₹1,050 can trigger a breakout.
Upside targets:
₹1,080
₹1,100
₹1,130 (if momentum continues)
🔴 Bearish Scenario
A close below ₹1,020 may invite profit booking.
Downside levels:
₹1,000
₹992
₹963
Trend View
Short-term: Bullish
Swing Trend: Bullish above ₹992
Momentum: Positive with buyers in control, but watch for rejection near ₹1,080. Asian PaintsCurrent Price: ~₹2,689
🟢 Support Zones
₹2,670–2,675 – Immediate support
₹2,645–2,650 – Strong demand zone
₹2,620–2,630 – Major swing support
🔴 Resistance Zones
₹2,705–2,720 – First resistance
₹2,740–2,750 – Breakout level
₹2,800–2,850 – Positional target zone
Trading View
Bullish Scenario
Sustaining above ₹2,720 can trigger momentum toward:
₹2,750
₹2,800
₹2,850
Bearish Scenario
If price closes below ₹2,645, downside may extend toward:
₹2,620
₹2,580
Swing Trading Strategy
Buy on dips: ₹2,660–2,675 (only if bullish reversal appears)
Breakout Buy: Above ₹2,720 with strong volume
Stop Loss: Below ₹2,640
Swing Targets: ₹2,750 → ₹2,800 → ₹2,850
Technical Outlook
Trend: Mild Bullish
Momentum: Neutral to Positive (RSI ~52)
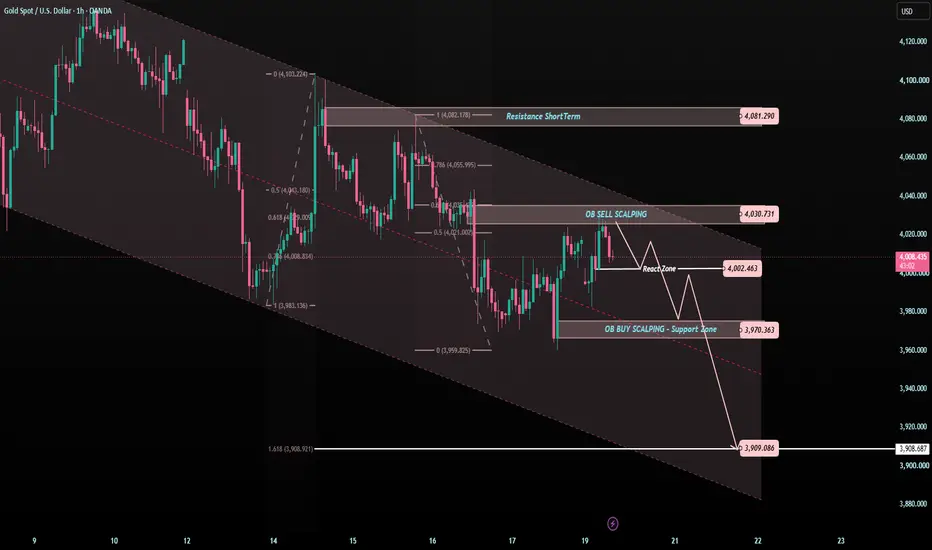
Bias: Buy on dips while price remains above ₹2,645. A decisive breakout above ₹2,720 would strengthen the bullish setup. XAUUSD — 4,030 Is the Trap Zone?Gold is still moving inside the descending price channel.
Price is trading around 4,010 after reacting from the lower area, but the recovery is not clean yet.
Why?
Because gold is now moving into the first sell reaction zone, while the larger structure is still under bearish pressure.
For me, today’s chart is not about chasing the bounce.
It is about watching whether 4,030 becomes a trap for buyers.
The simple read
Gold is still cautious while price stays below 4,030.
The 4,030 area is the OB sell scalping zone and also sits near the Fibonacci reaction structure.
If sellers defend this zone, gold may rotate lower again toward 4,002.
If 4,002 fails, the next important support is 3,970.
Below 3,970, the deeper downside target is 3,909.
The stronger resistance remains higher at 4,081.
Gold needs to reclaim 4,030 first, then 4,081, before the recovery becomes cleaner.
Key price zones
Current price area: 4,005 - 4,015
First reaction zone: 4,002
OB sell scalping zone: 4,030
Short-term resistance: 4,081
OB buy scalping / support zone: 3,970
Fibo extension target: 3,909
Bearish pressure weakens above: 4,030
Recovery becomes stronger above: 4,081
Trading plan
📉 Rejection scenario
If gold reaches 4,030 and shows rejection:
Sellers may try to push price back toward 4,002.
If 4,002 breaks, the next support zone is 3,970.
If 3,970 also fails, the deeper target becomes 3,909.
This keeps the descending channel structure active.
📈 Short recovery scenario
If gold breaks and holds above 4,030:
A short-term recovery may continue toward 4,081.
But this is still not a full bullish reversal yet.
Gold needs a clean break and hold above 4,081 before the recovery structure becomes stronger.
No clean hold above 4,030 = no strong buy view.
📈 Support reaction scenario
If gold pulls back into 3,970:
This is the first important buy reaction area on the chart.
A clean bullish reaction from 3,970 may create a short-term bounce.
But if 3,970 breaks clearly, I will watch 3,909 as the deeper reaction zone.
No reaction from support = no buy.
Tiara’s View
A small recovery inside a bearish channel can look attractive.
But if price is still below resistance, the market can easily turn the bounce into a trap.
That is why 4,030 is the key level today.
If gold cannot break this zone, sellers may still control the next move.
If gold holds above it, the chart may try to recover toward 4,081.
Main view:
Gold remains cautious below 4,030.
4,030 is the trap zone to watch.
4,002 and 3,970 are the nearest support areas.
3,909 is the deeper downside target if the channel keeps control.
Reaction first.
Confirmation second.
Trade last.
No confirmation = no trade.
Do you think gold will break 4,030, or reject from this trap zone first?  Short
Short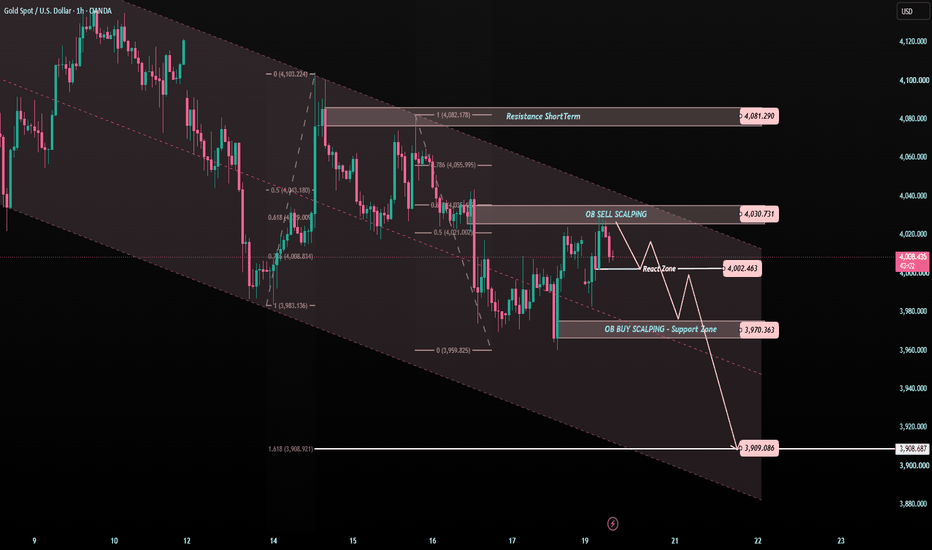
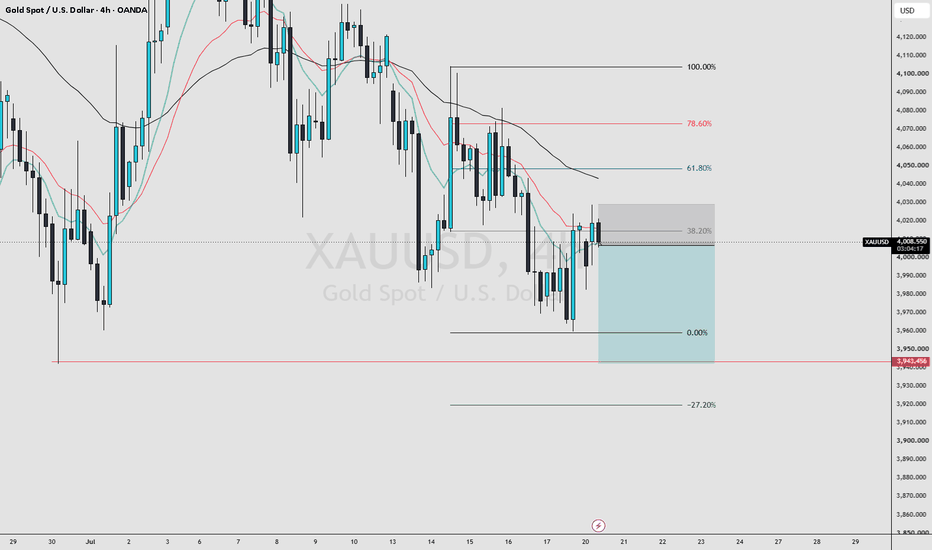
XAUUSD — OB Rejection, Intraday Sell BiasMarket Context
Gold is trading around $4,008 after a short-term recovery from the lower liquidity area. However, the overall intraday structure is still weak because price remains below the descending trendline and has not reclaimed the upper supply zone.
The key area on this chart is the Sell zone OB around $4,030–$4,037. This zone sits below the liquidity level near $4,043 and aligns with the descending trendline, making it the main reaction area where sellers may step back in.
SMC View
From an SMC perspective, gold already created bearish BOS and continued to trade under the main trendline. The recent bounce looks more like a corrective pullback into imbalance and supply, not a confirmed bullish reversal.
The FVG area may act as short-term resistance, but the stronger sell decision zone remains the OB at $4,030–$4,037. If price taps this area and fails to break above the liquidity level, it can create a clean sell reaction toward the sellside liquidity below.
Main Trading Scenario
Condition:
Gold pulls back into the Sell zone OB around $4,030–$4,037 and forms bearish rejection. Lower timeframe MSS / CHOCH confirmation is needed before entry.
Entry: $4,030–$4,037 after bearish rejection
SL: above $4,043
TP1: $4,008
TP2: $3,982
TP3: $3,960
Key Zones to Watch
Current price area: $4,008
Main sell zone OB: $4,030–$4,037
Liquidity above OB: $4,043
FVG reaction zone: $4,018–$4,022
Short-term support: $4,000
Sellside liquidity: $3,982
Intraday low target: $3,960
Trendline resistance: price remains below the descending trendline
Sell confirmation: rejection from $4,030–$4,037 with lower timeframe MSS / CHOCH
Bearish invalidation: clean 2H close above $4,043
Prime Gold View
My current view is that gold remains under intraday selling pressure while price stays below the descending trendline and the $4,030–$4,037 OB zone. The Prime Gold plan is to avoid chasing sell at the current price and wait for price to pull back into the OB before looking for confirmation.
If sellers defend this OB, gold may continue lower toward $4,008, $3,982 and potentially the low area around $3,960. If price breaks and holds above $4,043, the sell setup becomes weaker and the market may need a new structure before the next decision.
No confirmation, no trade.
Short 
 Long
Long
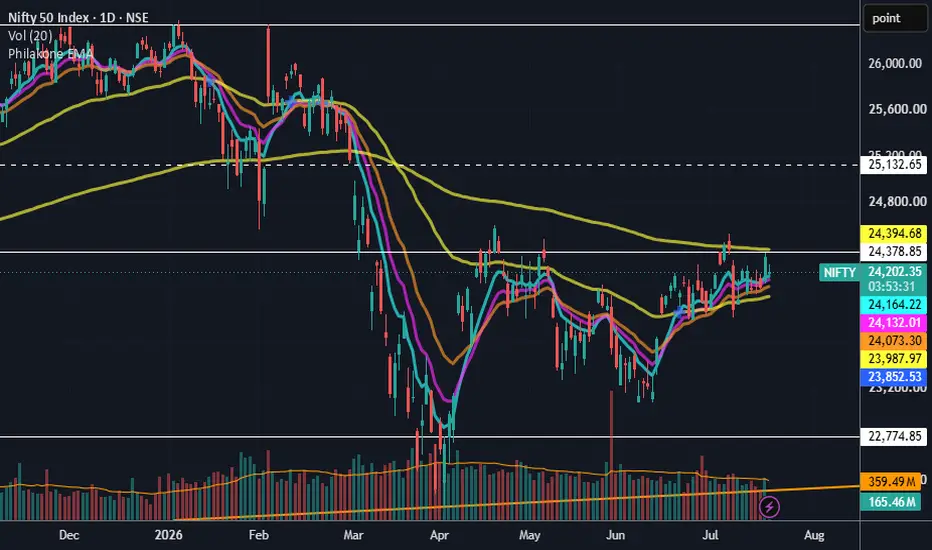
NIFTY Weekly updateNIFTY50 traded in the tight range of 24,000-24,500 (EMA confluence levels) during the last week, before closing ~130 points higher compared to its previous week.
The FII selling has resumed in the markets, after a pause before week, amid the reignition of geopolitical tensions. Further, the raising oil prices and higher than expected CPI numbers gave no respite to the markets.
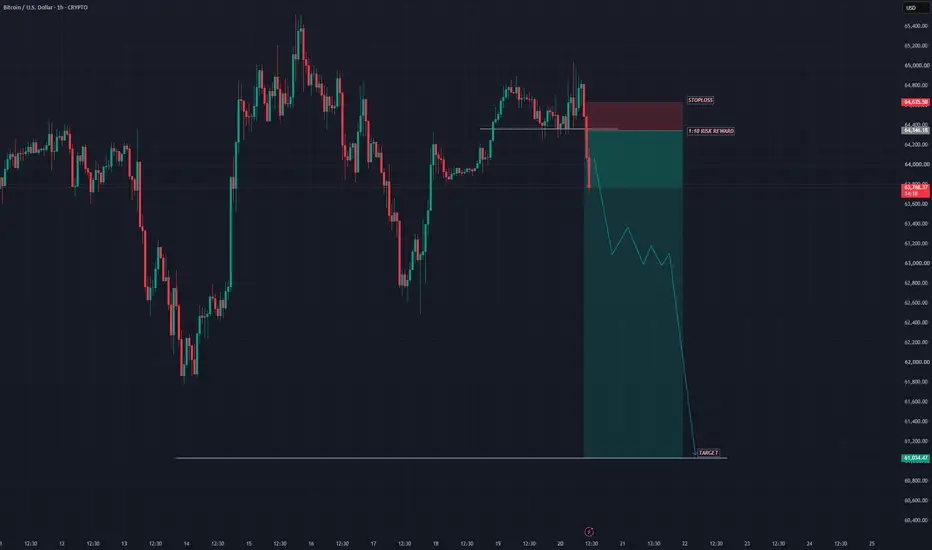
For the current week, I expect market to trade in the range of 24,000-24,400. On the upside, 25,100 will act as the first resistance level. On the downside, 23,800 can act as first support level and the previous swing low of 23,000 further. Bitcoin 1:6 RISK-REWARD TARGET ACHIEVED as given in lastpost**Bitcoin Trendline Breakout ✅ | 1:6 Risk Reward Target Achieved | Price Action Trade Recap**
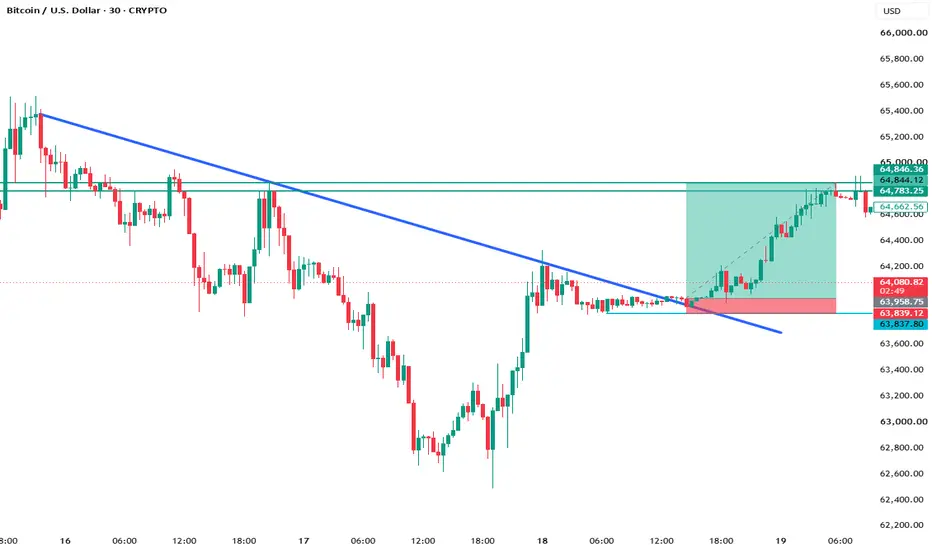
🚀 BITCOIN TRADE RECAP | 1:6 RR TARGET ACHIEVED ✅
A clean Trendline Breakout setup executed with patience and discipline.
📌 Entry only after breakout confirmation.
📌 Proper Stop Loss placement.
📌 High Probability Price Action Setup.
📌 1:6 Risk Reward Target Achieved.
The market rewards traders who follow rules—not emotions.
💡 Remember:
✔ Wait for confirmation.
✔ Manage your risk.
✔ Never chase trades.
✔ Let Risk Reward do the work.
If this trade recap helped you learn something new, don't forget to ❤️ Like, 💬 Comment, 📌 Save, and 📤 Share it with fellow traders.
Follow *for daily Price Action Analysis, ICT & Smart Money Concepts (SMC), Intraday & Swing Trading Setups, Trading Psychology, Risk Management, and High Probability Trade Setups.
Bitcoin, BTC, BTCUSD, Bitcoin Trading, Crypto Trading, Cryptocurrency, Crypto Market, Bitcoin Analysis, BTC Analysis, Crypto Analysis, Price Action, Price Action Trading, Technical Analysis, Trendline Breakout, Breakout Trading, Breakout Strategy, Risk Reward, 1:6 Risk Reward, Risk Management, Trading Psychology, Smart Money Concepts, SMC Trading, ICT Trading, ICT Concepts, ICT Strategy, Liquidity Sweep, Order Block, Fair Value Gap, FVG, BOS, CHOCH, Market Structure, Support and Resistance, Supply and Demand, Candlestick Patterns, Trading Education, Learn Trading, Intraday Trading, Swing Trading, Futures Trading, Scalping, Momentum Trading, High Probability Setup, Winning Trade, Trade Recap, Crypto Signals, Bitcoin Chart, Trading Strategy, Professional Trading, Trade With Logics
#Bitcoin #CryptoTrading #PriceAction #ICTTrading #TradeWithLogics
Long 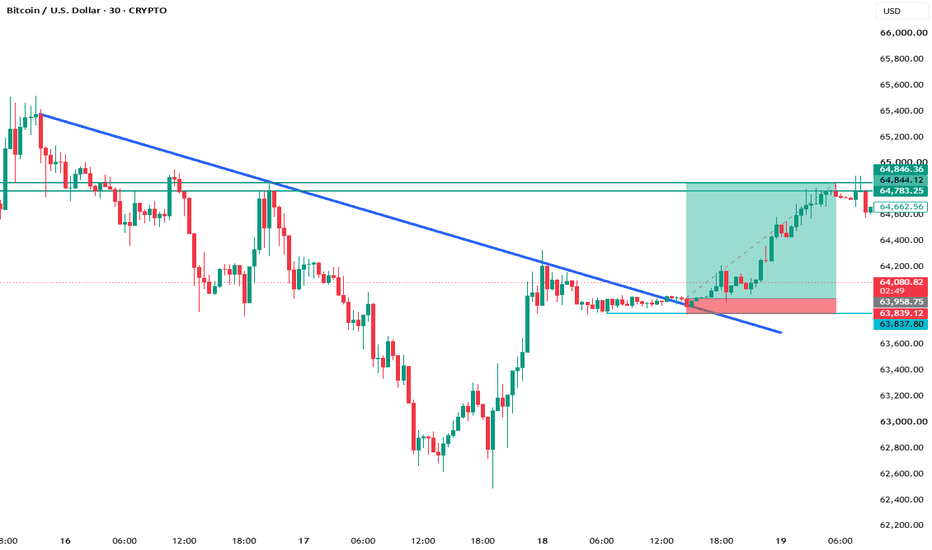
AEGISVOPAK | Weekly Breakout Meets $5 Billion Expansion VisionAegis Vopak Terminals is currently at a fascinating junction where a multi-year infrastructure expansion is finally reflecting on the weekly price charts. After a prolonged corrective phase, the stock is attempting a structural breakout
.
1. The Technical Setup: Weekly Trendline Break
Breakout Attempt: Price has moved above a significant falling trendline and is now testing a crucial resistance/breakout zone
.
Momentum Indicators: The RSI is rising into a stronger zone, and the MACD has turned positive with increasing histogram strength, suggesting that downside pressure is fading
.
Moving Averages: The faster moving average remains above the slower one, and both are rising after the June breakout, which is a constructive sign for the long-term trend
.
Relative Strength (RS): The RS line expanded sharply through July and remains comfortably positive, even as it "cools" from its recent peak
.
2. The Fundamental Catalyst: Measuring the Expansion
The chart is reflecting an "expectations story" as the company transitions from announcement to execution
.
Capacity Growth: Since the Nov 2021 joint venture, liquid storage capacity has grown 3.75x and LPG static capacity 4.5x
.
Earnings Impact: This isn't just a "paper" expansion; FY26 Profit After Tax (PAT) surged 52.1% to ₹341.9 crore
.
The 5BnAmbition:∗∗Managementhasoutlinedamassiveaggregate∗∗capexambitionofUS5 billion by 2030, creating a long-term growth runway
.
3. Key Levels to Watch
The Pivot Zone (₹275–₹280): A sustained weekly close above this zone is required to confirm the breakout and move the stock into a new price discovery phase
.
Targets: If the breakout holds, the next logical resistance areas are ₹295–₹300, followed by ₹320–₹330
.
Support: ₹255–₹260 is the immediate support to track. A deeper base exists at ₹230–₹235
.
The Verdict
Aegis Vopak is entering its first serious structural test. The goal now is to see execution (new terminal commissioning) and earnings move in sync with the stock price
. Is the recent pullback a simple mean-reversion test, or a recalibration of expectations?
.
Disclaimer: Shared for educational study only. Not a buy/sell recommendation. Please consult a qualified financial advisor before taking any investment decisions.
 Long
Long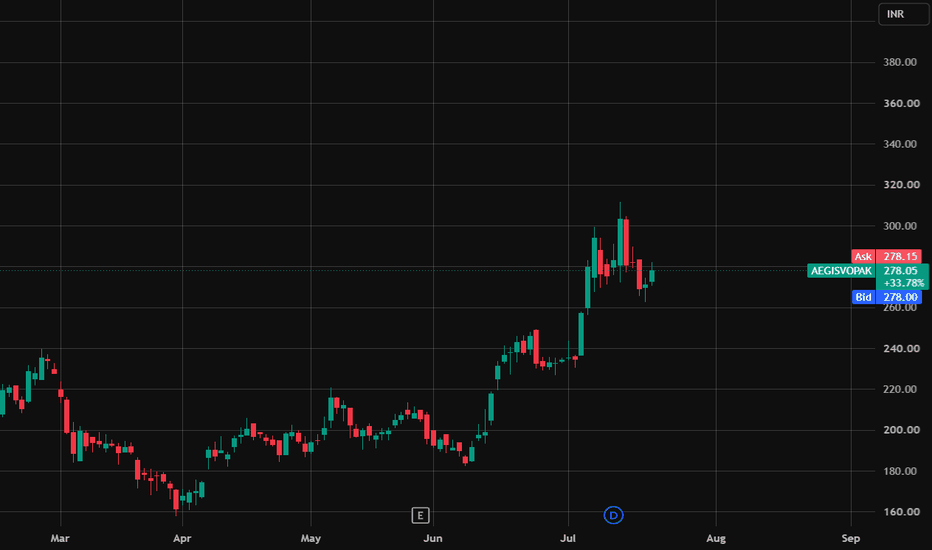
Long
 Long
Long
MASON XAUUSD – Key Support And Resistance SetupXAUUSD is trading around 4,010 after recovering from the lower support area, but price is still moving below the main descending trendline. The short-term reaction shows buyers are defending the support zone, but the broader structure still needs confirmation before a stronger bullish move can be trusted.
The priority plan is to trade from strong support and resistance zones, with sell pressure still favoured if gold rejects from the upper Fibonacci resistance areas.
Technical View
Gold is currently trading below the descending trendline, which means the market is still under short-term bearish pressure. Even though price has reacted from the lower area, the recovery remains corrective while gold stays below the trendline and key resistance zones.
The 3,991–3,997 area is the main buy zone on the chart. This zone aligns with the Fibonacci 50 reaction area and sits above the 3,982 support. If gold pulls back into this area and holds, a short-term bullish reaction may appear.
However, the upside still has two important resistance zones. The first one is the 4,051–4,055 sell scalping FVG zone. This area may create the first bearish reaction if price recovers from the buy zone.
The stronger resistance is around 4,078–4,085, marked as the sell zone and Fibonacci 50 area. This zone is important because it aligns with the previous structure, Fibonacci resistance, and the descending trendline region. If gold reaches this zone and rejects, it may confirm another lower high before price turns down again.
The 3,982 level is the key support. If gold loses this level, the bullish reaction becomes weak, and price may move back toward the stronger support range around 3,960–3,970.
Key Zones
Current price: 4,010
Main buy zone: 3,991–3,997
Key support: 3,982
Strong support: 3,960–3,970
Sell scalping FVG zone: 4,051–4,055
Major sell zone: 4,078–4,085
Descending trendline resistance: 4,055–4,085
Invalidation for sell view: above 4,085
Trading Plan
Sell Priority: 4,051–4,055
Condition: wait for bearish rejection, failed breakout above the FVG zone, or price staying below the descending trendline.
SL: above 4,085
TP1: 3,991–3,997
TP2: 3,982
TP3: 3,960–3,970
Alternative Sell Scenario
If gold pushes higher into 4,078–4,085, wait for a clear bearish rejection from this major resistance zone before looking for sell continuation. This would be the stronger resistance-based sell setup.
SL: above 4,095
TP1: 4,051–4,055
TP2: 3,991–3,997
TP3: 3,982
Buy View
Buy is possible only as a short-term reaction from the 3,991–3,997 zone or near 3,982 support. The condition is clear bullish rejection, price holding above support, and a lower-timeframe higher low formation.
Buy Zone: 3,991–3,997
SL: below 3,982
TP1: 4,051–4,055
TP2: 4,078–4,085
Final View
Overall, gold is reacting from support, but the market has not broken the descending trendline yet. The cleaner plan is to wait for price to reach the strong decision zones. A reaction from 3,991–3,997 may support a short-term buy, while rejection from 4,051–4,055 or 4,078–4,085 keeps the bearish structure active.
Will gold hold the 3,991–3,997 support zone and recover, or reject from resistance and return toward 3,982?
Long 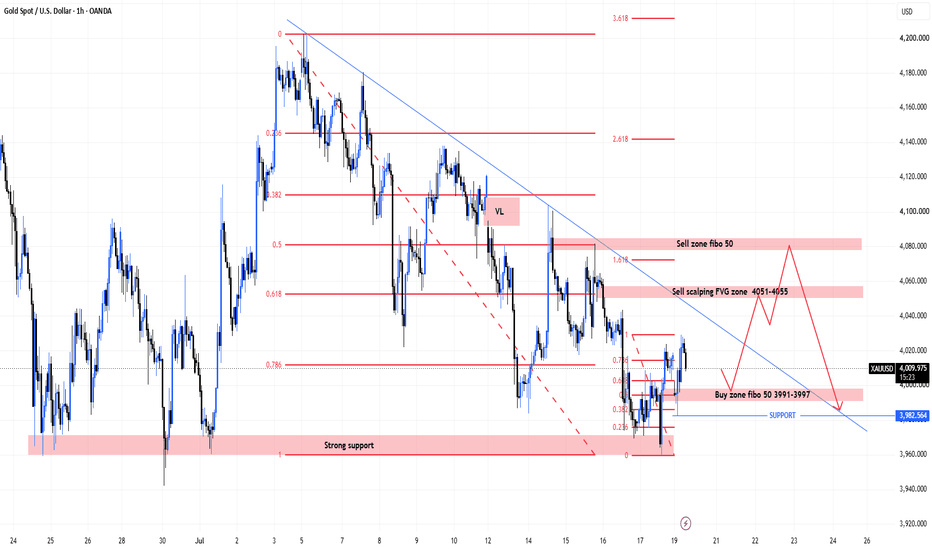
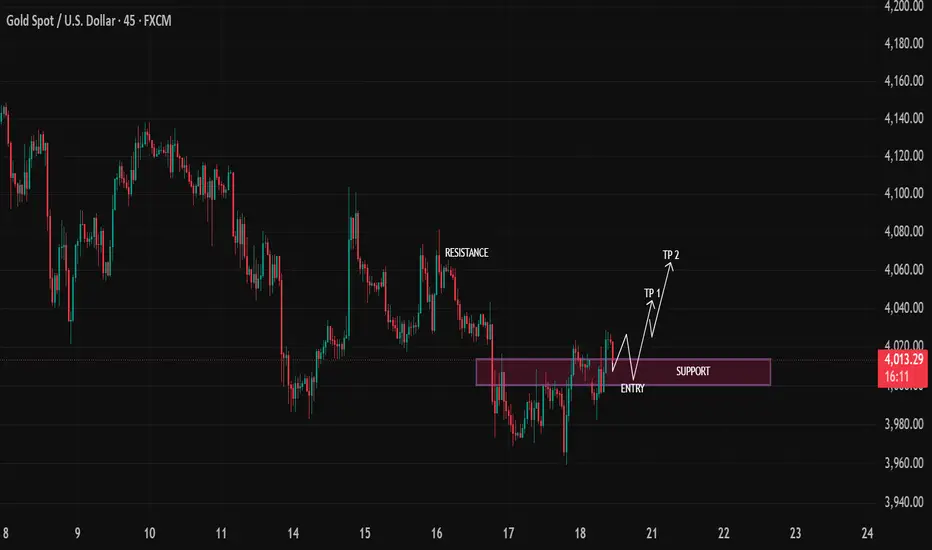
# **XAU/USD (Gold) 45-Minute Chart Analysis ## **Market Overview**
The 45-minute XAU/USD chart shows that gold remains in a **short-term recovery phase** after establishing a swing low around the **3,965–3,980** region. Buyers have regained momentum, pushing price back above the psychological **4,000** level while approaching a previous supply area.
Although the broader trend has recently been bearish, the current structure suggests a **potential trend continuation to the upside**, provided the marked support zone continues to hold.
---
# **Technical Structure**
### **1. Market Trend**
* **Higher Low Formation:** Bullish
* **Short-Term Momentum:** Positive
* **Overall Structure:** Recovery within a broader downtrend
Price has started printing higher lows after rejecting the recent lows, indicating buyers are gradually taking control.
---
### **2. Support Zone**
**Support Area:** **4,000 – 4,010**
This highlighted purple zone represents:
* Previous resistance turned support
* Multiple candle reactions
* Strong buying interest
* Psychological round-number support
As long as price remains above this area, the bullish scenario remains valid.
---
### **3. Resistance Zone**
Nearest resistance sits around:
**4,040 – 4,060**
This area has rejected price several times previously and could temporarily slow bullish momentum.
A successful breakout above this level would confirm stronger buying pressure.
---
# **Trade Scenario**
## **Preferred Setup: Buy the Pullback**
Rather than chasing price higher, waiting for a retracement into support provides a better risk-to-reward opportunity.
### **Entry**
* Buy near **4,000–4,010**
* Wait for bullish confirmation (bullish engulfing, pin bar, or strong rejection candle).
---
### **Stop Loss**
Below the recent swing low.
Suggested area:
**3,985–3,990**
---
### **Take Profit Targets**
**TP1**
* **4,040–4,045**
* Previous intraday resistance
**TP2**
* **4,055–4,065**
* Major resistance and projected measured move
---
# **Bullish Confirmation Signals**
Look for:
* Bullish engulfing candle
* Long lower wick rejection
* Strong buying volume
* Break above recent swing high
* Higher low maintained
These would strengthen the probability of continuation toward the target zones.
---
# **Invalidation Scenario**
The bullish outlook becomes weaker if:
* Price closes decisively below **4,000**
* Support fails with strong bearish momentum
* Lower lows begin forming
In that case, sellers could retest:
* **3,980**
* **3,965**
* **3,950**
---
# **Risk Management**
* Risk no more than **1–2%** of trading capital per position.
* Wait for confirmation before entering rather than placing a blind limit order.
* Aim for a **minimum risk-to-reward ratio of 1:2**, with **1:3** preferred if targeting TP2.
---
# **Professional Outlook**
The chart presents a **bullish pullback opportunity** rather than a breakout trade. The **4,000–4,010 support zone** is the key technical area to monitor. A confirmed bounce from this region could propel XAU/USD toward **4,040 (TP1)** and **4,060 (TP2)**. However, a decisive breakdown below support would invalidate the bullish setup and shift the short-term bias back to bearish.
**Bias:** **Moderately Bullish (Buy on Pullback)**
**Key Support:** **4,000–4,010**
**Key Resistance:** **4,040–4,060**
**Trading Strategy:** **Wait for a pullback into support, confirm buyer strength, then target higher resistance levels.**
Long 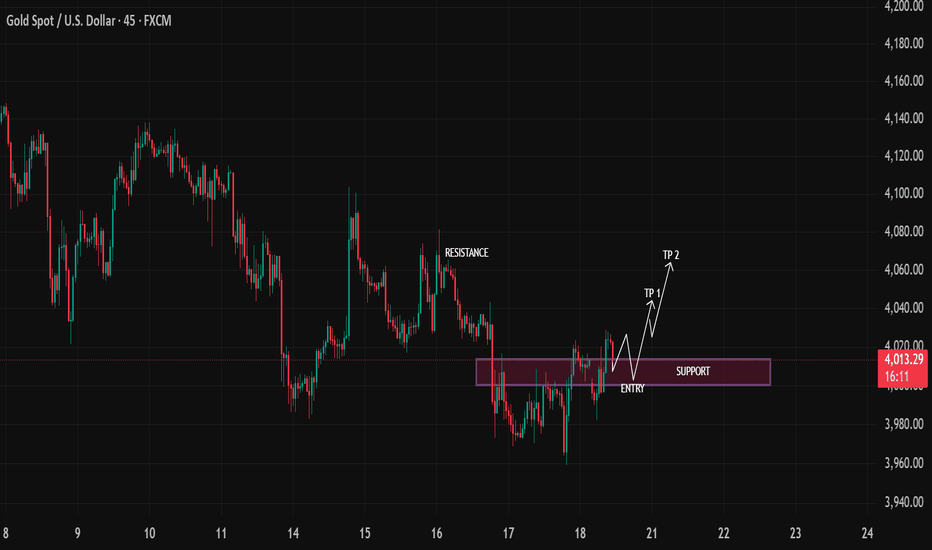
 Long
Long
 Long
Long
 Education
 Short
Short