Trend Analysis
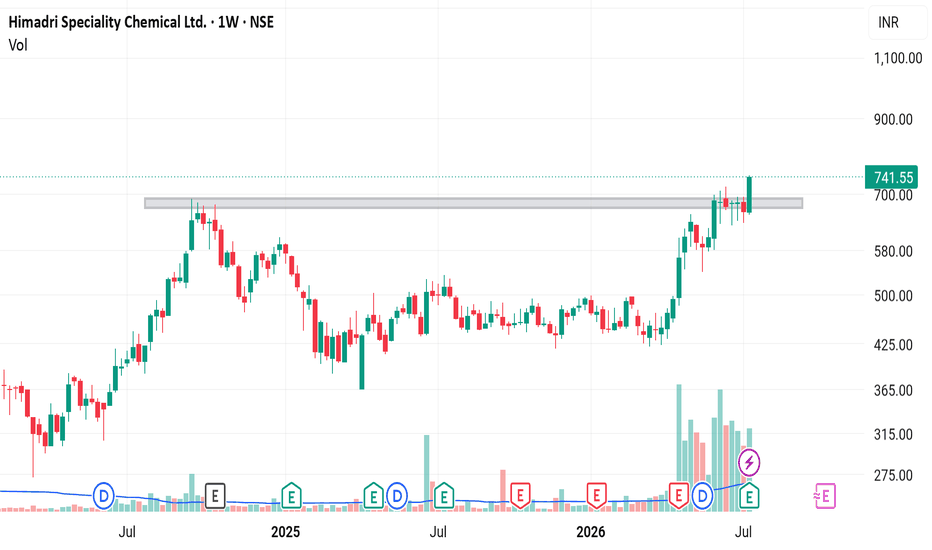
Concor strong breakout with strong volumeToday concor has witnessed a volume and price breakout,
price was consolidating between 442 and 480 zone now the level has breached and structure is good, atleast it is above change of character in 1 H chart,
for tomorrow 15th july or whenever it breaks 495 and closes a 15 minute candle above it than buy with sl 486 for target 505 508 514 in intraday , postional can go long till 528 536
Now, in 1H chart still break of structure is not there but still change of character is there which signifies bullishness, rest wait for level and keep strict sl while trade, for positional sl will be 480
scenario 2: it goes gapdown than enter near 480 484 zone with sl 477
NIFTY still in a range!! NOT YET CONFIRMED!As we can see NIFTY is still in the range despite the strong upmove. Going by our analysis we can still see NIFTY has not broke the important supply zone and psychological level of 24500, which could hinder NIFTY from continuing its bullishness. Hence we can expect NIFTY to remain sideways and bulllishness will only be confirmed if NIFTY manages to close above the mentioned supply zone. So, plan your trades accordingly and keep watching everyone.
Gold Daily Bearish MoveLooking closer the upside liquidities, I indicated shows price has some refilling it has to do but right now, I am leaning bearish because price has many times tried to take out the SSL at $3,946 and this time is quite right because most traders might be confused on where next market will go...
After a major sell off, then with no doubt are we going to see price coming back to clear all those BSL pending above
Bank Nifty spot 58521.40 Daily Chart - Weekly UpdateBank Nifty spot 58521.40 Daily Chart - Weekly Update
- *Bank Nifty closed 0.82% positive above last week closure*
- Support Zone 56700 to 57900 for Bank Nifty Index
- Stable Resistance Zone 58600 to 60100 for Bank Nifty Index
- Bank Nifty trends between Support & Resistance since mid June 2026
- Bank Nifty Index retracing from the Resistance Zone and awaits a breakout
- Bank Nifty thou dipped deep into Support Zone yet managed closure above it
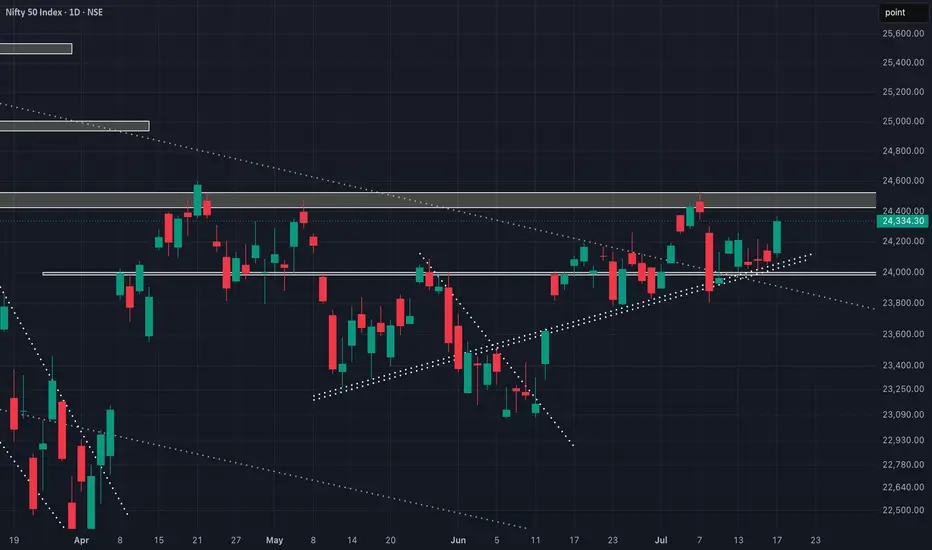
Nifty spot 24334.30 Daily Chart - Weekly UpdateNifty spot 24334.30 Daily Chart - Weekly Update
- *Nifty closed 0.53% positive above last week closure*
- Support Zone stable at 235500 to 23950 for the Nifty Index Band
- Resistance Zone stable at 24350 to 24750 for the Nifty Index Band
- Nifty yet traversing between Support & Resistance since mid June 2026
- Nifty attempts to break Resistance Zone dampened by Geo Political factors
- Support Zone is keeping a stable ground for Nifty Index since past few weeks
XAUUSD/GOLD 1H SELL LIMIT PROJECTION 17.07.26XAUUSD / GOLD – 1H Sell Limit Projection
Gold is currently showing strong bullish momentum, but the overall 1-hour structure remains under a descending trendline. The current rise may be a corrective pullback toward a major resistance zone before another bearish move.
Sell Limit Zone: Around 4024–4027
This zone has strong confluence from:
1H descending trendline
Previous resistance level
Supply/rejection area
Potential liquidity collection above the recent bullish candles
Stop Loss: Around 4043.169
The stop is placed above the major resistance zone. A strong 1H close above this level could invalidate the bearish setup.
Take Profit 1: Around 4012
This is the first nearby support area. After price rejects the sell zone and moves below approximately 4017–4018, the trade can be protected at breakeven.
Take Profit 2: Around 3999.408
This is the main target near the psychological 4000 level and an important support zone.
NIFTY- Intraday Levels :- 20th July 2026
NIFTY sustain above 24395/406/413 above this bullish then around 24499/500/13/15/20/27 above this more bullish then 24541/47/55/76 then above this more bullish above this wait more level are marked on chart
If NIFTY sustain below 24240 then 24227/24/20/ or 24210/03 below this wait more levels marked on chart
My view :-
"My viewpoint, offered purely for analytical consideration, The trading thesis is: Nifty (bullish tactical approach: buy on bip)
However, Wait for good support, before taking any trading decision.
This analysis is highly speculative and is not guaranteed to be accurate; therefore, the implementation of stringent risk controls is non-negotiable for mitigating trade risk."
Consider some buffer points in above levels.
Please do your due diligence before trading or investment.
**Disclaimer -
I am not a SEBI registered analyst or advisor. I does not represent or endorse the accuracy or reliability of any information, conversation, or content. Stock trading is inherently risky and the users agree to assume complete and full responsibility for the outcomes of all trading decisions that they make, including but not limited to loss of capital. None of these communications should be construed as an offer to buy or sell securities, nor advice to do so. The users understands and acknowledges that there is a very high risk involved in trading securities. By using this information, the user agrees that use of this information is entirely at their own risk.
Thank you.
BUY TODAY SELL TOMORROW for 5%DON’T HAVE TIME TO MANAGE YOUR TRADES?
- Take BTST trades at 3:25 pm every day
- Try to exit by taking 4-7% profit of each trade
- SL can also be maintained as closing below the low of the breakout candle
Now, why do I prefer BTST over swing trades? The primary reason is that I have observed that 90% of the stocks give most of the movement in just 1-2 days and the rest of the time they either consolidate or fall
Cup and handle breakout in AIIL
BUY TODAY SELL TOMORROW for 5%
Silver is all time buy - ready to generate extrordinary returnsDon't Panic Over This Silver Drop—It's a Generational Buying Floor
Silver gave a breakout of a 45-year Cup & Handle pattern, and the price is about to retest the breakout support line of the C&H pattern.
Note: log % scale is used as a larger picture is being analyzed
As per the C&H rule, the fib extension, & the analysis - the target for Silver is somewhere between 600-750
The Calculation ($745 Target)
Cup Neckline Resistance: ~$48.00 (Set by the 1980 and 2011 peaks).
Accumulation Base Floor: ~$3.40 (1993 generational low).
The Log Projection: Duplicating the exact depth of the cup on a log scale and projecting it upward from the breakout neckline provides a technical target of $745.00.
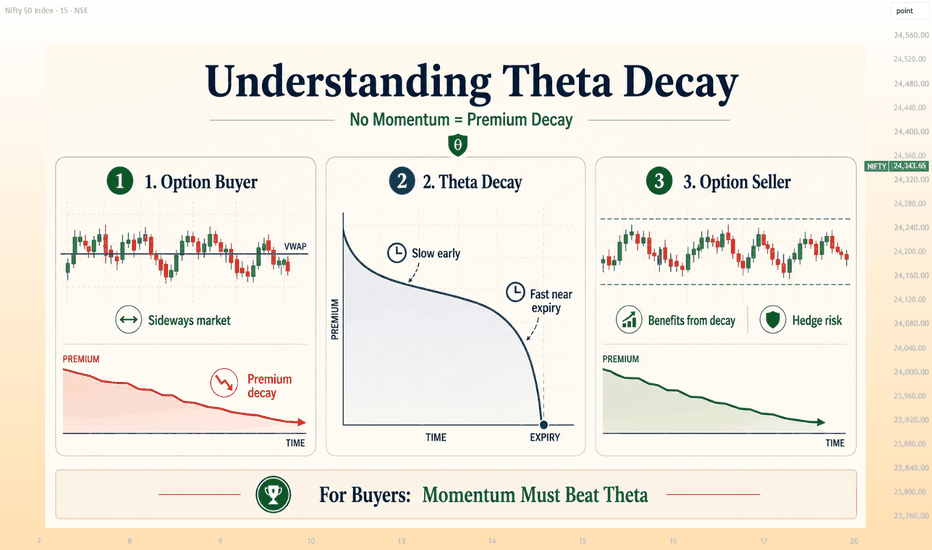
The Silent Killer of Option BuyersUnderstanding Theta Decay in Options 📊
Many beginners buy options and wonder:
“Market did not move much against me, then why did my premium fall?”
The answer is simple:
**Theta Decay.**
Theta decay means option premium loses value as time passes.
------------------------------------------
✅ What Is Theta?
Theta shows how much value an option may lose because of time passing.
For option buyers, theta usually works against them.
For option sellers, theta usually works in their favour.
If you buy CE or PE, you need the market to move in your direction fast enough.
If the market stays sideways, premium can fall even if your view is not completely wrong.
------------------------------------------
✅ Why Premium Falls With Time
Option premium has two parts:
**Intrinsic Value + Time Value**
Theta mainly affects time value.
As expiry comes closer, time value reduces.
That is why options lose premium when there is no strong movement.
------------------------------------------
✅ Theta Hurts Option Buyers
Option buyers lose from theta when:
• Market is sideways
• Price is stuck near VWAP
• Breakouts fail
• Momentum is missing
• Expiry is close
• Far OTM options are bought
• Premium is held with hope
No movement means premium decay.
That is why option buying needs direction plus momentum.
------------------------------------------
✅ Theta Helps Option Sellers
Option sellers benefit when premium falls over time.
Theta supports sellers when:
• Market is range-bound
• Support/resistance is holding
• Momentum is weak
• Premium slowly decays
• Price stays away from sold strike
But naked selling is risky.
Theta helps, but risk management protects.
------------------------------------------
✅ Theta Is Faster Near Expiry
Theta decay is not equal every day.
It becomes faster as expiry comes closer.
Near expiry, even 30–60 minutes of sideways movement can reduce option premiums sharply.
This is why expiry-day option buying is dangerous without momentum.
------------------------------------------
✅ ATM, ITM and OTM Impact
**ATM options:** Usually have high time value, so theta impact is strong.
**OTM options:** Mostly time value, can decay very fast.
**ITM options:** More stable because they have intrinsic value.
This is why far OTM lottery trades are risky near expiry.
------------------------------------------
✅ Simple Rule for Option Buyers
Do not buy options only because premium looks cheap.
Buy options only when:
• Direction is clear
• Momentum is strong
• Candle close confirms
• Volume supports
• Price moves away from VWAP
• Premium also shows strength
If momentum disappears, exit quickly.
------------------------------------------
✅ Simple Rule for Option Sellers
Sell options only when:
• Market is range-bound
• Support/resistance is clear
• Risk is defined
• Position is hedged
• Quantity is controlled
Do not sell naked options near breakout or breakdown zones.
------------------------------------------
✅ Finally important point is;
Theta decay is silent.
It slowly eats premium when the market does not move.
👉For option buyers:
**Momentum must beat theta.**
👉For option sellers:
**Theta helps only when risk is controlled.**
👉Remember:
- Sideways market kills option buyers.
- Near expiry, theta becomes aggressive.
- Cheap option does not mean good option.
- No momentum = premium decay.
------------------------------------------
Educational Purpose Only.
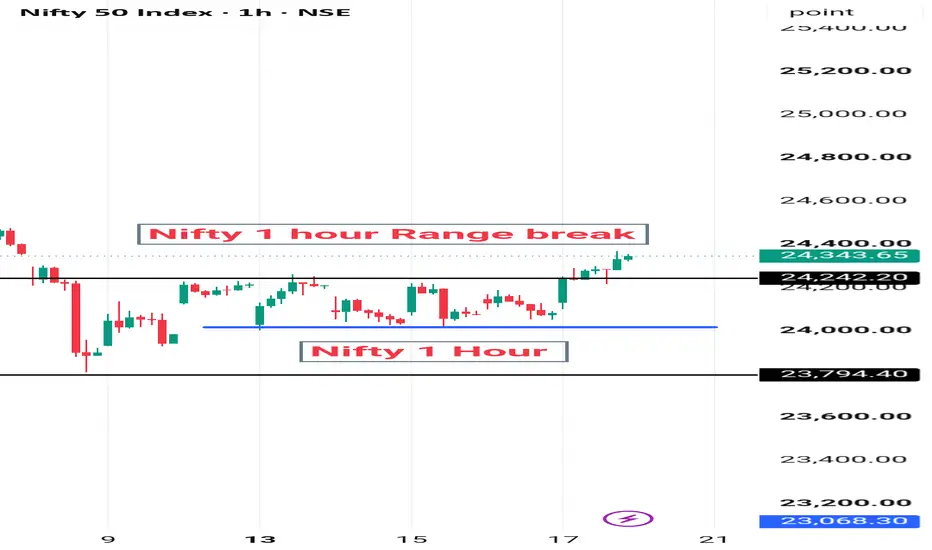
nift50 50 long breakout above 24410Today did not find any script to trade though kept eyes on TVS, which i will post later, but i traded nifty 50 option today, now as per chart in daily above 24410 , bullism momentum will build till 24900, so once 24410 is breached one can buy index etf or nifty index itselg, option i would advice to buy monthy in the money of next month.
now, today nifty breached two OB at 20190 24225 than 24260 to 24294 and cleared the liquidiy above at 24310, as of now wait for it to close above 24410 in hourly chart than can take position for next month expiy with sl at 24290, if get a time will make a video of the same explaining the same
$HYPE down 24% from our Short Entry level... What Next?I Warned About This XETR:HYPE Dump Before It Happened: Down 24% Exactly As Expected
On June 2, I highlighted the $750-$90 zone as a major resistance for XETR:HYPE and warned that a rejection there could lead to a pullback.
Since then, XETR:HYPE has dropped to around $58, a decline of roughly 24% from that resistance zone.
If you followed the setup for a scalp or short swing trade, this was a good area to consider taking profits.
I'm still watching the $44-$38 zone as the next major accumulation area, but only if the overall market conditions remain supportive. Until then, patience is key.
I'll share an update if price reaches that region.
NFA & DYOR
Nifty Intraday Analysis for 17th July 2026NSE:NIFTY
Index is near 24000 support and if it could not sustain then -
The downward moment may drag the Index to 23850 – 23800 support range in downward momentum and if this support is broken then index may tank near 23600 – 23550 range.
On the contrary, The upward movement may lead to 24300 – 24350 resistance range and if the index crosses and sustains above this level then may reach near 24550 – 24600 range.
Banknifty Intraday Analysis for 17th July 2026NSE:BANKNIFTY
Index is near 57250 support and if it could not sustain then -
The downward moment may drag the Index to 56900 – 56800 support range in downward momentum and if this support is broken then the index may tank near the 56100 – 56000 range.
On the contrary, The upward moment may lead the Index to 58300 – 58400 resistance range in upward momentum and if the index crosses and sustains above this level then may reach near 59100 – 59200 range.
Finnifty Intraday Analysis for 17th July 2026NSE:CNXFINANCE
Index is near 26450 support and if it could not sustain then -
The downward moment may drag the to 26300 – 26200 support range and if this support too is broken then index may tank near 26000 – 25950 range.
On the contrary, The upward movement may lead the Index to 26800 - 26900 resistance range and if the index crosses and sustains above this level then may reach near 27100 - 27200 range.
Midnifty Intraday Analysis for 17th July 2026NSE:NIFTY_MID_SELECT
Reversal at higher level expected and uptrend will be confirmed if Index breaks and sustains above 15000 resistance.
The upward movement may lead the Index near 14950 – 14975 resistance range and if the index crosses and sustains above this level then may reach 15125 – 15150 range.
On the contrary, The downward moment may drag the index to 14650 – 14625 support range and if this support is broken then index may tank near 14475 – 14450 range.
XAUUSD/GOLD 1H SELL LIMIT PROJECTION 17.07.26XAUUSD / GOLD – 1H Sell Limit Projection
Gold is currently trading near the 3993–3994 resistance zone. This area is important because it aligns with Resistance R1, the descending trendline, and a recently formed Evening Star bearish reversal pattern.
The setup suggests waiting for price to retest the 3993.5–3994.4 sell zone before considering a sell position. A rejection from this area could push the market toward the lower support levels.
Sell Entry Zone: 3993.5–3994.4
Stop Loss: 4002.7, above Resistance R2
Targets:
TP1: 3985.0 – Support S1
TP2: 3979.0 – Support S2
TP3: 3969.1 – Support S3
The bearish setup remains valid while price stays below 4002.7. An hourly candle closing strongly above this level could invalidate the sell projection. Traders should wait for bearish rejection or confirmation before entering and follow proper risk management.
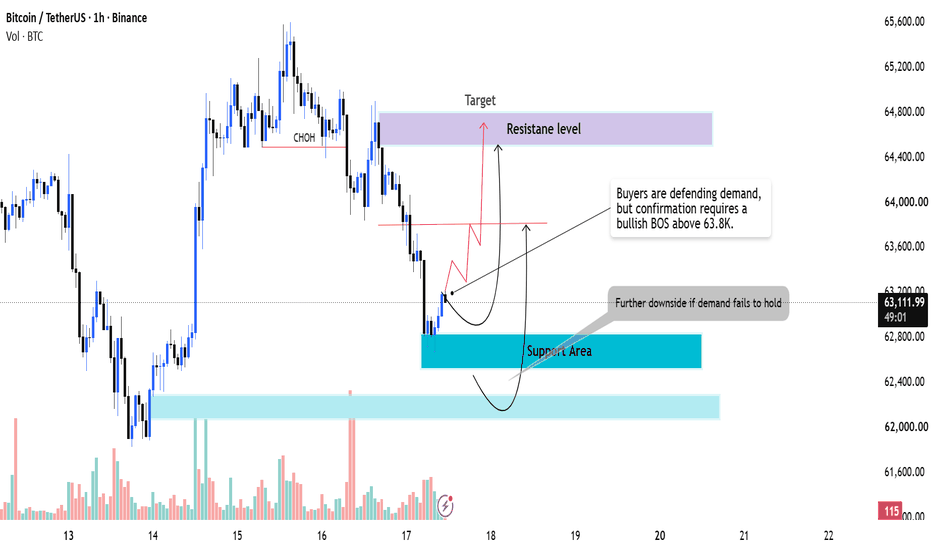
BTCUSDT Demand Bounce Toward ResistanceBTCUSDT is currently reacting from a well-defined 1H demand zone after an impulsive bearish move. The decline created a clear Change of Character (CHoCH) to the downside, keeping the short-term market structure bearish. However, buyers have stepped in at support, suggesting a relief rally could develop before the next directional move.
From an SMC perspective, the recent sell-off likely swept liquidity below short-term lows and left an imbalance that price may attempt to rebalance. As long as the demand zone around 62.6K–62.8K holds, BTC has room to retrace toward the 63.8K resistance and potentially test the higher supply zone at 64.5K–64.8K.
A bullish confirmation would require a Break of Structure (BOS) above the recent lower high. Failure to hold the current demand zone would invalidate the recovery scenario and increase the probability of a continuation toward the 62.0K higher-timeframe support.
Key Levels
Support: 62.6K–62.8K
Major Support: 62.0K–62.2K
Resistance: 63.8K
Target Supply: 64.5K–64.8K
Bias: Short-term bullish retracement while above demand; overall trend remains cautious until buyers reclaim 63.8K.