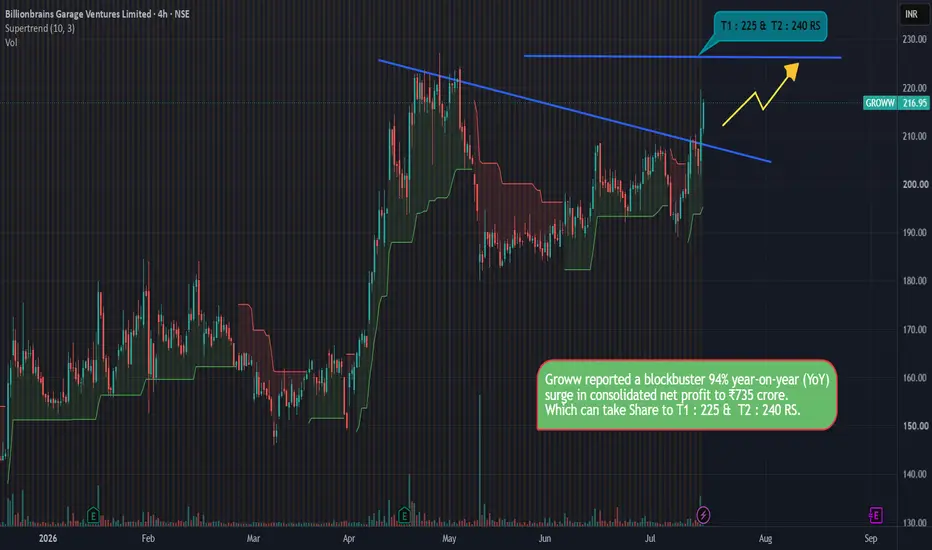
Long
Long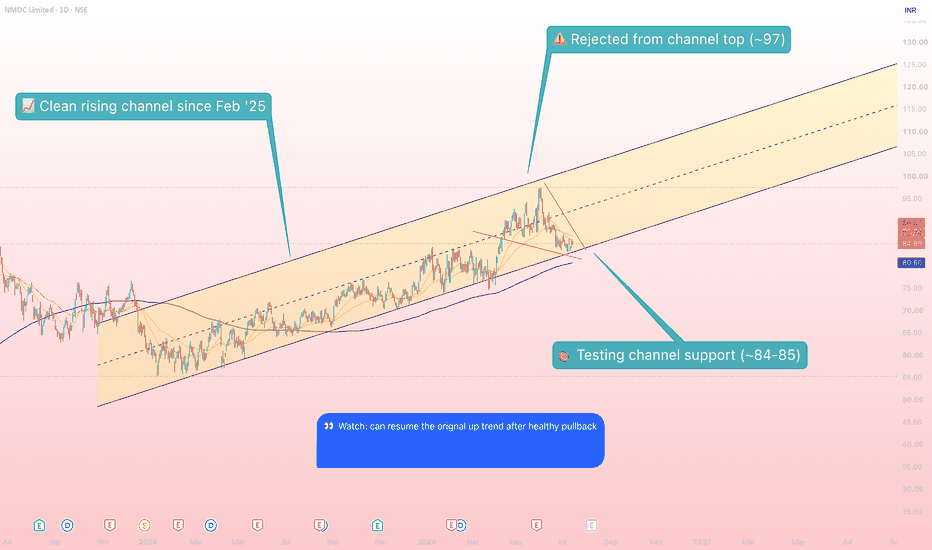
 Long
Long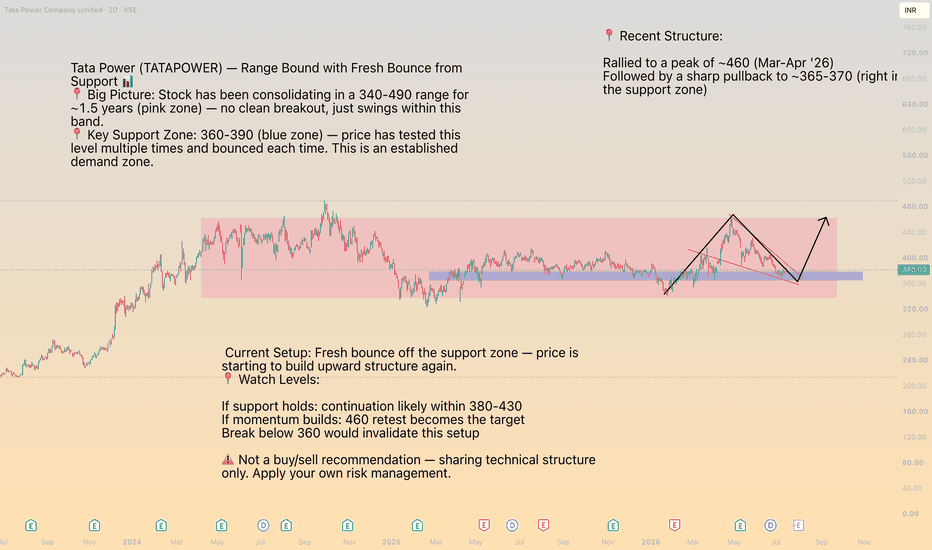
The Secret Sideways Markets : Patterns Hiding Inside PatternsThe Broader Range
Marked by the red horizontal line at the top and the green horizontal line at the bottom is the overall sideways range this stock traded within for an extended period. On the surface, this looks like a simple range, price contained between a ceiling and a floor with nothing more to it.
The Descending Triangle Hidden Within
The pink diagonal line, combined with the same red horizontal line at the top and the green horizontal line at the bottom, forms a descending triangle in its own right. A descending triangle is defined by a flat base and a series of lower highs pressing down toward it, and here that entire structure exists nested inside the larger sideways range
The Wedge Pattern Hidden Within
Later in the same broader range, a different structure quietly forms. The 50 EMA acts as a rising support base, and the yellow lines above it, combined once again with the same red horizontal line at the top, create a wedge pattern.
The Bigger Observation
One broad sideways range. Two completely different patterns forming within it at different points in time, a descending triangle first, and a wedge later, both sharing the same upper resistance line as an anchor. This is the quiet secret most people miss when they label a market simply as sideways. Inside that range, structure is still forming, patterns are still being built, and the market never truly sits idle
Disclaimer: This post is purely educational and observational in nature based on historical price action on a monthly timeframe. It does not constitute financial advice, a forecast, or a recommendation to buy, sell, or hold any security.
 Long
Long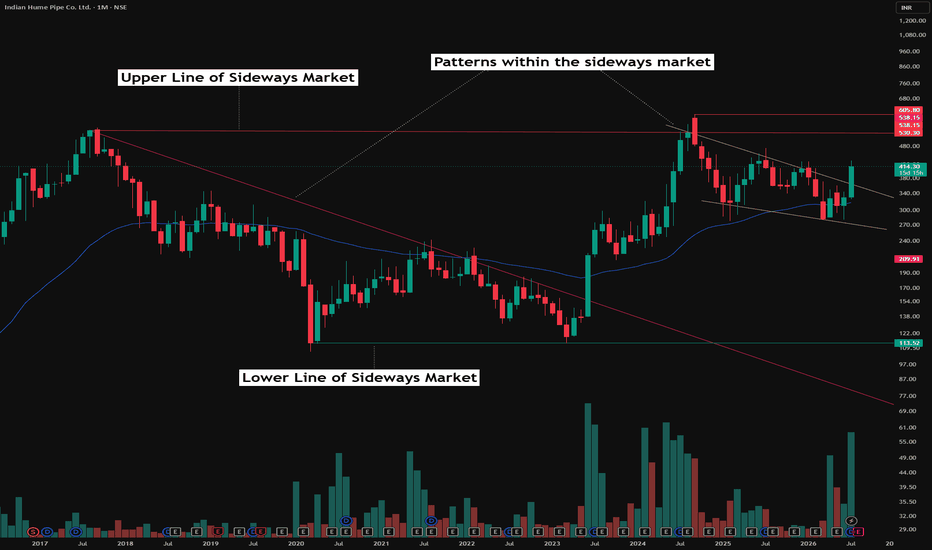
Dixon Technologies – Short-Term Trading PlanDixon Technologies – CMP: ₹13,651 | Timeframe: Weekly (Execution: Daily)
📌 Trading Strategy
✅ Existing Long Positions
Continue to hold while price remains above ₹13,000 .
Trail stop-loss higher as the stock advances.
✅ Fresh Entry
Prefer buying:
On a pullback towards ₹13,200–13,300, or
On a decisive breakout above ₹14,000 with strong volumes.
🎯 Targets
Target 1: ₹14,800
Target 2: ₹16,300
Target 3: ₹18,500 (only if momentum remains strong)
🛑 Stop Loss
Closing below ₹12,800 would weaken the short-term bullish structure.
A break below ₹12,200 would invalidate the current impulsive wave count and increase the probability of a larger correction.
Trading Bias: BUY ON DIPS
📌 Thanks a ton for checking out my idea! Hope it sparked some value for you.
🙏 Follow for more insights
👍 Boost if you found it helpful
✍️ Drop a comment with your thoughts below!
 Long
Long
 Long
Long
Trend Evolution: Eternal LimitedFollowing a sustained corrective phase initiated post-February 26, Eternal Limited transitioned into a multi-month sideways accumulation and consolidation range starting in early April. This range-bound price action effectively absorbed selling pressure, establishing a firm structural floor.
On July 1st, the stock staged a decisive bullish breakout from this multi-month base, invalidating the medium-term bearish structure and signaling the potential initiation of a fresh markup phase.
On the daily chart, a key trend-reversal signal has been triggered. The short-term 20-day EMA has crossed above the long-term 200-day EMA precisely at the breakout horizontal resistance. This "Golden Cross" variation confirms a strong shift in market bias from neutral-bearish to structural-bullish.
Supporting this shift, the MACD line has crossed into positive territory, accompanied by a bullish expansion in the histogram. This indicates a significant acceleration in buying velocity.
The RSI has climbed above the 70 threshold, entering the overbought territory. In the early stages of a structural breakout, an overbought RSI often reflects intense momentum rather than an immediate exhaustion point.
Primary Resistance Target: 352 with Stop-Loss: Below 260
Disclaimer: This technical analysis is compiled strictly for educational and informational purposes and does not constitute personalized investment advice, a financial recommendation, or an endorsement to buy or sell securities. Financial markets carry inherent risks, and past performance of technical indicators is not indicative of future results. Always conduct independent due diligence or consult with a certified financial advisor before executing trades.  Long
Long
 Short
Short
NEOGEN CHEMICALS – Multi-Timeframe Bullish Breakout in ProgressNeogen Chemicals; CMP: 2033.70; RSI: 86.41
Neogen Chemicals continues to exhibit a strong bullish structure on the daily chart, having successfully reversed from the ₹966 zone and now trading near its 1D Pivot High (₹1,960). After a prolonged consolidation and correction phase , the stock has successfully taken support at its long-term rising trendline and has started a fresh upward momentum move .
🔹 What Makes the Setup Interesting?
✅ Strong rebound from the lower boundary of a multi-year (6Yeras) rising channel.
✅ Long-term trendline support around ₹1,000–1,200 has held firmly.
✅ Price has resumed its journey towards the upper channel resistance after a successful retest.
✅ Daily chart indicates a Wave-3 Elliott Wave Expansion, typically the strongest phase of a bullish cycle.
✅ Momentum indicators are turning higher, confirming renewed buying interest.
🎯 Potential Upside Targets
₹2,170 – Near-term target (2.0 Fibonacci Extension)
₹2,315 – Intermediate target (2.2 Fibonacci Extension)
₹2,420–2,500 – Positional target over the next few months
A sustained breakout above ₹2,500 could open the path towards the upper channel zone near ₹3,000+
🛡️ Risk Management
Immediate support: ₹1,950 -1960
Strong support zone: ₹1,600–1,550
Positional stop loss: Below ₹1,510 on closing basis;
💡 Trading View
As long as Neogen sustains above the ₹1,950–1,960 breakout zone, every dip can be viewed as a buying opportunity. The stock appears to be entering the strongest phase of its Elliott Wave cycle, where price acceleration is typically witnessed.
⚡ "Wave-3 is often the longest and strongest wave. Neogen seems to be positioning itself for exactly that move."
📌 Thanks a ton for checking out my idea! Hope it sparked some value for you.
🙏 Follow for more insights
👍 Boost if you found it helpful
✍️ Drop a comment with your thoughts below!  Long
Long
SENSEX Trade Plan [16.07.2026: Thursday]Probable Scenario Analysis and Trade Plan for the SENSEX BSE:SENSEX for the 16th of July, 2026. The day is Thursday.
🟢 Bullish Scenario
There is no bullish setup observable in the present price action. Doubt every upmove. However, if the price sustains above 77750, then the probable bullish targets would be - 78000, 78250, and 78500.
🔴 Bearish Scenario
Presently, the price is in the bearish zone. If the price remains below 77250, then find bearish opportunities. The probable bearish targets below 77250 would be - 77000, 76750, 76500, and 76250.
🟡 No Trading Zone (NTZ): (77750 - 77250).
⏺ Range of Consolidation (ROC): (77750 - 77000).
Here, 77375 is the median of the ROC. The median works like an intraday sentiment evaluator. The price trading above the median would offer bullish sentiment, while the price trading below the median would trigger bearish sentiment within the ROC.
● Event
No high-impact event this week. No holidays this week. There is SENSEX weekly expiry. Lastly, geopolitical issues are omnipresent.
● Intraday Bias
Establish intraday bias with respect to the opening price. If the price sustains above the opening price, then don't think of shorting. Look for bullish trades only. On the contrary, if the price sustains below the opening price, then don't think of going long. Look for bearish trades in that case.
● Disclaimer + End Note
- All the analyses would fail in the case of a major gap up, gap down, or price structure anomaly. Thus, practice PRAGMATISM in the live session.
- Trade only if there is a set-up. Remember, not trading is an extension of the trading activity.
- Mark your points. Trade your points. Price is GOD. Anything can happen in the markets. Thus, trade what you see, not what you believe.
- Always PRACTICE RISK MANAGEMENT. Always PROTECT YOUR CAPITAL. Be RESPONSIBLE.
- Be Strategic. Be Courageous. Be Patient. Be Wise.
- Every day is a new day. Thus, do not carry the baggage of past successes or failures. Leave the gardens of winning and losing. Establish yourself in equanimity. Always think from a new perspective.
- Let the joy of trading drive your effectiveness, not greed or fear. Believe in Possibilities.
Happy Trading! RAIN Industries: Long Setup Moves ONThe stock of RAIN Industries has recently tested and moved beyond a key resistance level near ₹184. Following this move, price action suggests that the former resistance is now being observed as a potential support zone, a common technical development when a breakout sustains.
The level around ₹184, which previously acted as resistance, is now being monitored as a support area, indicating acceptance of higher price levels by the market.
Such transitions often reflect strengthening price structure when accompanied by confirmation signals.
Momentum indicators, including the RSI remain constructive, suggesting continued bullish bias without immediate signs of exhaustion. Recent strong Q1 performance has acted as a sentiment catalyst, complementing the technical setup and reinforcing the broader trend outlook.
Support Zone: Around ₹184 (previous resistance turned support)
Next Resistance Zone: Near ₹218 , based on historical price interaction and extension levels
Disclaimer: This analysis is provided for educational and informational purposes only. It does not constitute investment advice or a recommendation to buy, sell, or hold any security. Market participants should conduct independent research and consult a licensed financial professional before making investment decisions.  Long
Long
 Short
Short
 Long
Long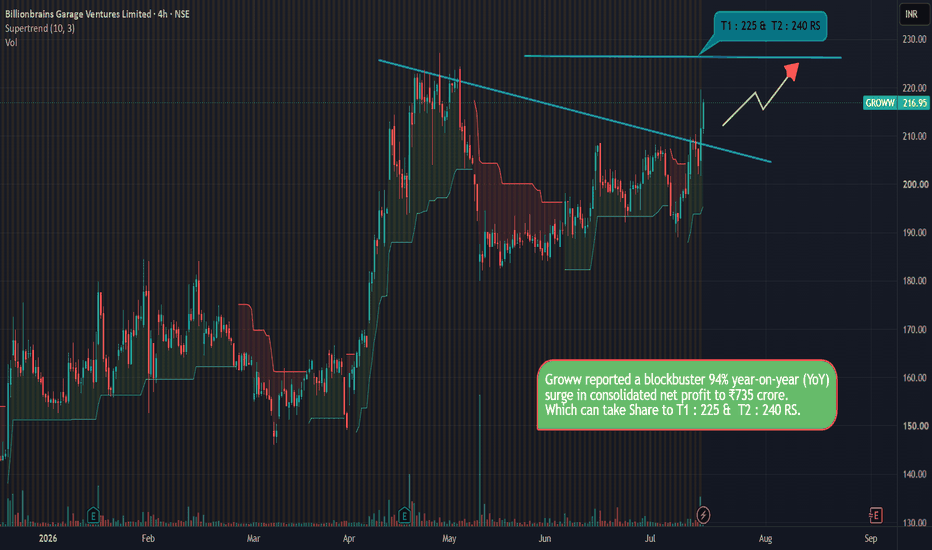
Nifty 50 Trade Plan [16.07.2026: Thursday]Probable Scenario Analysis and Trade Plan for the Nifty 50 Index NSE:NIFTY for the 16th of July, 2026. The day is Thursday.
🟢 Bullish Scenario
There is no bullish setup observable in the present price action. Doubt every upmove. However, if the price sustains above 24250, then the probable bullish targets would be - 24300, 24350, and 24400.
🔴 Bearish Scenario
Presently, the price is in the bearish zone. If the price remains below 24100, then find bearish opportunities. The probable bearish targets below 24100 would be - 24050, 24000, 23950, 23900, 23850, and 23800.
🟡 No Trading Zone (NTZ): (24250 - 24100).
⏺ Range of Consolidation (ROC): (24250 - 24000).
Here, 24125 is the median of the ROC. The median works like an intraday sentiment evaluator. The price trading above the median would offer bullish sentiment, while the price trading below the median would trigger bearish sentiment within the ROC.
● Event
No high-impact event this week. No holidays this week. There is a SENSEX weekly expiry. Lastly, geopolitical issues are omnipresent.
● Intraday Bias
Establish intraday bias with respect to the opening price. If the price sustains above the opening price, then don't think of shorting. Look for bullish trades only. On the contrary, if the price sustains below the opening price, then don't think of going long. Look for bearish trades in that case.
● Disclaimer + End Note
- All the analyses would fail in the case of a major gap up, gap down, or price structure anomaly. Thus, practice PRAGMATISM in the live session.
- Trade only if there is a set-up. Remember, not trading is an extension of the trading activity.
- Mark your points. Trade your points. Price is GOD. Anything can happen in the markets. Thus, trade what you see, not what you believe.
- Always PRACTICE RISK MANAGEMENT. Always PROTECT YOUR CAPITAL. Be RESPONSIBLE.
- Be Strategic. Be Courageous. Be Patient. Be Wise.
- Every day is a new day. Thus, do not carry the baggage of past successes or failures. Leave the gardens of winning and losing. Establish yourself in equanimity. Always think from a new perspective.
- Let the joy of trading drive your effectiveness, not greed or fear. Believe in Possibilities.
Happy Trading!  Long
Long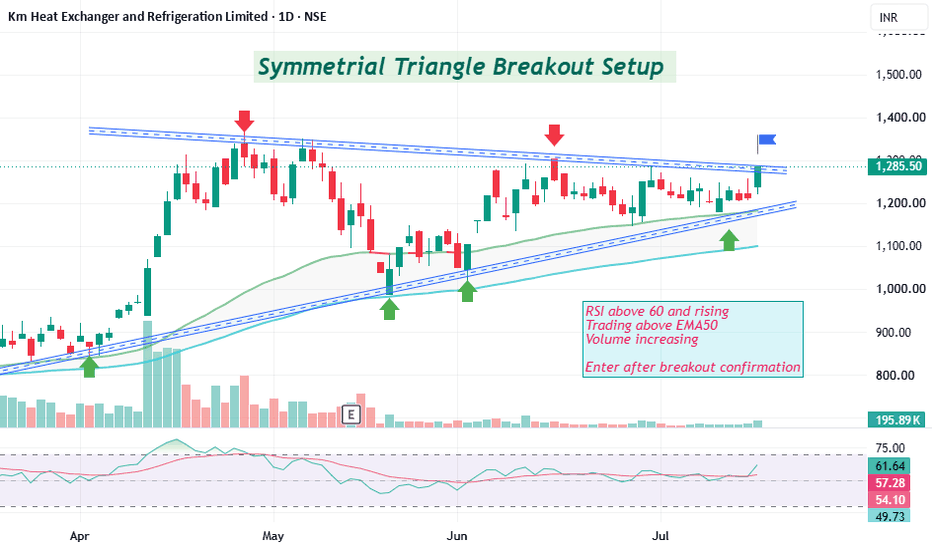
NIFTY DAILY / Short Range Level Analysis for 16th Jul 2026🔕 SGMN SplD BULLISH Above => 24153.
🔕 SGMN SplD Bearish BELOW => 24007.
Mentioned analysis based on 2 consecutive candle close in 15 min Time Frame.
━━━━━🟥🟧🟨🟩🟦🟪⬛━━━━━
💥Level Interpretation / description:
✍🏻L#1: If the candle crossed & stays above the “Buy Gen”, it is treated / considered as Bullish bias. Cfm=> Confirmation.
L#2: Possibility / Probability of REVERSAL near 🔕RL/TF1 & 🔔RL/TF2
L#3: If the candle stays above “Sell Gen” but below “Buy Gen”, it is treated / considered as Sidewise. Aggressive Traders can take Long position near “Sell Gen” either retesting or crossed from Below & vice-versa i.e. can take Short position near “Buy Gen” either retesting or crossed downward from Above.
L#4: If the candle crossed & stays below the “Sell Gen”, it is treated / considered a Bearish bias.
L#5: Possibility / Probability of REVERSAL near 🔕RL/TF1 & 🔔RL/TF2
HZB (Buy side) & HZS (Sell side) => Hurdle Zone,
✍🏻 *** Specialty of “HZB#1, HZB#2 HZS#1 & HZS#2” is Sidewise (behaviour in Nature)
Rest Plotted and Mentioned on Chart
Color code Used:
Green, BLUE =. Positive bias.
Safron, RED =. Negative bias.
RED in Between Green means Trend Finder / Momentum Change
/ CYCLE Change and Vice Versa.
Notice One thing: HOW LEVELS are Working.
Use any Momentum Indicator / Oscillator or as you "USED to" to Take entry.
━━━━━🟥🟧🟨🟩🟦🟪⬛━━━━━
⚠️ DISCLAIMER:
The information, views, and ideas shared here are purely for educational and informational purposes only. They are not intended as investment advice or a recommendation to buy, sell, or hold any financial instruments. I am not a SEBI-registered financial adviser.
Trading and investing in the stock market involves risk, and you should do your own research and analysis. You are solely responsible for any decisions made based on this research.
"🔔As HARD EARNED MONEY IS YOUR's, So DECISION SHOULD HAVE TO BE YOUR's".
━━━━━🟥🟧🟨🟩🟦🟪⬛━━━━━
❇️ Follow notification about periodical View
💥 Do Comment for Stock WEEKLY Level Analysis.🚀
📊 Do you agree with this view?
✈️ HIT THE PLANE ICON if this technical observation resonates with you. It will Motivate me.
━━━━━🟥🟧🟨🟩🟦🟪⬛━━━━━
💡 If You LOOKING any CHART & want for Level and ANALYZE?
Share your desired stock names in the comments below! I will try to analyze the chart Levels, patterns and share my technical view (so far my Knowledge).
If Viewers think It can identify meaningful setups. Looking forward to hearing from all of you — let's keep this discussion going and help each other make better trading decisions.
___________🔕^^^⚫⚪^🙏🏼🙏🏼🙏🏼^⚪⚫^^^🔔___________