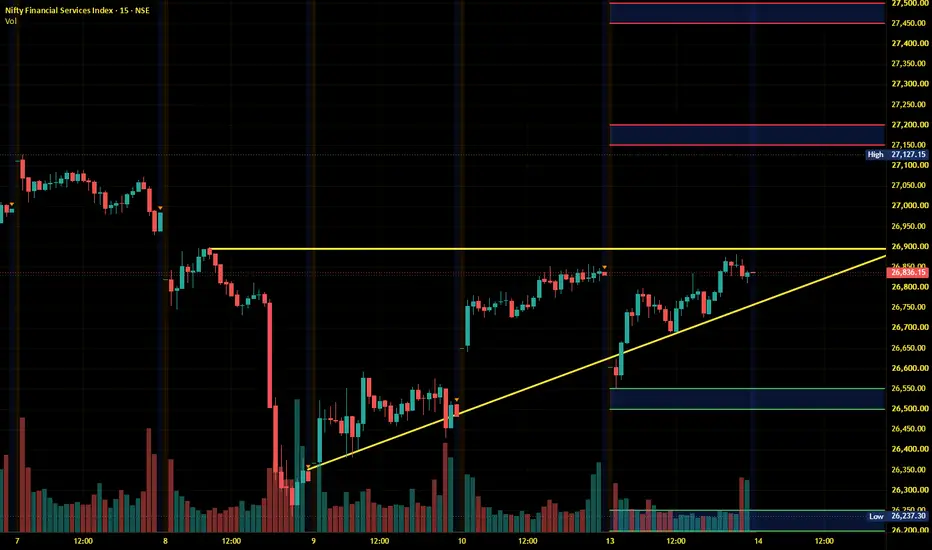
SENSEX Trade Plan [15.07.2026: Wednesday]Probable Scenario Analysis and Trade Plan for the SENSEX BSE:SENSEX for the 15th of July, 2026. The day is Wednesday.
🟢 Bullish Scenario
There is no bullish setup observable in the present price action. Doubt every upmove. However, if the price sustains above 77750, then the probable bullish target would be - 78000.
🔴 Bearish Scenario
Presently, the price is in the bearish zone. If the price remains below 77250, then find bearish opportunities. The probable bearish targets below 77250 would be - 77000, 76750, and 76500.
🟡 No Trading Zone (NTZ): (77750 - 77250).
⏺ Range of Consolidation (ROC): (77750 - 77000).
Here, 77375 is the median of the ROC. The median works like an intraday sentiment evaluator. The price trading above the median would offer bullish sentiment, while the price trading below the median would trigger bearish sentiment within the ROC.
● Event
No high-impact event this week. No holidays this week. No expiry. However, the next day (Thursday) is the SENSEX expiry. Lastly, geopolitical issues are omnipresent.
● Intraday Bias
Establish intraday bias with respect to the opening price. If the price sustains above the opening price, then don't think of shorting. Look for bullish trades only. On the contrary, if the price sustains below the opening price, then don't think of going long. Look for bearish trades in that case.
● Disclaimer + End Note
- All the analyses would fail in the case of a major gap up, gap down, or price structure anomaly. Thus, practice PRAGMATISM in the live session.
- Trade only if there is a set-up. Remember, not trading is an extension of the trading activity.
- Mark your points. Trade your points. Price is GOD. Anything can happen in the markets. Thus, trade what you see, not what you believe.
- Always PRACTICE RISK MANAGEMENT. Always PROTECT YOUR CAPITAL. Be RESPONSIBLE.
- Be Strategic. Be Courageous. Be Patient. Be Wise.
- Every day is a new day. Thus, do not carry the baggage of past successes or failures. Leave the gardens of winning and losing. Establish yourself in equanimity. Always think from a new perspective.
- Let the joy of trading drive your effectiveness, not greed or fear. Believe in Possibilities.
Happy Trading!
 Short
Short
 Short
Short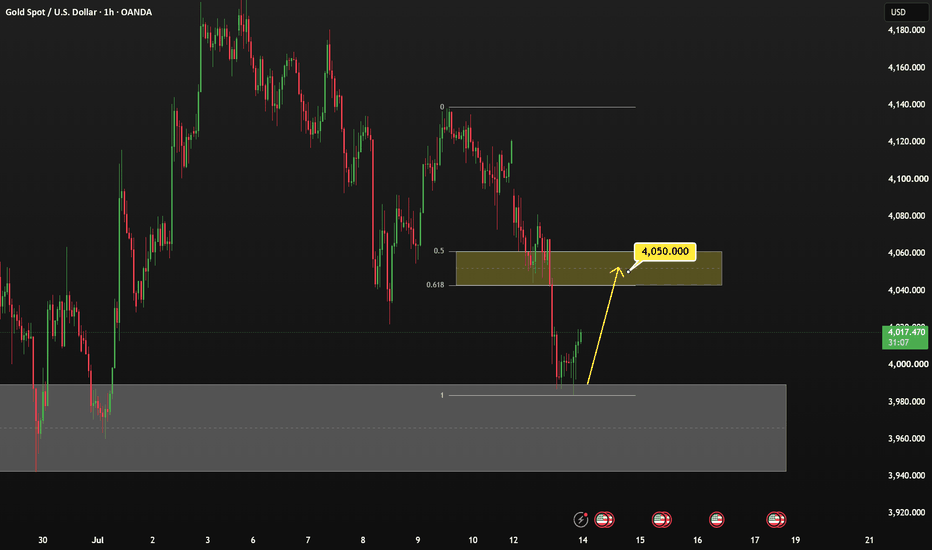
 Short
Short
Nifty 50 Trade Plan [15.07.2026: Wednesday]Probable Scenario Analysis and Trade Plan for the Nifty 50 Index NSE:NIFTY for the 15th of July, 2026. The day is Wednesday.
🟢 Bullish Scenario
There is no bullish setup observable in the present price action. Doubt every upmove. However, if the price sustains above 24300, then the probable bullish targets would be - 24350 and 24400.
🔴 Bearish Scenario
Presently, the price is in the bearish zone. If the price remains below 24100, then find bearish opportunities. The probable bearish targets below 24100 would be - 24050, 24000, 23950, 23900, 23850, and 23800.
🟡 No Trading Zone (NTZ): (24300 - 24100).
⏺ Range of Consolidation (ROC): (24300 - 24000).
Here, 24150 is the median of the ROC. The median works like an intraday sentiment evaluator. The price trading above the median would offer bullish sentiment, while the price trading below the median would trigger bearish sentiment within the ROC.
● Event
No high-impact event this week. No holidays this week. No expiry. However, the next day (Thursday) is the SENSEX expiry. Lastly, geopolitical issues are omnipresent.
● Intraday Bias
Establish intraday bias with respect to the opening price. If the price sustains above the opening price, then don't think of shorting. Look for bullish trades only. On the contrary, if the price sustains below the opening price, then don't think of going long. Look for bearish trades in that case.
● Disclaimer + End Note
- All the analyses would fail in the case of a major gap up, gap down, or price structure anomaly. Thus, practice PRAGMATISM in the live session.
- Trade only if there is a set-up. Remember, not trading is an extension of the trading activity.
- Mark your points. Trade your points. Price is GOD. Anything can happen in the markets. Thus, trade what you see, not what you believe.
- Always PRACTICE RISK MANAGEMENT. Always PROTECT YOUR CAPITAL. Be RESPONSIBLE.
- Be Strategic. Be Courageous. Be Patient. Be Wise.
- Every day is a new day. Thus, do not carry the baggage of past successes or failures. Leave the gardens of winning and losing. Establish yourself in equanimity. Always think from a new perspective.
- Let the joy of trading drive your effectiveness, not greed or fear. Believe in Possibilities.
Happy Trading! XAUUSD — FVG Filled, Retest Next?Gold has made a strong recovery from the lower liquidity area.
After reacting from the 3,998 zone, price pushed higher and is now trading around 4,080 - 4,085.
But this is where traders need to slow down.
Because gold has already filled part of the FVG area.
And the market is still moving inside a larger descending channel.
So the question is not:
“Should I buy after the pump?”
The better question is:
“Will gold hold the retest, or reject from this FVG?”
The simple read
Gold is recovering, but the bigger structure is not fully bullish yet.
Price is now testing the FVG / reaction area above 4,080.
The next resistance is 4,127.
If gold breaks and holds above the FVG area, buyers may try to push price toward 4,127.
But if gold rejects from this area, a pullback toward 4,025 may appear first.
That 4,025 zone is important because it is the OB buy zone on the chart.
Below that, 3,998 remains the liquidity buy zone.
Key price zones
Current price area: 4,080 - 4,085
FVG reaction area: 4,095 - 4,110
Main resistance: 4,127
OB buy zone: 4,025
Liquidity buy zone: 3,998
Bullish recovery improves above: 4,127
Trading plan
📈 Bullish continuation scenario
If gold holds above the FVG area and keeps strength:
Buyers may try to continue toward 4,127.
A clean upside view becomes stronger only if price breaks and holds above 4,127.
Without confirmation, I do not want to chase the current candle.
📉 Retest scenario
If gold rejects from 4,095 - 4,110:
Price may pull back toward 4,025.
This would not automatically destroy the recovery.
It may simply be the market retesting the OB buy zone before the next decision.
A clear reaction from 4,025 could support another recovery attempt.
📉 Deeper support scenario
If 4,025 fails clearly:
Gold may revisit the 3,998 liquidity buy zone.
If buyers defend 3,998, the market can still create a reaction.
If 3,998 breaks, the descending channel remains in control and the chart needs more time.
Tiara’s View
A strong candle can look exciting.
But the clean trade is usually not after the move.
It is at the retest.
For today, I am watching two things:
Can gold hold the FVG and continue toward 4,127?
Or will price pull back first into 4,025?
Main view:
Gold is recovering, but still inside the descending channel.
4,127 is the resistance target.
4,025 is the key retest zone.
3,998 is the deeper liquidity support.
Reaction first.
Confirmation second.
Trade last.
No confirmation = no trade.
Do you think gold will continue toward 4,127, or retest 4,025 first? Short 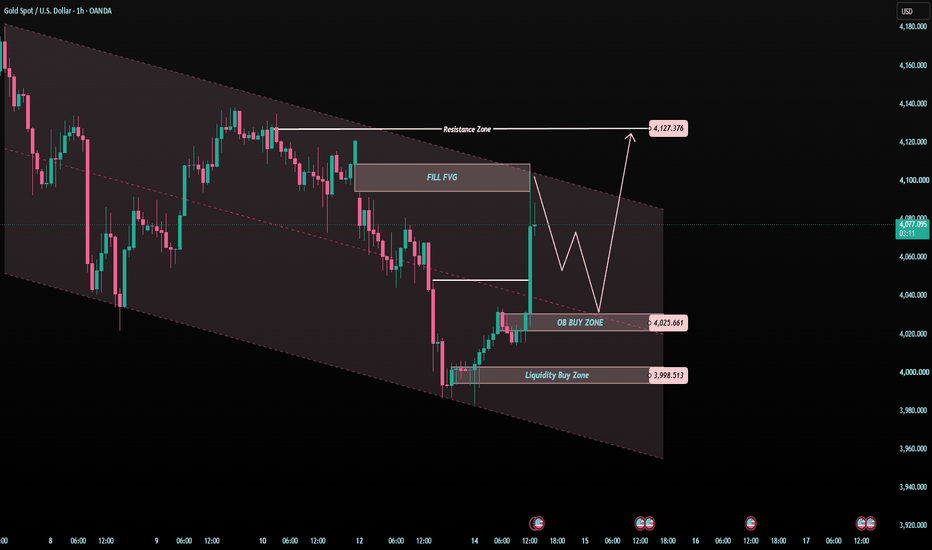
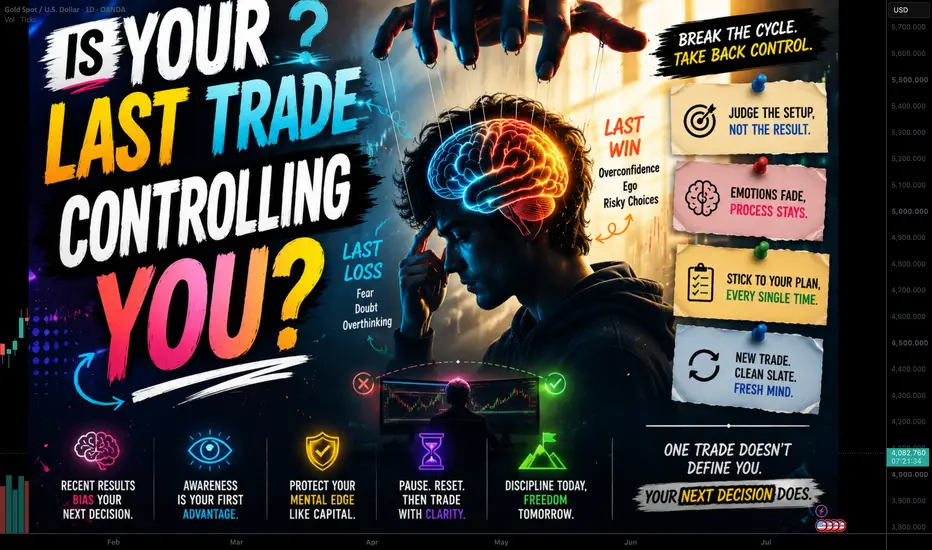
Is Your Last Trade Controlling You?You close a trade, but sometimes the trade doesn't really leave you.
A big loss can make the next setup feel more dangerous than it actually is. A strong win can make an average setup look better than it is. Without realizing it, traders often carry the emotion of one trade directly into the next decision.
The chart may have changed. The setup may be completely different. But mentally, you may still be trading the previous trade.
1. A Loss Can Make You Too Careful
After a painful loss, hesitation feels natural. You find a valid setup, check your rules, and still struggle to enter because your mind remembers what happened last time.
The danger is simple: You are no longer judging the current setup on its own. You are using an old result to measure a new opportunity.
2. A Win Can Make You Feel Smarter Than You Are
Winning creates confidence, but sometimes that confidence quietly becomes overconfidence. After a good trade, traders may increase position size, enter faster, or ignore small warning signs.
Nothing about the next setup has improved just because your previous trade made money. The market doesn't give bonus probability for being on a winning streak.
3. Revenge Trading Isn't Always Obvious
Revenge trading isn't always aggressive clicking or doubling your position. Sometimes it's much quieter: Taking a setup you normally wouldn't take because you want to recover the previous loss.
You may call it an opportunity, but ask yourself: Would I take this exact trade if my last trade had been profitable?
4. Your Brain Loves Recent Results
Recent experiences are easy to remember, so they often feel more important than older ones. One bad trade can suddenly make you question a strategy that has worked across many trades.
This is where traders make unnecessary changes. They adjust rules, switch indicators, or abandon a plan because one recent result feels bigger than the complete picture.
5. Every Trade Needs a Fresh Decision
The next trade doesn't know whether you won or lost five minutes ago. It has its own setup, risk, and probability.
Before entering, ask: "Am I trading this setup, or am I reacting to my previous result?" That one question can expose a surprising number of emotional decisions.
6. Create Space Between Trades
You don't always need to immediately search for the next opportunity. After closing a position, give yourself enough time to mentally finish that trade.
Record the result, note any mistake, and move on. The purpose isn't to forget the trade: It's to stop carrying its emotion into the next one.
7. Judge the Process, Not the Previous Outcome
A good trade can lose, and a terrible trade can make money. If you allow the previous result to control your confidence, your decision-making will constantly move between fear and overconfidence.
Judge your next trade by your rules. Your last P&L should not decide the quality of your next setup.
Conclusion:
Many traders think they're reacting to the current market when they're actually reacting to their previous trade. A loss creates fear. A win creates confidence. Both can distort the next decision when left unchecked.
Your last trade should give you information, not instructions.
Remember: Close the position, review the decision, and leave the emotion behind. The next trade deserves a fresh mind. Education 
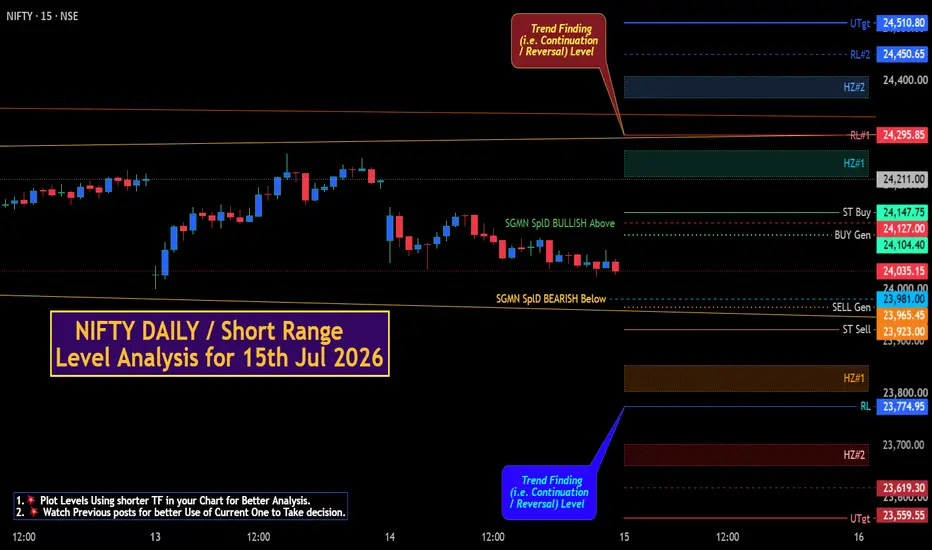
NIFTY DAILY / Short Range Level Analysis for 15th Jul 2026.NIFTY DAILY / Short Range Level Analysis for 15th Jul 2026.
🔕 SGMN SplD BULLISH Above => 24127.
🔕 SGMN SplD Bearish BELOW => 23981.
Mentioned analysis based on 2 consecutive candle close in 15 min Time Frame.
━━━━━🟥🟧🟨🟩🟦🟪⬛━━━━━
💥Level Interpretation / description:
✍🏻L#1: If the candle crossed & stays above the “Buy Gen”, it is treated / considered as Bullish bias. Cfm=> Confirmation.
L#2: Possibility / Probability of REVERSAL near 🔕RL/TF1 & 🔔RL/TF2
L#3: If the candle stays above “Sell Gen” but below “Buy Gen”, it is treated / considered as Sidewise. Aggressive Traders can take Long position near “Sell Gen” either retesting or crossed from Below & vice-versa i.e. can take Short position near “Buy Gen” either retesting or crossed downward from Above.
L#4: If the candle crossed & stays below the “Sell Gen”, it is treated / considered a Bearish bias.
L#5: Possibility / Probability of REVERSAL near 🔕RL/TF1 & 🔔RL/TF2
HZB (Buy side) & HZS (Sell side) => Hurdle Zone,
✍🏻 *** Specialty of “HZB#1, HZB#2 HZS#1 & HZS#2” is Sidewise (behaviour in Nature)
Rest Plotted and Mentioned on Chart
Color code Used:
Green, BLUE =. Positive bias.
Safron, RED =. Negative bias.
RED in Between Green means Trend Finder / Momentum Change
/ CYCLE Change and Vice Versa.
Notice One thing: HOW LEVELS are Working.
Use any Momentum Indicator / Oscillator or as you "USED to" to Take entry.
━━━━━🟥🟧🟨🟩🟦🟪⬛━━━━━
⚠️ DISCLAIMER:
The information, views, and ideas shared here are purely for educational and informational purposes only. They are not intended as investment advice or a recommendation to buy, sell, or hold any financial instruments. I am not a SEBI-registered financial adviser.
Trading and investing in the stock market involves risk, and you should do your own research and analysis. You are solely responsible for any decisions made based on this research.
"🔔As HARD EARNED MONEY IS YOUR's, So DECISION SHOULD HAVE TO BE YOUR's".
━━━━━🟥🟧🟨🟩🟦🟪⬛━━━━━
❇️ Follow notification about periodical View
💥 Do Comment for Stock WEEKLY Level Analysis.🚀
📊 Do you agree with this view?
✈️ HIT THE PLANE ICON if this technical observation resonates with you. It will Motivate me.
━━━━━🟥🟧🟨🟩🟦🟪⬛━━━━━
💡 If You LOOKING any CHART & want for Level and ANALYZE?
Share your desired stock names in the comments below! I will try to analyze the chart Levels, patterns and share my technical view (so far my Knowledge).
If Viewers think It can identify meaningful setups. Looking forward to hearing from all of you — let's keep this discussion going and help each other make better trading decisions.
___________🔕^^^⚫⚪^🙏🏼🙏🏼🙏🏼^⚪⚫^^^🔔___________  Long
Long
Global Financial MarketsGlobal financial markets are systems where people, companies, and governments buy and sell financial assets across the world. They help move money from those who have extra funds to those who need funds.
Main Types of Global Financial Markets:
Stock Markets – Buying and selling shares of companies (e.g., NYSE, NSE).
Bond Markets – Governments and companies borrow money by issuing bonds.
Foreign Exchange (Forex) Markets – Trading currencies like USD, EUR, INR.
Commodity Markets – Trading gold, oil, wheat, etc.
Money Markets – Short-term borrowing and lending.
Derivatives Markets – Contracts based on assets like stocks or currencies.
Importance:
Provide funds for business growth
Support international trade
Create investment opportunities
Help manage financial risks
Affect global economies
Example:
If the US stock market falls sharply, markets in Asia and Europe may also be affected because markets are connected globally.  Education
 Education

 Education