IOC Trendline Support Holds, Valuation Backs the Technical StoryOverview
Indian Oil Corporation is holding right at a confluence of technical support on the weekly chart, while also trading at valuations that stand out favorably against its refining peers. This is a good example of technical and fundamental pictures lining up — worth examining both together.
Technical Structure
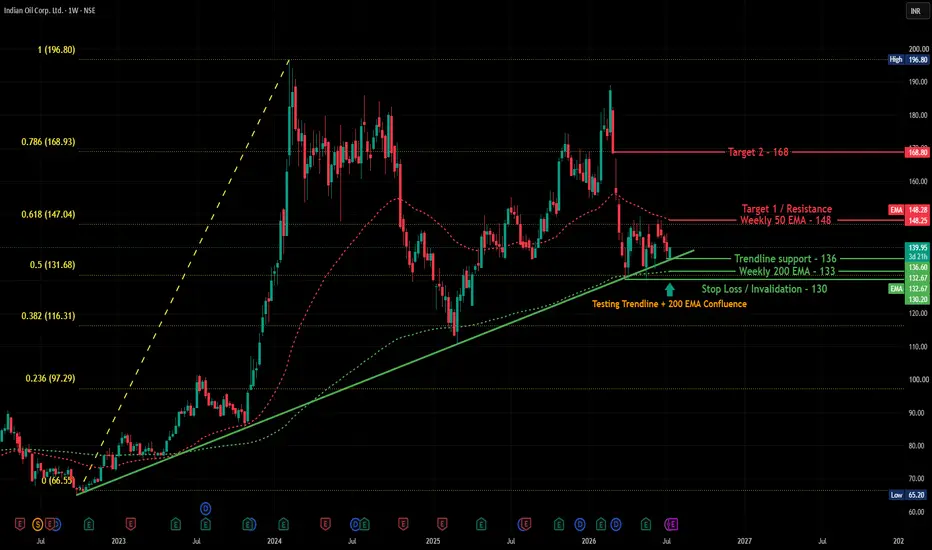
On the weekly chart, IOC is trading at 139.95 (+0.71%), sitting right on a rising trendline support (~136) that has held since the 2022 lows, with the Weekly 200 EMA (132.67) just below it, adding confluence. The Weekly 50 EMA (148.25) sits just above as the immediate resistance to watch. Price also remains inside the broader retracement structure from the 2022 low (65.20) to the 2024 high (196.80), currently hovering near the 0.5 Fibonacci level (131.68).
Trade Setup
Entry: Above 140–142 on a sustained move, using the trendline/200 EMA confluence as the base
Stop Loss (Invalidation): Below 130 (just under the Weekly 200 EMA/trendline confluence zone)
Target 1: 148 (Weekly 50 EMA)
Target 2: 168.80 (0.786 Fibonacci level)
Fundamentals — Why This Matters for Long-Term Investors
Valuation: Trading at a P/E of 4.69, well below peers like Reliance (22.52) and MRPL (15.01) — among the cheapest in the sector
Dividend: Strong dividend yield of 5.00%, with a healthy long-term payout history
Profitability: ROE of 20.74% and ROCE of 18.78%, notably ahead of Reliance (ROE 8.91%) and competitive with BPCL/HPCL
Debt: Carries meaningful debt (₹131,822 Cr), typical for capital-intensive PSU refiners but worth noting relative to peers like CPCL, which run lower debt levels
Earnings trend: FY26 net profit of ₹43,677 Cr marks a sharp recovery from FY25's ₹13,789 Cr, though the multi-year picture is volatile, reflecting sensitivity to crude prices and government fuel pricing policy
Caveat: 10-year compounded sales growth is modest, and earnings volatility here is real — this isn't a smooth-growth story, more a cyclical value-and-yield profile
Beginner's Lesson
When a stock's technical support level aligns with an attractive valuation (like a low P/E relative to peers), it can add conviction to a setup — the chart shows where buyers have historically stepped in, while the fundamentals help explain why. That said, PSU oil marketing companies are heavily influenced by government fuel pricing policy and crude oil price cycles, which can override both charts and valuation in the short term — worth keeping in mind before treating this as a purely technical or purely fundamental call.
Conclusion
IOC presents a case where technical support and reasonable valuation are lining up together. As always, confirm with price action before acting on the technical setup, and consider your own investment horizon and risk tolerance if evaluating this from a fundamentals perspective.
Fundamental data sourced from Screener.in. Not investment advice. For educational purposes only. Please consult your financial advisor before making any investment or trading decisions.
 Long
Long
NIFTY 50: Consolidation Continues, Premium Selling FavouredNifty is currently trading inside a well-defined consolidation range after a sharp recovery. Price is respecting both demand and supply zones, indicating a lack of directional conviction.
🟧 Resistance Zone: 24,380 – 24,600
This remains the immediate supply area.
A daily close above 24,600 could trigger fresh buying towards 24,850–25,000.
🟩 Support Zone: 23,550 – 23,800
Buyers have repeatedly defended this zone.
If this level breaks on a closing basis, the next downside support comes near 23,300, followed by 23,000.
Current View
Price is moving inside a 23,800–24,500 consolidation box. Until either side is decisively broken, expect choppy price action with frequent reversals.
Trading Idea
✔️ Option sellers have the edge while the index remains inside this range.
Consider Iron Condor or Short Strangle with proper hedging.
Avoid aggressive directional positions until a confirmed breakout or breakdown occurs.
Key Levels
Bullish above: 24,600
Bearish below: 23,770
Range: 23,800–24,500
Bias: Neutral → Range-bound until price confirms a breakout. NIFTY ANALYSIS | TUESDAY, 14 JULY 2026 | 4H →1H →15-MIN→5-MIN TF# 📊 NIFTY ANALYSIS | TUESDAY, 14 JULY 2026 | 4H → 1H → 15-MIN → 5-MIN 🔥
The close was **24,211.00**. NIFTY spent most of the session climbing steadily before meeting supply near **24,260** and finishing almost unchanged. The broader bullish structure remains intact, but the market is still waiting for institutions to commit above resistance. Until then, expect breakouts to demand confirmation rather than blind optimism. Markets, much like office printers, only behave when someone important is watching.
---
# 🚨 FINAL VERDICT
## Market Bias
🟢 **Bullish above 24,260**
🟡 **Range-bound between 24,091 and 24,260**
🔴 **Bearish below 24,000 on sustained acceptance**
NIFTY closed at **24,211.00**, gaining **4.10 points (+0.02%)**. Buyers defended the psychological **24,000** region for another session, while repeated rejection near **24,260** confirms that supply is still active overhead.
---
## Institutional Summary
* **Market Regime:** 🟡 Bullish Consolidation
* **Control:** 🟢 Buyers while above **24,091**
* **Previous Session OHLC**
* **Open:** 24,039.40
* **High:** 24,259.80
* **Low:** 24,000.20
* **Close:** 24,211.00
* **Immediate Resistance:** **24,260**, **24,300**, **24,360**, **24,430**
* **Immediate Support:** **24,180**, **24,120**, **24,091**, **24,000**
* **Trader Action:** Wait for a confirmed breakout above **24,260** or a confirmed breakdown below **24,000**. The middle of the range exists largely to finance brokers' vacations.
---
## Probability Matrix
* 🟢 **Bullish:** **45%**
* 🟡 **Range Bound:** **35%**
* 🔴 **Bearish:** **20%**
━━━━━━━━━━━━━━━━━━
# 🟢 HIGH-PROBABILITY CE TRADE
## CE Setup: Breakout Above Supply
**Probability:** **45%**
### Strategy
Buy CE only after price proves it can sustain above resistance.
* **Entry Trigger:** 15-minute close above **24,260**
* **Confirmation:** 5-minute retest holds above **24,245**
* **Stop Loss:** **24,180**
* **Target 1:** **24,300**
* **Target 2:** **24,360**
* **Target 3:** **24,430**
* **Invalidation:** 15-minute close below **24,180**
### Fibonacci Confluence (13 July Intraday Range)
Using:
* High: **24,259.80**
* Low: **24,000.20**
* **23.6%:** **24,061.45**
* **38.2%:** **24,099.35**
* **50.0%:** **24,130.00**
* **61.8%:** **24,160.65**
* **78.6%:** **24,204.25**
### Institutional Logic
Price has already reclaimed the **78.6% retracement** and continues to hold above it. A decisive move above **24,260** would indicate institutions are absorbing remaining supply and could open the path toward **24,360** and **24,430**.
Do not buy CE simply because someone on social media declared "all-time high incoming." Markets rarely reward enthusiasm without evidence.
━━━━━━━━━━━━━━━━━━
# 🔴 HIGH-PROBABILITY PE TRADE
## PE Setup: Breakdown Below Psychological Support
**Probability:** **20%**
### Strategy
Buy PE only after confirmed weakness below the major support.
* **Entry Trigger:** 15-minute close below **24,000**
* **Confirmation:** Failed retest below **24,020**
* **Stop Loss:** **24,090**
* **Target 1:** **23,950**
* **Target 2:** **23,900**
* **Target 3:** **23,800**
* **Invalidation:** Sustained reclaim above **24,091**
### Confirmation Checklist
✔ Lower High Formation
✔ VWAP Rejection
✔ Volume Expansion
✔ RSI Below 45
✔ No Immediate Recovery Above 24,000
### Institutional Logic
The **24,000** level has repeatedly attracted buyers. A sustained break below it would indicate that institutional support has weakened, allowing profit booking to extend toward **23,900-23,800**.
━━━━━━━━━━━━━━━━━━
# 📐 DAILY CHART FIBONACCI LEVELS
**Swing High:** **26,354.05**
**Swing Low:** **22,184.45**
| Fibonacci Level | Price |
| ---------------- | ------------: |
| 23.6% | **22,764.45** |
| 38.2% | **23,116.65** |
| 50.0% | **23,401.35** |
| 61.8% | **23,777.25** |
| 65.0% | **23,894.70** |
| 78.6% | **24,091.30** |
| 100% | **26,354.05** |
| 161.8% Extension | **26,098.50** |
### Institutional Interpretation
NIFTY continues to trade above the crucial **78.6% Fibonacci level (24,091)**, keeping the larger bullish recovery intact. Sustaining above this level keeps buyers in control. Losing it would shift sentiment toward deeper profit booking.
━━━━━━━━━━━━━━━━━━
# 📊 OPTION CHAIN VIEW
## ATM Strike: **24,200**
### Key Option Zones
* **Call Writing Zone:** **24,300-24,400**
* **Put Writing Zone:** **24,000-24,100**
* **Maximum Activity:** **24,200**
* **Bullish Breakout:** Above **24,260**
* **Bearish Breakdown:** Below **24,000**
### Option Insight
Inside **24,091-24,260**, option premiums may continue losing value through time decay. Directional trades become attractive only after confirmed acceptance outside this range.
━━━━━━━━━━━━━━━━━━
# 📈 4H TIMEFRAME ANALYSIS
* Trend remains bullish.
* Higher-high structure intact.
* Price above 100 EMA and 200 EMA.
* Momentum positive but slowing below resistance.
**Interpretation:** Buyers still control the broader trend.
━━━━━━━━━━━━━━━━━━
# 📉 1H TIMEFRAME ANALYSIS
* Structure: Bullish Consolidation
* Resistance:
* **24,260**
* **24,300**
* **24,360**
* Support:
* **24,180**
* **24,120**
* **24,091**
Momentum remains constructive while above **24,091**.
━━━━━━━━━━━━━━━━━━
# ⏱️ 15-MINUTE TRADE FRAMEWORK
## Immediate Resistance
1. **24,260**
2. **24,300**
3. **24,360**
4. **24,430**
## Immediate Support
1. **24,180**
2. **24,120**
3. **24,091**
4. **24,000**
### Intraday Trigger Zones
🟢 Bullish Trigger:
**Above 24,260**
🔴 Bearish Trigger:
**Below 24,000**
🟡 No-Trade Zone:
**24,091-24,260**
━━━━━━━━━━━━━━━━━━
# ⚡ 5-MINUTE EXECUTION PLAN
## For CE Buyers
* Wait for a 15-minute close above **24,260**
* Enter after successful retest
* Book partial near **24,300**
* Trail toward **24,360**
* Final target **24,430**
---
## For PE Buyers
* Wait for a 15-minute breakdown below **24,000**
* Enter after failed retest
* Book partial near **23,950**
* Trail toward **23,900**
* Final target **23,800**
━━━━━━━━━━━━━━━━━━
# 🧠 MARKET PSYCHOLOGY
**Retail Behaviour:**
Many traders are likely to chase every small green candle near resistance, convinced this one is "the real breakout."
**Institutional Behaviour:**
Institutions appear comfortable accumulating above **24,091** but are not aggressively chasing prices near **24,260**. Watch where volume expands.
**Current Edge:**
🟢 Buyers remain in control above **24,091**.
━━━━━━━━━━━━━━━━━━
# 📌 TRADING DAY SCENARIOS
## Scenario 1: Bullish Breakout
**Probability:** **45%**
**Trigger:**
15-minute close above **24,260**
**Targets:**
**24,300 → 24,360 → 24,430**
---
## Scenario 2: Range Bound
**Probability:** **35%**
**Range:**
**24,091-24,260**
**Action:**
Avoid aggressive option buying. Sideways markets excel at turning confidence into theta decay.
---
## Scenario 3: Bearish Breakdown
**Probability:** **20%**
**Trigger:**
15-minute close below **24,000**
**Targets:**
**23,950 → 23,900 → 23,800**
━━━━━━━━━━━━━━━━━━
# 🚫 INVALIDATION LEVELS
**Bullish Thesis Invalid Below:**
**24,000** on sustained 15-minute acceptance.
**Bearish Thesis Invalid Above:**
**24,260** on sustained 15-minute acceptance.
━━━━━━━━━━━━━━━━━━
# 🔥 TRADER NOTE
For **14 July 2026**, the decisive range is:
## **24,091 to 24,260**
Above **24,260**, buyers may extend the rally toward **24,430**.
Below **24,000**, profit booking could accelerate toward **23,800**.
Until price escapes this range with conviction, let confirmation do the work. Predicting every candle is entertaining, but profitable trading usually begins when prediction ends and evidence starts.
*Educational analysis only. Not financial advice.*
#Nifty50 #TechnicalAnalysis #PriceAction #OptionTrading #StockMarketIndia #IntradayTrading #SwingTrading #BankNifty #Fibonacci #SupportAndResistance #Options #NSE #TradingStrategy #MarketStructure #VolumeAnalysis #SmartMoney #TechnicalCharts #MomentumTrading #IndianStockMarket #RiskManagement  Long
Long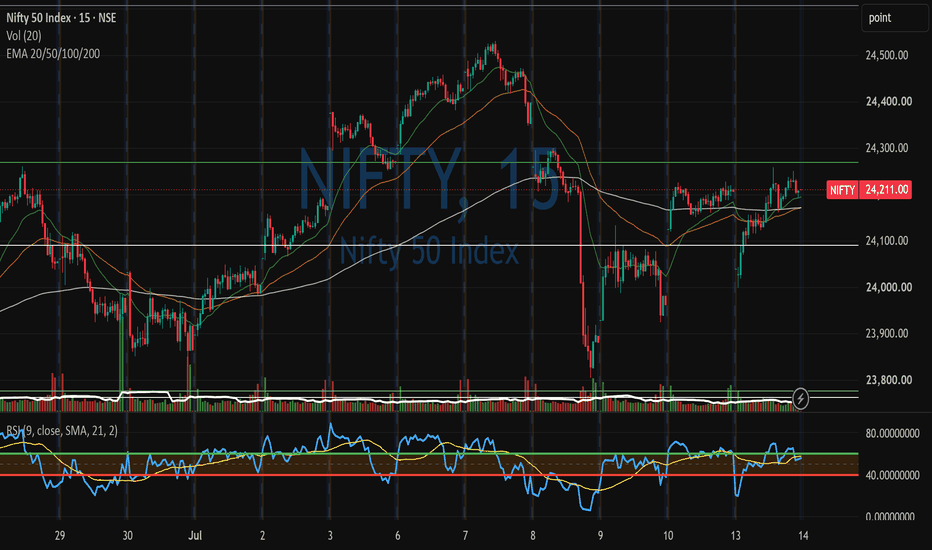
ATHERENERG: From Consolidation to Expansion- Setup: Buy-the-dip continuation in an established uptrend — pullback to higher demand/Balance confluence after a high-volume breakout to new highs (1214)
- Entry: 1140–1152 (scale in on retest of higher Balance 1139.90 / demand zone 1122.80–1152.00); aggressive alternative: momentum add on break/hold above 1214
- SL: 1115 (below the higher demand zone low of 1122.80 and below Low 1122.16, invalidating the confluence support)
- Targets: T1 = 1214 (prior day high retest), T2 = 1260 (measured extension of the current impulse leg), T3 = 1310 (trend-continuation projection if breakout momentum persists)
- ETA: 3–7 trading sessions
- Invalidation: A 4H close back below 1050 (loss of the broken-supply/demand shelf) would break the stair-step structure and signal the uptrend is exhausted
- Score: 7.5/10 — strong trend and volume confirmation, but entry is timing-dependent since price is currently extended well above both Value areas
- Narrative: ATHERENERG is in a strong, volume-confirmed uptrend that has repeatedly resolved consolidations to the upside. Today's breakout to 1214 on heavy volume extends that pattern, but chasing at 1203 offers weak risk/reward. The high-probability play is patience for a shallow pullback into the 1122–1152 higher demand/Balance shelf, which represents the most recent "line in the sand" for bulls, a hold there keeps the stair-step bullish structure intact and sets up a push toward new highs; a break below it, especially back under the broken-supply zone at 1016–1045, would be the first real sign of trend exhaustion.  Long
Long
 Long
Long
Why Your Option Trade Fails Even When Direction Is RightHow Volatility Impacts Options 📊
Many beginners think option trading is only about direction.
Market up = Buy CE
Market down = Buy PE
But options are not that simple.
Even if your direction is right, your premium may not move properly if volatility is not supporting your trade.
That is why every option trader must understand volatility.
---------------------------------------
📌 What Is Volatility?
Volatility means how fast and how much the market is moving.
High volatility means big candles, fast moves, sudden reversals, and wider ranges.
Low volatility means small candles, slow movement, narrow range, and premium decay.
In options, volatility directly affects premium.
---------------------------------------
📌 High Volatility Impact
When volatility increases:
• Option premiums become expensive
• Premiums move faster
• SL can hit quickly
• Targets can come quickly
• OTM options may move sharply
• Risk also increases
High volatility is good for option buyers only when the market has clear direction.
Without direction, high volatility can create traps.
---------------------------------------
📌 Low Volatility Impact
When volatility is low:
• Premiums move slowly
• Options become cheaper
• Time decay hurts buyers
• Breakouts may fail
• CE and PE both can become weak
• Market may remain range-bound
Low volatility is difficult for option buyers because there is not enough movement.
No movement = premium decay.
---------------------------------------
📌 Volatility Crush
This is very important.
⚠Before a big event, options may become expensive because traders expect a big move.
After the event, uncertainty reduces and implied volatility can fall.
This can cause option premiums to drop.
This is called volatility crush.
So, even if the market moves slightly in your direction, your option may not give expected profit if volatility falls sharply.
---------------------------------------
📌 Impact on ITM, ATM and OTM
👉 ITM Options
- More stable.
- Less affected by volatility compared to OTM.
- Better for safer premium behaviour.
👉 ATM Options
- Good liquidity.
- Strong reaction to movement.
- Sensitive to volatility.
- Useful for intraday momentum.
👉 OTM Options
- Cheaper but riskier.
- Highly affected by volatility.
- Needs strong and fast move.
- Can decay quickly.
This is why far OTM options are dangerous in slow markets.
---------------------------------------
📌 Best Condition for Option Buying
Option buying works best when:
**High volatility + clear direction + momentum**
👉 Example for CE:
• Price breaks resistance
• Candle closes strongly
• Volume supports
• Price stays above VWAP
• CE premium also breaks out
👉 Example for PE:
• Price breaks support
• Candle closes strongly
• Volume supports
• Price stays below VWAP
• PE premium also breaks out
---------------------------------------
📌 Avoid Option Buying When
Avoid buying options when:
• Market is sideways
• Price is stuck near VWAP
• Candles are small
• Breakouts are failing
• Premium is already expensive
• Momentum is missing
• CE and PE both look weak
In sideways market, option buyers usually suffer from time decay.
---------------------------------------
📌 Simple Rule
⚠ Volatility without direction = Trap
✅ Volatility with direction = Opportunity
Do not buy options only because the market is moving fast.
First check:
✅ Direction
✅ Momentum
✅ Candle close
✅ VWAP
✅ Volume
✅ Strike selection
✅ Option premium behaviour
---------------------------------------
📌 Finally important point to note is;
Volatility can make options move fast.
But volatility can also destroy premiums if you enter at the wrong time.
A smart trader does not only ask:
“Will the market go up or down?”
A smart trader asks:
“Is volatility supporting this trade?”
👉 Remember:
- High volatility makes premiums expensive.
- Low volatility makes premiums slow.
- Sideways market kills option buyers.
- Direction + momentum makes options powerful.
---------------------------------------
Educational Purpose Only.
Education 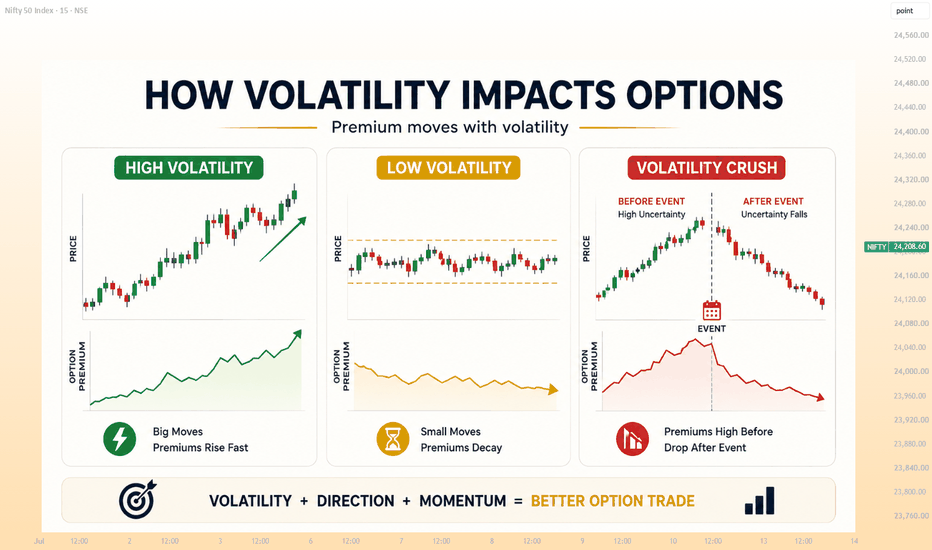
 Long
Long
 Long
Long
NIFTY WEEKLY Exp. Short Range Level Analysis for 14th Jul 2026 SGMN SplD BULLISH Above => 24288.
🔕 SGMN SplD Bearish BELOW => 24138.
Mentioned analysis based on 2 consecutive candle close in 15 min Time Frame.
━━━━━🟥🟧🟨🟩🟦🟪⬛━━━━━
💥Level Interpretation / description:
✍🏻L#1: If the candle crossed & stays above the “Buy Gen”, it is treated / considered as Bullish bias. Cfm=> Confirmation.
L#2: Possibility / Probability of REVERSAL near 🔕RL/TF1 & 🔔RL/TF2
L#3: If the candle stays above “Sell Gen” but below “Buy Gen”, it is treated / considered as Sidewise. Aggressive Traders can take Long position near “Sell Gen” either retesting or crossed from Below & vice-versa i.e. can take Short position near “Buy Gen” either retesting or crossed downward from Above.
L#4: If the candle crossed & stays below the “Sell Gen”, it is treated / considered a Bearish bias.
L#5: Possibility / Probability of REVERSAL near 🔕RL/TF1 & 🔔RL/TF2
HZB (Buy side) & HZS (Sell side) => Hurdle Zone,
✍🏻 *** Specialty of “HZB#1, HZB#2 HZS#1 & HZS#2” is Sidewise (behaviour in Nature)
Rest Plotted and Mentioned on Chart
Color code Used:
Green, BLUE =. Positive bias.
Safron, RED =. Negative bias.
RED in Between Green means Trend Finder / Momentum Change
/ CYCLE Change and Vice Versa.
Notice One thing: HOW LEVELS are Working.
Use any Momentum Indicator / Oscillator or as you "USED to" to Take entry.
━━━━━🟥🟧🟨🟩🟦🟪⬛━━━━━
⚠️ DISCLAIMER:
The information, views, and ideas shared here are purely for educational and informational purposes only. They are not intended as investment advice or a recommendation to buy, sell, or hold any financial instruments. I am not a SEBI-registered financial adviser.
Trading and investing in the stock market involves risk, and you should do your own research and analysis. You are solely responsible for any decisions made based on this research.
"🔔As HARD EARNED MONEY IS YOUR's, So DECISION SHOULD HAVE TO BE YOUR's".
━━━━━🟥🟧🟨🟩🟦🟪⬛━━━━━
❇️ Follow notification about periodical View
💥 Do Comment for Stock WEEKLY Level Analysis.🚀
📊 Do you agree with this view?
✈️ HIT THE PLANE ICON if this technical observation resonates with you. It will Motivate me.
━━━━━🟥🟧🟨🟩🟦🟪⬛━━━━━
💡 If You LOOKING any CHART & want for Level and ANALYZE?
Share your desired stock names in the comments below! I will try to analyze the chart Levels, patterns and share my technical view (so far my Knowledge).
If Viewers think It can identify meaningful setups. Looking forward to hearing from all of you — let's keep this discussion going and help each other make better trading decisions.
___________🔕^^^⚫⚪^🙏🏼🙏🏼🙏🏼^⚪⚫^^^🔔___________ Your Trading Brain Has a Daily LimitMost traders manage their capital carefully, but almost nobody thinks about managing their mental energy. From the moment you open the charts, your brain starts making decisions: Which market should I watch? Is this a setup? Should I enter? Should I wait? Should I exit?
One decision doesn't feel exhausting. But after hours of charts, alerts, news, and constant price checking, your judgment can become less sharp. You may still feel focused, but your decisions can slowly become more impulsive. Think of it as a mental trading budget: The more carelessly you spend it, the less clarity you may have later.
1. Every Decision Has a Mental Cost
Trading involves a constant stream of small choices. Timeframes, entries, stop-losses, position sizes, targets: Your brain is continuously processing information.
The problem begins when unnecessary decisions consume your attention. Watching ten markets and twenty setups doesn't always create more opportunities. Sometimes, it simply creates more noise.
2. Your First Trade and Fifth Trade May Feel Different
At the beginning of a session, you may follow your checklist carefully. After several hours and multiple trades, skipping one rule can suddenly feel harmless.
The strategy hasn't changed: Your decision-making state has. This is why judging every trade only by the chart can be misleading. Your mental condition matters too.
3. More Screen Time Doesn't Always Mean Better Analysis
There is a point where studying the chart turns into staring at the chart. Traders often believe that if they watch long enough, another opportunity will appear.
Instead, excessive monitoring can tempt you to create setups that weren't obvious before. When you're desperate to find a trade, normal price movement starts looking like a signal.
4. Decision Fatigue Can Look Like Confidence
Poor decisions don't always feel emotional. Sometimes they sound surprisingly confident: "I know this will reverse" or "I'll enter now and manage it later."
That's what makes mental fatigue dangerous. You may stop questioning yourself at exactly the moment when you should be checking your process more carefully.
5. Protect Your Best Decision-Making Hours
Pay attention to when you trade with the most clarity. Some traders perform better early in their session, while others need time before they feel focused.
Ask yourself: "When do I usually break my rules?" If most of your impulsive trades happen after hours of screen time or several previous decisions, that pattern deserves attention.
6. Create a Daily Decision Limit
You don't need to analyze every market or take every setup. Reduce unnecessary choices: Build a watchlist, define your trading hours, and use a simple pre-trade checklist.
The goal is not to avoid thinking. The goal is to save your attention for decisions that actually involve risk.
7. Know When Your Brain Is Done Trading
Sometimes the chart is still open, but mentally, your trading session is already over. You're rereading the same levels, switching timeframes repeatedly, or searching for confirmation of what you already want to do.
Recognizing that moment is a trading skill. Closing the chart can protect your capital just as effectively as a stop-loss.
Conclusion:
Your trading account has limited capital, and your mind has limited attention. Traders usually protect the first while carelessly exhausting the second.
You don't need unlimited focus to trade well. You need to recognize when your decision quality is dropping and have the discipline to stop before mental fatigue starts making decisions for you.
Remember: Your next bad trade may not come from a bad strategy. It may simply come from a tired decision-maker.  Education
 Long
Long
 Long
Long
 Long
Long
 Short
Short
TCS Tests Key Breakout ZoneHighlights
TCS has staged a strong recovery following its quarterly earnings, with the stock reclaiming key moving averages and improving its overall technical structure.
The stock is currently trading near the ₹3,550–₹3,600 resistance zone. A decisive close above this range could confirm a breakout and open the door for an advance towards ₹3,700–₹3,800 in the near term.
On the downside, ₹3,420–₹3,450 serves as immediate support, while the ₹3,300 level remains a strong medium-term demand zone. Holding above these levels would keep the bullish outlook intact.
Momentum indicators such as RSI and MACD have turned positive, accompanied by improving trading volumes, indicating renewed institutional participation after the earnings announcement.
The stock has formed a higher-low pattern on the daily chart, suggesting that buyers are gradually regaining control after an extended consolidation phase.
Strong deal wins, resilient demand from the BFSI segment, and increasing AI-led transformation projects continue to support the company's long-term growth prospects, providing a solid fundamental backdrop to the improving technical setup.
Takeaway
TCS is showing signs of a meaningful trend reversal after several months of consolidation. A sustained move above ₹3,600 could accelerate buying momentum and push the stock towards the ₹3,700–₹3,800 zone. As long as TCS holds above the ₹3,420–₹3,450 support range, the technical bias remains positive, making any short-term pullbacks potential buying opportunities rather than signs of weakness. Every Trader Is a Piece in the GameIf the Market Were a Chess Game: (From my weekend thoughts)
When people think about trading, they often imagine numbers, charts, and indicators. But what if the market could be explained through a game that has existed for centuries? Chess and trading have more in common than most people realize. Neither game is won by making random moves or reacting emotionally. Success comes from patience, planning, and thinking several steps ahead. Every move has a purpose, every mistake has a consequence, and every decision changes the position of the game.
The Board:
Every chess match begins with the same board, but no two games are ever identical. Trading works in much the same way. Every trader looks at the same chart, yet everyone sees different opportunities. Support and resistance, trends, and important price levels become the squares where the battle between buyers and sellers takes place. Before a grandmaster makes a move, they study the entire board. Similarly, successful traders study the market before placing a trade instead of reacting to every candle they see.
The Pawns:
In chess, pawns are the most common pieces. Individually they are weak, but together they control space and influence the entire game. Retail traders often play a similar role in the market. Many buy after a breakout, panic during pullbacks, or place stop losses in obvious locations. On their own, these decisions may seem insignificant, but together they create the liquidity that drives the market. Without pawns, chess cannot be played. Without retail traders, financial markets would not have the same flow of orders.
The Queen:
The queen is the strongest piece on the chessboard. It can move in almost any direction and is often responsible for controlling the game. In trading, large institutions, banks, and hedge funds play a similar role. They have more capital, more information, and greater influence than individual traders. They do not enter trades based on emotions or simple indicators. Instead, they plan their moves carefully, looking for areas where enough liquidity exists to execute large orders. While retail traders often react to price, institutions are capable of creating the moves that everyone else reacts to.
Board Control:
One of the biggest mistakes beginners make in chess is focusing only on capturing pieces. Experienced players know that controlling the board is far more important than winning a single exchange. Trading follows the same principle. Many new traders spend their time trying to predict every reversal, while experienced traders focus on trading in the direction of the trend. A strong trend represents control. During an uptrend, buyers dominate the market. During a downtrend, sellers are in control. Trading against that control is often like attacking a well-defended king with only a single pawn.
Sacrifice:
Every great chess player understands that sometimes giving up a piece leads to a much greater advantage later in the game. The same idea exists in trading. Professional traders never expect to win every trade. They accept small losses because they understand that protecting their capital is more important than protecting their ego. A controlled loss is simply the cost of staying in the game. The traders who refuse to accept small losses often end up facing much larger ones.
Checkmate:
The ultimate goal in chess is not to capture every piece but to put your opponent in a position where no escape is possible. In trading, liquidity often plays a similar role. Price frequently moves toward areas where large numbers of stop losses and pending orders are placed. Many traders believe the market is hunting their stop loss, but in reality, it is searching for enough orders to fuel the next move. Once that liquidity has been collected, the market often continues in its intended direction.
What I think is...
Trading and chess share one important lesson. The winner is rarely the person who acts the fastest. It is usually the person who understands the position better than everyone else. Both reward patience over excitement, planning over guessing, and discipline over emotion. The next time you open a chart, imagine you are sitting in front of a chessboard. Instead of asking where price will go next, ask yourself one simple question.
Who controls the board right now?
That single question may change the way you look at the market forever.
By @BrightRally_Research on @TradingView
Education