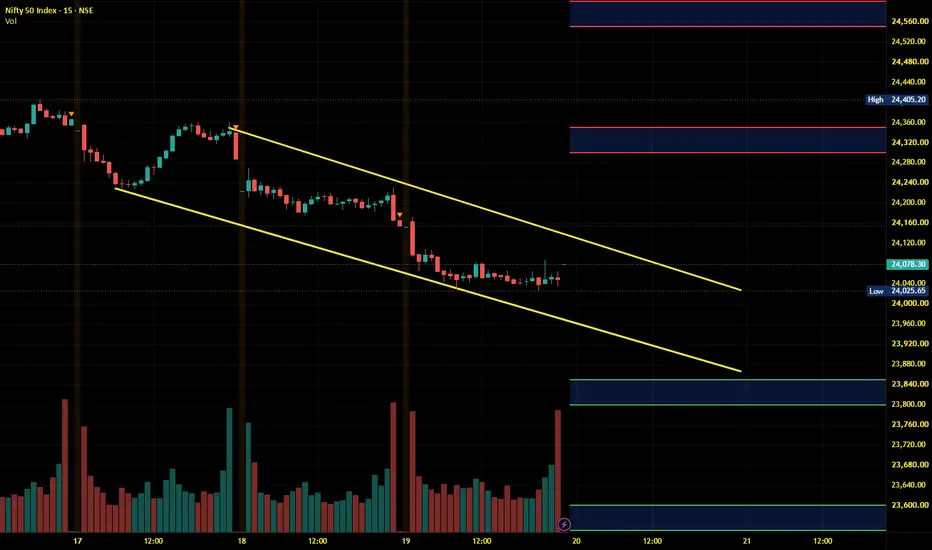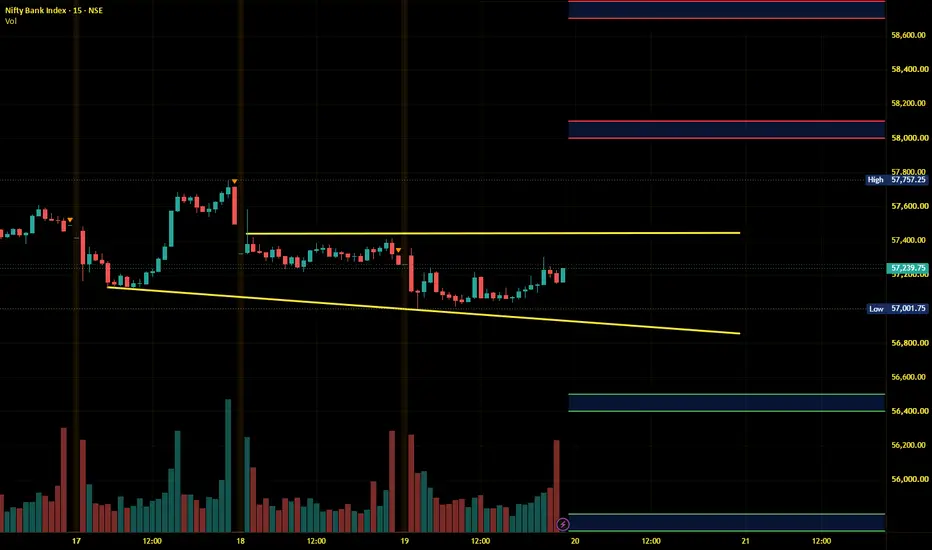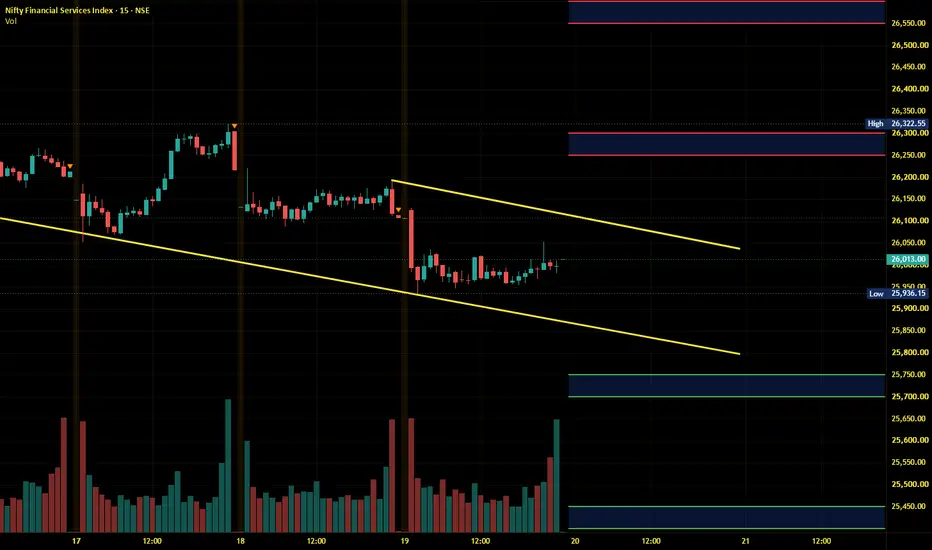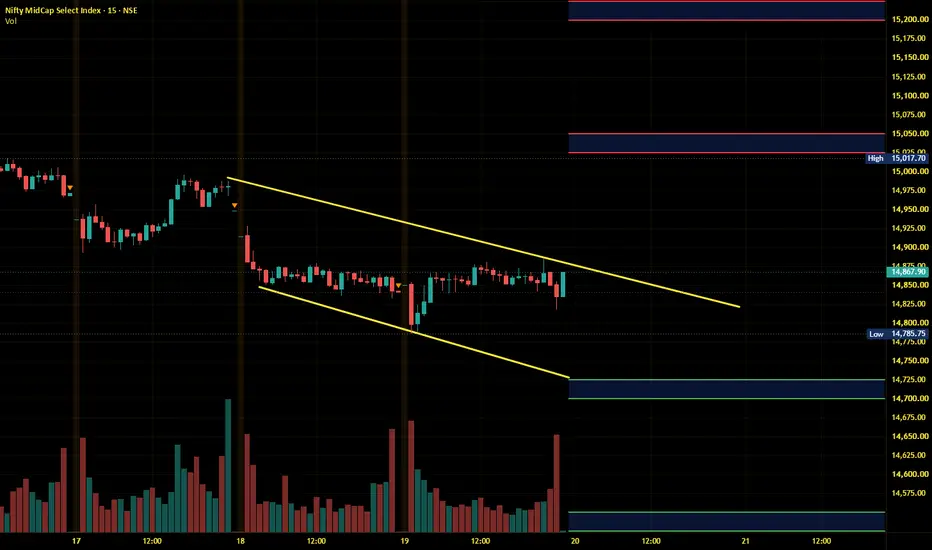
NIFTY will remain volatile between these levels.AS we can see NIFTY is still between our important levels and hence we can expect NIFTY to remain volatile to sideways to bullish until and unless NIFTY breaks either of the level for further directional move. So, plan your trades accordingly and keep watching everyone.
Trend Lines
Nifty Intraday Analysis for 24th August 2026NSE:NIFTY
Index has support at 24000 and resistance at 24500 level and range bound moment is expected as long as the either side level is not broken.
The upward movement may lead to 24450 – 24500 resistance range and if the index crosses and sustains above this level then may reach near 24700 – 24750 range.
On the contrary, The downward moment may drag the Index to 24050 – 24000 support range in downward momentum and if this support is broken then index may tank near 23800 – 23750 ra
Banknifty Intraday Analysis for 24th August 2026NSE:BANKNIFTY
Index has support at 57000 and resistance at 58000 level and range bound moment is expected as long as the resistance is not broken.
The upward moment may lead the Index to 58400 – 58500 resistance range in upward momentum and if the index crosses and sustains above this level then may reach near 59100 – 59200 range.
On the contrary, The downward moment may drag the Index to 57100 – 57000 support range in downward momentum and if this support is broken then the index may tan
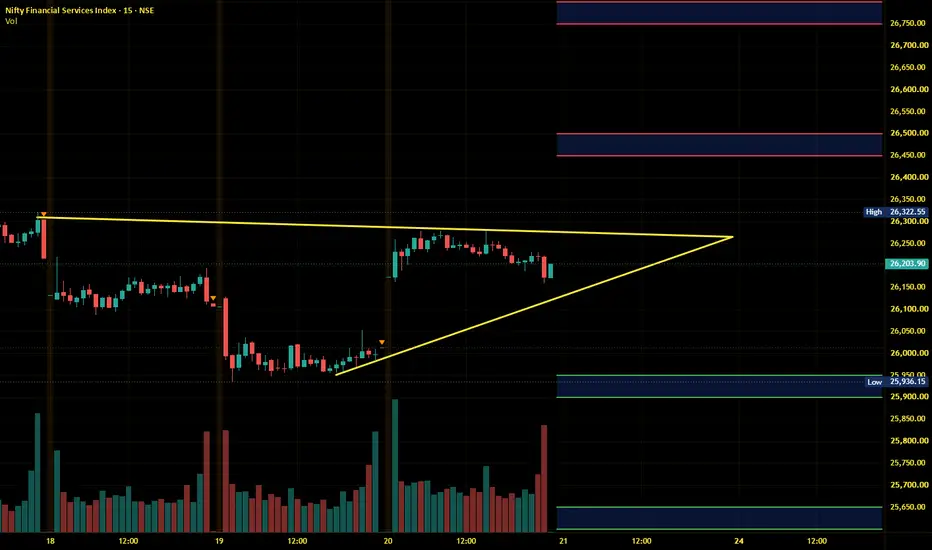
Finnifty Intraday Analysis for 24th August 2026NSE:CNXFINANCE
Index has resistance in the 26300 - 26400 range and an uptrend is expected when the Index breaks and sustains above this range.
The upward movement may lead the Index to 26500 - 26550 resistance range and if the index crosses and sustains above this level then may reach near 26800 - 26850 range.
On the contrary, The downward moment may drag the to 26000 – 25950 support range and if this support too is broken then index may tank near 25700 – 25650 range.
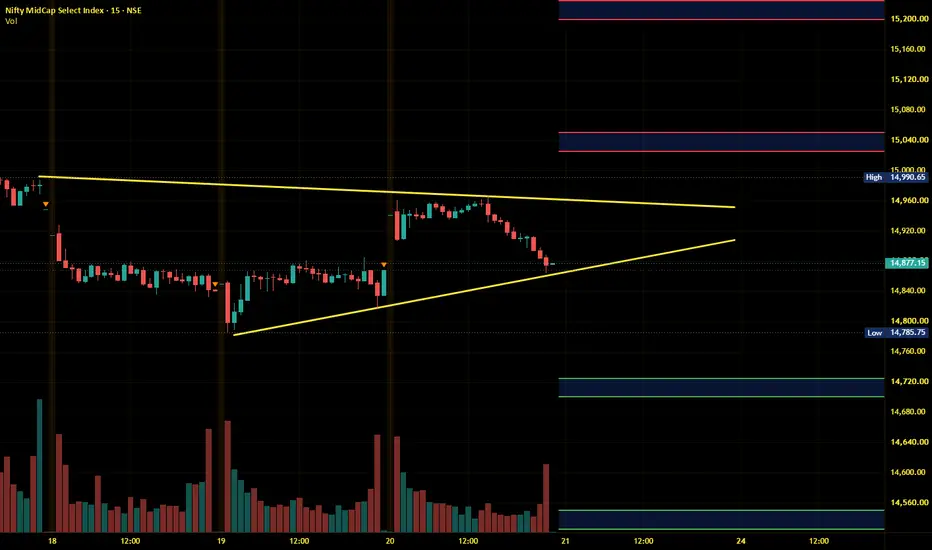
Midnifty Intraday Analysis for 24th August 2026NSE:NIFTY_MID_SELECT
The index is in the range of 14800 - 15000 and reversal is expected from either level as long as the range is not broken.
The upward movement may lead the Index near 15025 – 15050 resistance range and if the index crosses and sustains above this level then may reach 15200 – 15225 range.
On the contrary, The downward moment may drag the index to 14725 – 14675 support range and if this support is broken then index may tank near 14550 – 14525 range.
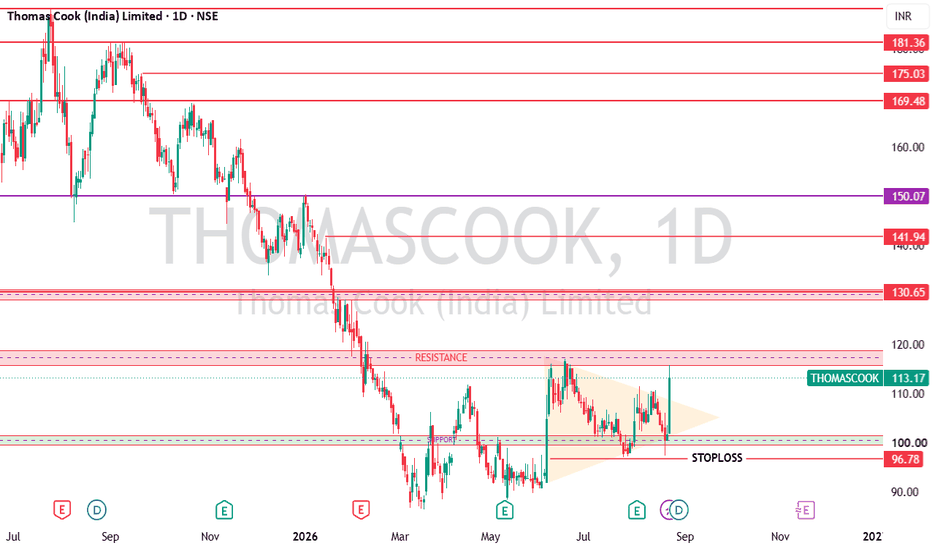
THOMASCOOK 1D: Key Supply & Demand Zones Signal Swing Thomas Cook (India) Limited ( NSE:THOMASCOOK ) on the daily timeframe is currently trading near 113.17 following a strong +11.41% single-day expansion. Price has broken out of a tight triangular consolidation off its base and is testing an immediate overhead supply/resistance zone.
Immediate Supply Zone (115.00 – 118.00): Primary overhead resistance. The recent rejection high near 115.70 sits directly within this zone, marking the key intraday hurdle for momentum buyers.
Immediate Support
XAUUSD — 4,550 Holds, 4,945 Opens?XAUUSD — 4,550 Holds, 4,945 Opens?
Gold is now trading inside a strong bullish recovery channel after breaking away from the old bearish structure.
The market has already shifted from accumulation into expansion, and price is now holding around 4,600.
The trend is clearly bullish.
But after a strong move, the best plan is still not to chase the candle.
The simple read
Gold is currently moving above the buy trendline area.
As long as price holds above the 4,535 - 4,550 support zone, buyers
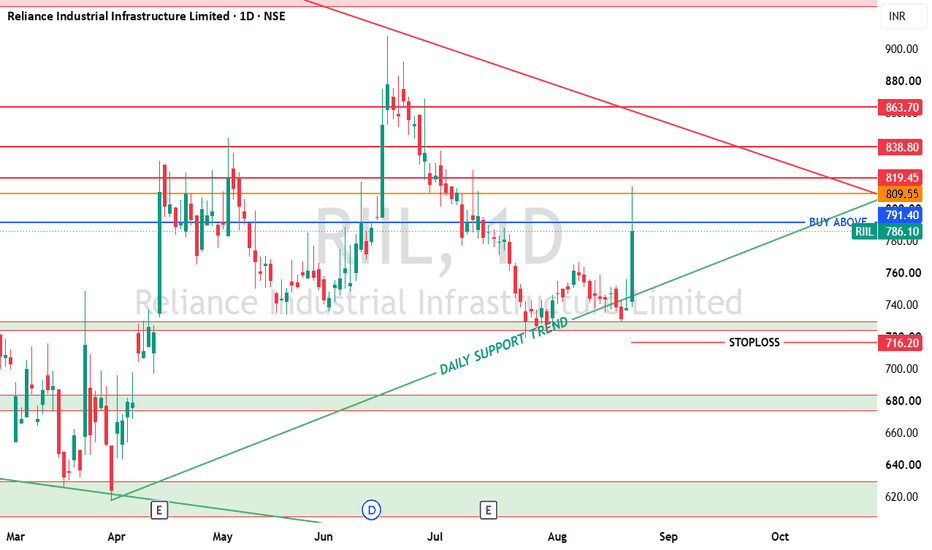
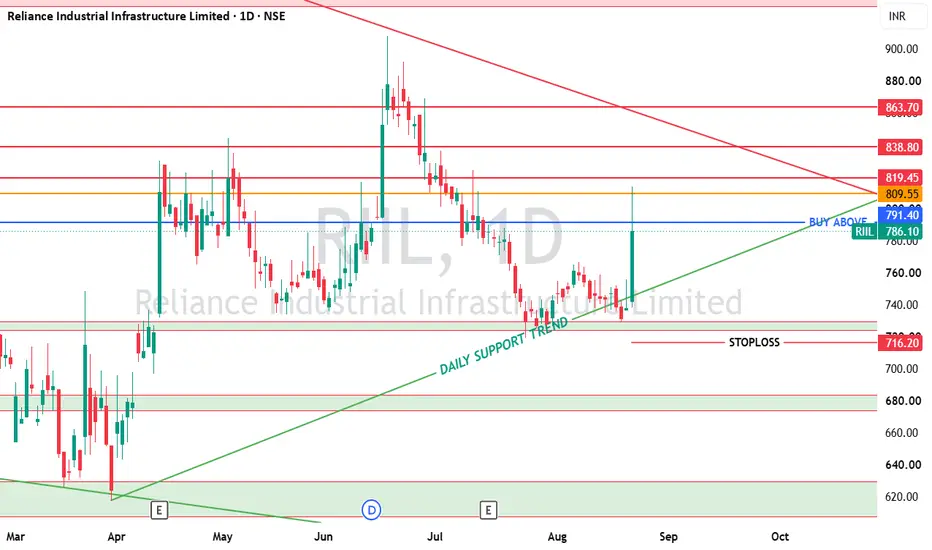
RIIL 1D: Dynamic Support Rebound & Trendline Breakout SetupReliance Industrial Infrastructure Limited ( NSE:RIIL ) on the daily timeframe is currently trading near 786.10 (+6.55%). Price has staged a clean rebound off its DAILY SUPPORT TRENDLINE , making higher lows and advancing toward the overhead descending WEEKLY TREND LINE.
Key Support Zone: 760.00 – 780.00 (Dynamic Support Trendline Alignment & Rebound Area).
Stop-Loss / Invalidation Level: Below 716.20 on a daily closing basis, marked as structural stop-loss protection against a breakdow
Nifty Intraday Analysis for 21st August 2026NSE:NIFTY
Index has support at 24000 and resistance at 24500 level and range bound moment is expected as long as the either side level is not broken.
The upward movement may lead to 24450 – 24500 resistance range and if the index crosses and sustains above this level then may reach near 24700 – 24750 range.
On the contrary, The downward moment may drag the Index to 24000 – 23950 support range in downward momentum and if this support is broken then index may tank near 23750 – 23700 ra
Banknifty Intraday Analysis for 21st August 2026NSE:BANKNIFTY
Index has support at 57000 and resistance at 58000 level and range bound moment is expected as long as the resistance is not broken.
The upward moment may lead the Index to 58200 – 58300 resistance range in upward momentum and if the index crosses and sustains above this level then may reach near 58900 – 59000 range.
On the contrary, The downward moment may drag the Index to 56800 – 56700 support range in downward momentum and if this support is broken then the index may tan
Finnifty Intraday Analysis for 21st August 2026NSE:CNXFINANCE
Index is in the 26200 - 26400 range and uptrend is expected when the Index breaks and sustains above this range.
The upward movement may lead the Index to 26450 - 26500 resistance range and if the index crosses and sustains above this level then may reach near 26750 - 26800 range.
On the contrary, The downward moment may drag the to 25950 – 25900 support range and if this support too is broken then index may tank near 25650 – 25600 range.
Midnifty Intraday Analysis for 21st August 2026NSE:NIFTY_MID_SELECT
The index is in the range of 14800 - 15000 and reversal is expected from either level as long as the range is not broken.
The upward movement may lead the Index near 15025 – 15050 resistance range and if the index crosses and sustains above this level then may reach 15200 – 15225 range.
On the contrary, The downward moment may drag the index to 14725 – 14675 support range and if this support is broken then index may tank near 14550 – 14525 range.
XAUUSD — 4,591 Breakout, 4,646 Next Test?
Gold is showing a very strong bullish structure after breaking above the previous resistance area.
Price is now trading around 4,590 - 4,600, right above the 1.0 Fibo zone near 4,591.
This is a powerful breakout.
But after a strong move, I still do not want to chase the candle blindly.
The simple read
The key level now is 4,591.
If gold holds above 4,591, buyers may try to continue toward the next Fibo extension zone around 4,646.
That 4,646 area is important because it can become the f
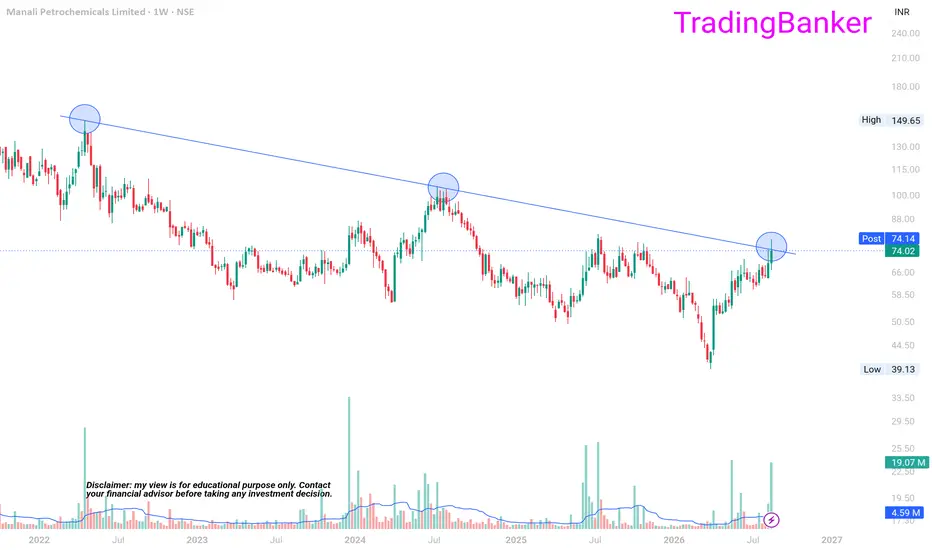
MANALIPETC: long term trendline breakout soon?➡️looking to breakout from a 4 year trendline.
➡️financials are decent with increasing EPS during during the last few years. The CMP is near the book value.
➡️P/E ratio is nearing single digits with ever increasing capacity expansion. First and largest producer of propylene oxide among other chemicals.
➡️MCap= Rs. 1272 cr and cash and cash equivalents= Rs. 605 cr.
Disc: invested when I alerted elsewhere.
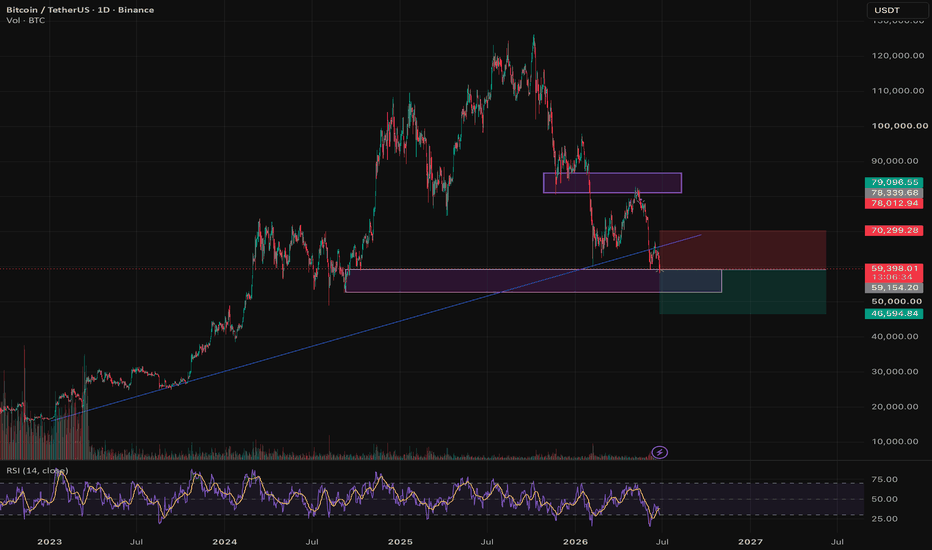
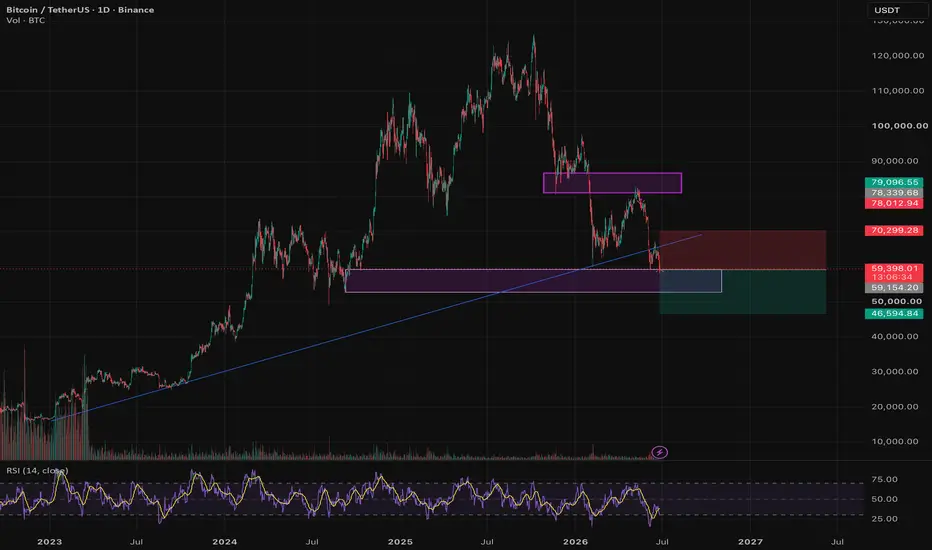
BTCUSDT | Daily Short SetupBitcoin has lost both the long-term trendline and the key daily support zone around 59k–60k, turning previous support into resistance. Unless bulls reclaim this level quickly, the path of least resistance remains to the downside.
The current setup is based on a breakdown and potential retest of the former support. While a short-term relief bounce is possible, I'm treating it as an opportunity unless price can reclaim the breakdown level with conviction.
Trade Plan
🔴 Entry: Breakdown / retest o
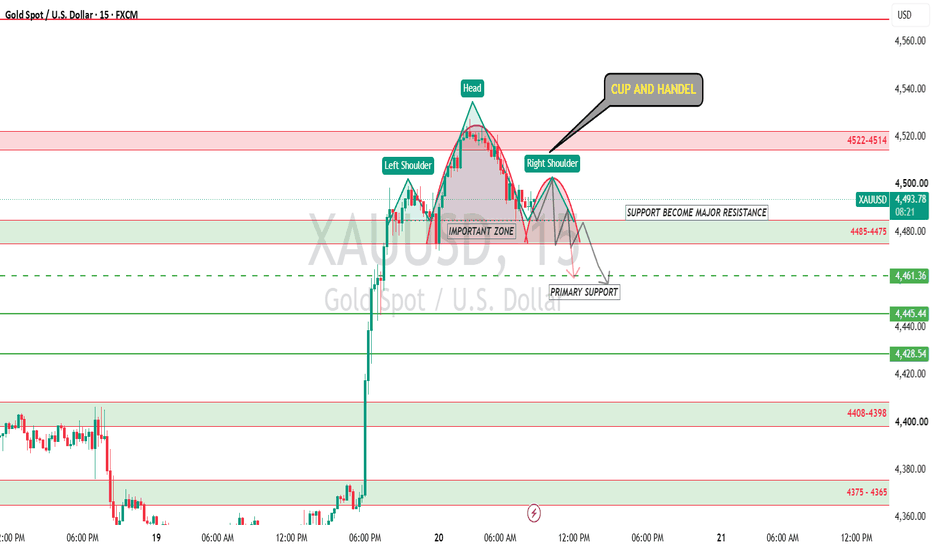
XAUUSD Technical Analysis 20 AUGUST 2026The chart shows XAUUSD trading around $4,492.12, testing a major structural junction. The broader bias favors upside continuation due to two overlapping bullish patterns, but an immediate short-term pull or rejection is likely before the primary long expansion occurs.
Pattern & Structure OverviewHead & Shoulders (Inverse H&S): The chart shows a multi-session Inverse Head & Shoulders structure. The Left Shoulder rests around 4480.00, the Head swept bottom liquidity down to 4475.00, and the Ri
Nifty Intraday Analysis for 20th August 2026NSE:NIFTY
Index has support at 24000 and reversal from this level is expected as long as the support level is not broken.
The upward movement may lead to 24300 – 24350 resistance range and if the index crosses and sustains above this level then may reach near 24550 – 24600 range.
On the contrary, The downward moment may drag the Index to 23850 – 23800 support range in downward momentum and if this support is broken then index may tank near 23600 – 23550 range.
Banknifty Intraday Analysis for 20th August 2026NSE:BANKNIFTY
Index has support at 57000 and reversal from this level is expected as long as the support level is not broken.
The upward moment may lead the Index to 58000 – 58100 resistance range in upward momentum and if the index crosses and sustains above this level then may reach near 58700 – 58800 range.
On the contrary, The downward moment may drag the Index to 56500 – 56400 support range in downward momentum and if this support is broken then the index may tank near the 55800 – 55
Finnifty Intraday Analysis for 209th August 2026NSE:CNXFINANCE
Index has support in the 26000 - 25950 range and reversal from this range is expected as long as the support range is not broken.
The upward movement may lead the Index to 26250 - 26300 resistance range and if the index crosses and sustains above this level then may reach near 26550 - 26600 range.
On the contrary, The downward moment may drag the to 25750 – 25700 support range and if this support too is broken then index may tank near 25450 – 25400 range.
Midnifty Intraday Analysis for 20th August 2026NSE:NIFTY_MID_SELECT
The index is in the range of 14800 - 15000 and reversal is expected from either level as long as the range is not broken.
The upward movement may lead the Index near 15025 – 15050 resistance range and if the index crosses and sustains above this level then may reach 15200 – 15225 range.
On the contrary, The downward moment may drag the index to 14725 – 14675 support range and if this support is broken then index may tank near 14550 – 14525 range.
XAUUSD — 4,500 Is the Gate to 4,650?🌸 XAUUSD — 4,500 Is the Gate to 4,650?
Gold is showing a strong bullish structure after breaking above the previous resistance zone.
The market pushed sharply from the lower support area and is now trading around 4,480 - 4,500, right under the short-term breakout line.
This is where the chart becomes very interesting.
The trend is bullish.
But after a strong move, I still do not want to chase the candle.
I want to see if buyers can defend the new structure.
The simple read
4,500 is the f
BTC Ignites MomentumBitcoin isn’t just moving — it’s breaking patterns. After wrestling with a stubborn downtrend, the 1H chart shows a clean breakout above resistance, locking bulls back in the driver’s seat at $64,339. The battlefield is clear: $62,500 stands as the fortress of support, while $65,501 shines as the next conquest. With a disciplined stop at $63,939, this isn’t gambling — it’s a calculated risk-reward play. Momentum traders know: when BTC sparks, the fire spr