Long
Long
EURUSD — Corrective Bounce Before Deeper Bearish Continuation
Fundamental Analysis
EURUSD remains under pressure as price continues to trade below the main EMA structure. Traders are still watching USD momentum, Fed expectations, and upcoming macro data.
For now, the recovery looks corrective, not a confirmed bullish reversal. If price fails at the value sell zone, sellers may continue to control the next move.
Technical Analysis
On the 1H chart, EURUSD is still trading below EMA 34, EMA 89, and EMA 200. The EMA structure is above price, showing that the short-term trend remains bearish.
Price is currently around 1.1445 after reacting from the lower buy zone near 1.1436 - 1.1445. This area may support one more corrective bounce before the next bearish leg.
The key sell zone is around 1.1491 - 1.1509. This zone aligns with the Fibonacci 0.618 retracement, previous structure, and value range resistance. If EURUSD reaches this area and rejects, the bearish continuation setup becomes cleaner.
Below current price, the main downside target is around 1.1383 - 1.1384. This is the target zone marked on the chart and may become the next liquidity objective if sellers regain control.
Important Key Levels
Current price area: 1.1445
Buy reaction zone: 1.1436 - 1.1445
Sell value range: 1.1491 - 1.1509
Fibonacci 0.618 sell zone: 1.1491 - 1.1509
EMA resistance area: 1.1498 - 1.1533
Short-term invalidation: above 1.1533
Main downside target: 1.1383 - 1.1384
Trading Scenario
Main Sell Scenario
Entry: 1.1491 - 1.1509
Stop Loss: 1.1533
Take Profit 1: 1.1445
Take Profit 2: 1.1416
Take Profit 3: 1.1383 - 1.1384
Sell Condition
The preferred setup is to wait for EURUSD to create one more corrective bounce into the 1.1491 - 1.1509 value range. This area is the main Fibonacci and resistance zone on the chart.
A sell setup becomes more valid if price forms bearish rejection from this zone, such as a long upper wick, bearish engulfing candle, failed breakout, or lower high below the EMA structure.
If price rejects from the sell zone and breaks back below 1.1436, the bearish continuation view becomes stronger. The next downside target would be 1.1416, followed by the main target around 1.1383 - 1.1384.
Alternative Buy Scenario
Entry: 1.1436 - 1.1445
Stop Loss: 1.1416
Take Profit 1: 1.1481
Take Profit 2: 1.1491
Take Profit 3: 1.1509
Buy Condition
This is only a short-term corrective bounce setup, not the main trend view. A buy setup is valid only if EURUSD holds the 1.1436 - 1.1445 buy zone and forms clear bullish rejection.
If price fails to hold this zone, the bounce scenario is invalid and sellers may push directly toward 1.1383 - 1.1384.
Entry Conditions
Wait for price to reach the value sell zone.
Look for bearish rejection around 1.1491 - 1.1509.
A break below 1.1436 confirms stronger downside pressure.
If price breaks and holds above 1.1533, the sell setup is invalid.
Overall, the main view remains bearish while EURUSD stays below EMA 34, EMA 89, and EMA 200. Price may create one more corrective bounce first, but the preferred plan is to look for sell confirmation from 1.1491 - 1.1509 toward 1.1416 and 1.1383 - 1.1384.
Do you share the same view that EURUSD may bounce first before a deeper drop, or are you waiting for a cleaner rejection from the value sell zone?
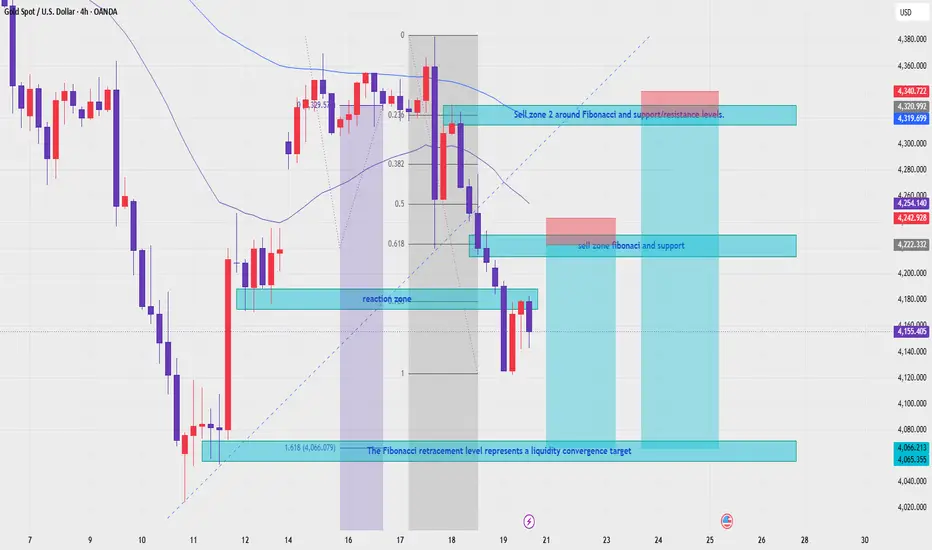
XAUUSD H4 — EMA Bearish TrendXAUUSD — EMA Bearish Trend, Two Sell Zones Toward Fibonacci Liquidity Target
Fundamental Analysis
Gold remains under bearish pressure as price continues to trade below the main EMA structure. The market is still watching USD strength, Treasury yields, and upcoming U.S. data, which may create volatility around key Fibonacci and liquidity zones.
For next week, the main view remains bearish while recovery attempts stay below the EMA resistance area.
Technical Analysis
On the 4H chart, XAUUSD is still trading below EMA 34, EMA 89, and EMA 200. This confirms that the broader short-term trend remains bearish, with the EMA structure acting as dynamic resistance above price.
Price is currently around 4,155 after a strong bearish move from the upper structure. The chart shows that gold is now reacting near a short-term reaction zone, but the recovery has not yet confirmed a bullish reversal.
The first sell area is around 4,222 - 4,243. This zone aligns with Fibonacci retracement, previous support turned resistance, and short-term liquidity. If price pulls back into this area and rejects, sellers may continue to defend the trend.
The second sell area is higher, around 4,320 - 4,341. This zone is stronger because it aligns with Fibonacci resistance, EMA pressure, and a larger support/resistance liquidity area. If gold retraces deeper into this zone, it may offer another sell opportunity with a wider structure.
The main downside target remains the Fibonacci 1.618 liquidity convergence zone around 4,066 - 4,065.
Important Key Levels
Current price area: 4,155
Reaction zone: 4,170 - 4,180
Sell zone 1: 4,222 - 4,243
Sell zone 2: 4,320 - 4,341
EMA resistance area: 4,254 - 4,320
Liquidity convergence target: 4,066 - 4,065
Invalidation for sell zone 1: above 4,254
Invalidation for sell zone 2: above 4,341
Trading Scenario
Sell Scenario 1 — Fibonacci Support Retest
Entry: 4,222 - 4,243
Stop Loss: 4,254
Take Profit 1: 4,170
Take Profit 2: 4,120
Take Profit 3: 4,066 - 4,065
Sell Condition
The first sell setup is to wait for gold to pull back into 4,222 - 4,243. This area is the nearest Fibonacci and support/resistance retest zone.
A sell setup becomes more valid if price forms bearish rejection from this zone, such as a long upper wick, bearish engulfing candle, failed breakout, or lower high below the EMA structure.
Sell Scenario 2 — Higher Liquidity Sell Zone
Entry: 4,320 - 4,341
Stop Loss: 4,365
Take Profit 1: 4,243
Take Profit 2: 4,170
Take Profit 3: 4,066 - 4,065
Sell Condition
The second sell setup is only considered if gold retraces deeper into 4,320 - 4,341. This is the stronger liquidity and Fibonacci resistance zone on the chart.
A rejection from this area would show that buyers failed to reclaim the EMA resistance zone. If sellers defend this level, the next bearish leg may target 4,243 first, then 4,170 and the Fibonacci 1.618 target around 4,066 - 4,065.
Entry Conditions
Wait for price to retest one of the sell zones.
Look for bearish rejection before entering sell.
Do not sell directly at the low without a pullback.
A break below 4,120 would strengthen the move toward 4,066.
If price breaks and holds above 4,341 - 4,365, the bearish setup should be reassessed.
Overall, the main view remains bearish while XAUUSD trades below EMA 34, EMA 89, and EMA 200. For next week, the preferred plan is to wait for a pullback into 4,222 - 4,243 or 4,320 - 4,341, then look for sell confirmation toward the Fibonacci liquidity convergence target around 4,066 - 4,065.
Do you share the same bearish view on gold for next week, or are you waiting for a cleaner pullback into the higher sell zone first?
 Short
Short
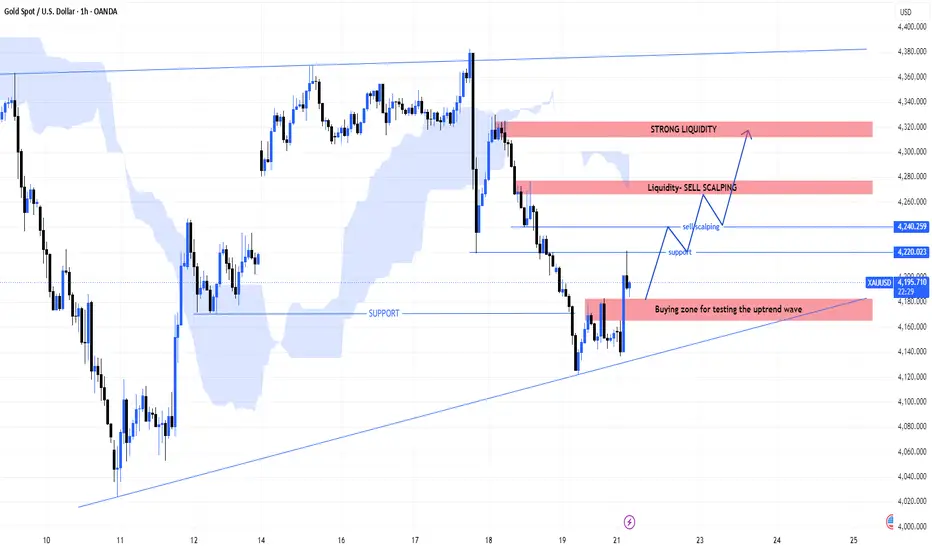
MASON XAUUSD – Gold Tests Uptrend Buy Zone
XAUUSD is trading around 4,191 at the start of the week. Price is reacting from the marked buy zone and still respecting the rising trendline, showing that buyers are trying to rebuild the short-term uptrend.
The main view is bullish recovery, but confirmation above 4,220–4,240 is still needed.
Technical View
Gold reacted accurately from the 4,160–4,180 buy zone, which is also close to the rising trendline support. This area is important because it shows where buyers are defending the current uptrend wave.
Price Action is forming a recovery attempt after the previous drop. As long as price holds above the buy zone, the market may continue to build higher lows and move toward the next resistance areas.
The first confirmation zone is 4,220–4,240. If gold breaks and holds above this area, buyers may gain stronger control and push price toward the liquidity zones above.
Ichimoku still shows that gold needs to recover into the cloud area before confirming a stronger bullish structure. A clean move back above the cloud would support the continuation view.
If price fails to hold the buy zone and breaks below the trendline, the recovery setup will weaken.
Key Zones
Current price: 4,191
Buy zone: 4,160–4,180
Trendline support: 4,160–4,180
Support: 4,220
Short-term confirmation: 4,240
Liquidity sell scalping zone: 4,265–4,275
Strong liquidity: 4,310–4,320
Invalidation: below 4,150
Trading Plan
Buy Priority: 4,160–4,180
Condition: wait for bullish rejection, higher low, or price holding above the rising trendline.
SL: below 4,150
TP1: 4,220
TP2: 4,240
TP3: 4,265–4,275
Final target: 4,310–4,320
Alternative Scenario
If gold breaks and holds above 4,240, wait for a retest before looking for continuation toward 4,265–4,275 and 4,310–4,320.
Sell View
Sell is not the priority while price holds above the buy zone and trendline. A short-term sell reaction may appear around 4,265–4,275, but it should only be considered if bearish rejection is clear.
Final View
Overall, gold is showing a bullish recovery setup at the start of the week. As long as 4,160–4,180 holds, buyers still have a chance to push price back toward 4,240 and higher liquidity zones.
Will gold confirm above 4,240, or retest the buy zone one more time?
Long 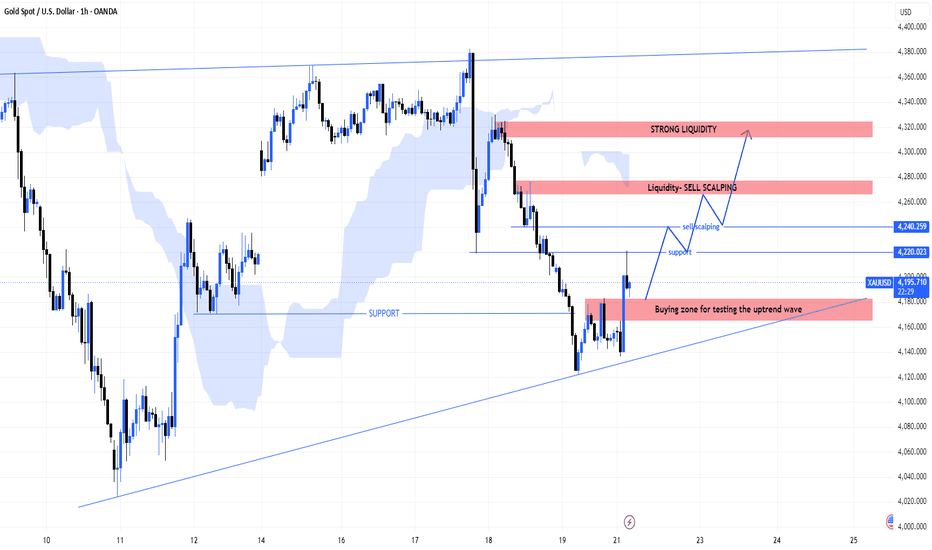
XAUUSD May Recover Into The Cloud Before A New Trend DecisionMASON XAUUSD – Gold May Recover Into The Cloud Before A New Trend Decision
XAUUSD is trading around 4,155 after reacting strongly from the lower liquidity area. Price is still inside the descending channel and remains below the Ichimoku cloud, so the larger structure is not bullish yet.
However, after filling the liquidity gap and reacting from the psychological buy zone, gold may form a technical recovery before choosing the next direction.
Technical View
Gold is still moving inside a clear descending price channel. The main trendline resistance above price continues to guide the broader bearish structure.
Price is also below the Ichimoku cloud, which means sellers still have control from the trend perspective. A real trend shift needs price to recover back into the cloud first, then hold above it with strong price action.
The important point is the reaction from the lower channel area near 4,030–4,060. This zone acted as a psychological buy area, and the reaction shows that sellers may be slowing down after the previous strong drop.
Price Action is now showing an early recovery attempt. If gold holds above 4,120–4,150, it may continue toward 4,220–4,240 and move back into the cloud zone.
But if price fails to hold above the current recovery area, the bearish channel remains dominant and gold may retest the lower liquidity zone again.
Key Zones
Current price: 4,155
Psychological buy zone: 4,030–4,060
Short-term support: 4,120–4,150
Cloud recovery zone: 4,220–4,250
Resistance: 4,350–4,380
Key price range: 4,500–4,530
Invalidation for recovery: below 4,030
Trading Plan
Buy Recovery Priority: 4,120–4,150
Condition: wait for bullish rejection, higher low, or price holding above the lower channel reaction zone.
SL: below 4,030
TP1: 4,220–4,250
TP2: 4,350–4,380
TP3: 4,500–4,530
Alternative Scenario
If gold breaks above 4,250 and holds inside the Ichimoku cloud, wait for a retest before looking for continuation toward 4,350–4,380.
Sell View
Sell is not ideal after price already reacted from the lower liquidity area. A better sell setup may appear only if gold rejects strongly from the cloud zone or the upper trendline resistance.
Final View
Overall, gold is still in a bearish channel and below Ichimoku, but the strong reaction from the lower liquidity zone suggests a recovery phase may come first. The key is whether price can enter the cloud and hold above 4,220–4,250.
Will gold recover into the Ichimoku cloud first, or reject early and return to the lower channel?
Long 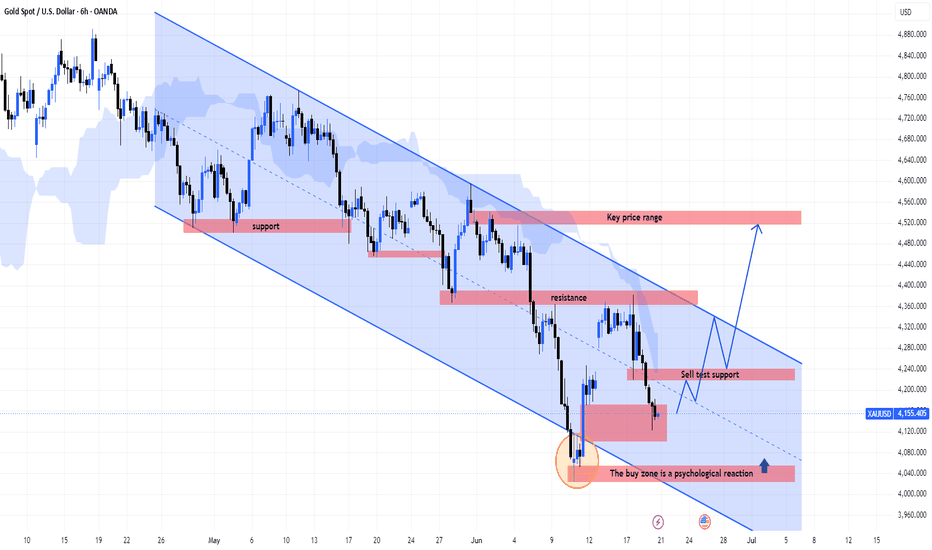
Bharti Airtel (Weekly Chart) – Technical ViewBharti Airtel (Weekly Chart) – Technical View
The weekly chart shows a descending trendline breakout attempt after several months of correction. Price has been consolidating inside the highlighted demand zone and is now testing the falling resistance line.
Key Observations
* Downtrend line is being challenged, indicating weakening bearish momentum.
* Multiple weekly candles have respected the ₹1,746–₹1,800 support zone, suggesting accumulation.
* Current close around ₹1,910.80 is near a crucial breakout area.
* RSI (20) at 50.9 has crossed above its moving average (45.8), signaling improving momentum.
* Volume has picked up during recent weeks, which is supportive of a breakout scenario.
Important Levels
Support
* ₹1,901 (immediate)
* ₹1,746 (major weekly support)
Resistance
* ₹1,947
* ₹1,976
* ₹2,057 (major breakout confirmation level)  Long
Long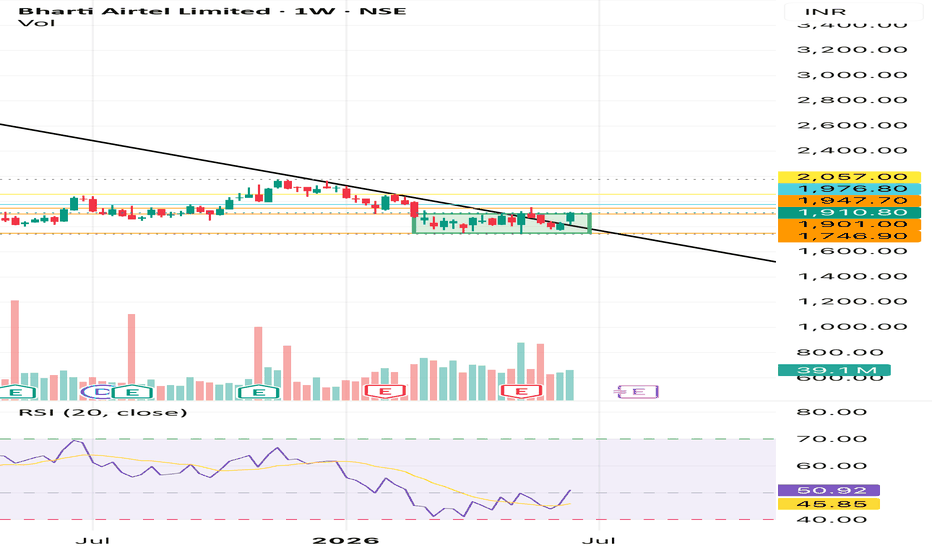
 Long
Long
GBPUSD — Bearish Continuation From EMA & Fibonacci Value Zone
Fundamental Analysis
GBPUSD remains under pressure as price continues to trade below the main EMA structure. For next week, traders should keep watching USD momentum, U.K. data, and broader risk sentiment.
For now, the technical structure still favours sellers while recovery attempts remain capped below EMA resistance.
Technical Analysis
On the 4H chart, GBPUSD is still moving inside a bearish structure, with EMA 34, EMA 89, and EMA 200 positioned above price. This confirms that the broader trend remains bearish.
Price recently broke below the strong support zone around 1.3305 - 1.3324 and continued lower toward 1.3170 - 1.3180. The current move looks like a short-term recovery after a strong bearish displacement, not a confirmed bullish reversal.
The key sell zone is around 1.3305 - 1.3324. This area is important because it combines the previous strong support, Fibonacci 0.5 retracement, EMA resistance, and the support-turned-resistance structure.
The second reaction area is around 1.3275 - 1.3285, near the Fibonacci 0.618 zone. This may offer a short-term sell scalping reaction if price fails to reclaim higher structure.
The main downside target for next week is around 1.3090 - 1.3089, which aligns with the lower bearish projection and liquidity target on the chart.
Important Key Levels
Current price area: 1.3228
Sell scalping zone: 1.3275 - 1.3285
Main sell zone: 1.3305 - 1.3324
EMA resistance area: 1.3305 - 1.3370
Strong support turned resistance: 1.3305 - 1.3324
Short-term downside level: 1.3180
Main weekly target: 1.3090 - 1.3089
Invalidation area: above 1.3370
Trading Scenario
Main Sell Scenario
Entry: 1.3305 - 1.3324
Stop Loss: 1.3370
Take Profit 1: 1.3180
Take Profit 2: 1.3140
Take Profit 3: 1.3090 - 1.3089
Sell Condition
The preferred setup is to wait for GBPUSD to pull back into the 1.3305 - 1.3324 sell zone. This area aligns with Fibonacci retracement, EMA resistance, and the previous support zone that has now turned into resistance.
A sell setup becomes more valid if price forms bearish rejection from this zone, such as a long upper wick, bearish engulfing candle, failed breakout, or lower high below the EMA structure.
If price rejects from the sell zone and breaks back below 1.3180, the bearish continuation view becomes stronger. The next downside focus would be 1.3140, followed by the weekly target around 1.3090 - 1.3089.
Alternative Sell Scalping Zone
Entry: 1.3275 - 1.3285
Stop Loss: 1.3325
Take Profit 1: 1.3228
Take Profit 2: 1.3180
Take Profit 3: 1.3140
Sell Condition
This is the earlier sell reaction zone. It is only valid if price reaches 1.3275 - 1.3285 and shows clear bearish rejection below the main EMA resistance.
If price breaks strongly above this zone, the better setup is to wait for the main sell zone around 1.3305 - 1.3324.
Entry Conditions
Wait for price to retest the Fibonacci sell zone.
Look for bearish rejection before entering sell.
A break below 1.3180 confirms stronger downside pressure.
If price breaks and holds above 1.3370, the sell setup is invalid.
Overall, the main view for next week remains bearish while GBPUSD stays below EMA 34, EMA 89, EMA 200, and the broken support structure. The preferred plan is to wait for a pullback into the Fibonacci and EMA value zone around 1.3305 - 1.3324, then look for sell confirmation toward 1.3180 and 1.3090 - 1.3089.
Do you share the same bearish view on GBPUSD for next week, or are you waiting for a cleaner rejection from the EMA and Fibonacci value zone?
EURUSD — Bearish Continuation From Fibonacci Value Zones
Fundamental Analysis
EURUSD remains under pressure as price trades below the main EMA structure. For next week, traders should continue watching USD momentum, Fed expectations, and upcoming U.S. data, as these factors may drive volatility around key Fibonacci zones.
For now, the technical structure still favours sellers while recovery attempts remain capped below EMA resistance.
Technical Analysis
On the 4H chart, EURUSD is still moving inside a descending structure. EMA 34, EMA 89, and EMA 200 remain above price, confirming that the broader trend is still bearish.
Price is currently around 1.1465 after a strong bearish move below the previous support area. The recovery has not confirmed a bullish reversal yet, and the chart shows clear sell zones above price.
The first key sell area is around 1.1490 - 1.1505, near the 0.618 Fibonacci reaction zone. This area may act as the first resistance if price creates a short-term pullback.
The stronger Fibonacci value sell zone is around 1.1518 - 1.1531. This zone aligns with the golden ratio area, previous support turned resistance, and the EMA pressure.
The higher sell swing zone is around 1.1565 - 1.1582. This is the stronger resistance zone on the chart and may offer another sell opportunity if price retraces deeper.
The main downside target for next week is around 1.1372, which aligns with the lower channel area and bearish projection on the chart.
Important Key Levels
Current price area: 1.1465
Sell zone 1: 1.1490 - 1.1505
Fibonacci golden ratio sell zone: 1.1518 - 1.1531
Sell swing resistance: 1.1565 - 1.1582
EMA resistance area: 1.1525 - 1.1582
Short-term downside target: 1.1481
Main weekly bearish target: 1.1372
Invalidation area: above 1.1582
Trading Scenario
Main Sell Scenario 1 — Fibonacci 0.618 Retest
Entry: 1.1490 - 1.1505
Stop Loss: 1.1535
Take Profit 1: 1.1465
Take Profit 2: 1.1418
Take Profit 3: 1.1372
Sell Condition
The first sell setup is to wait for EURUSD to pull back into 1.1490 - 1.1505. This zone aligns with the 0.618 Fibonacci reaction area and short-term broken structure.
A sell setup becomes more valid if price forms bearish rejection from this zone, such as a long upper wick, bearish engulfing candle, failed breakout, or lower high below the EMA structure.
Main Sell Scenario 2 — Golden Ratio Value Zone
Entry: 1.1518 - 1.1531
Stop Loss: 1.1582
Take Profit 1: 1.1481
Take Profit 2: 1.1418
Take Profit 3: 1.1372
Sell Condition
The second sell setup is stronger if EURUSD retraces deeper into 1.1518 - 1.1531. This is the main Fibonacci golden ratio zone and also aligns with the previous support/resistance area.
If price rejects from this zone and fails to reclaim the EMA range, sellers may regain control and continue the bearish move toward 1.1481, then 1.1372.
Entry Conditions
Wait for price to retest one of the Fibonacci sell zones.
Look for bearish rejection before entering sell.
A break below 1.1465 strengthens the bearish continuation view.
If price breaks and holds above 1.1582, the sell setup is invalid.
Overall, the main view for next week remains bearish while EURUSD stays below EMA 34, EMA 89, EMA 200, and the descending trendline. The preferred plan is to wait for a pullback into the Fibonacci value zones, then look for sell confirmation toward 1.1481 and the weekly target around 1.1372.
Do you share the same bearish view on EURUSD for next week, or are you waiting for a cleaner retest of the Fibonacci value zone?
 Long
Long
 Long
Long
 Long
Long
 Long
Long
HOW-TO: Trade Crude Oil Using Support & Resistance LevelsThis educational tutorial explains how support and resistance (S/R) levels are used to trade crude oil futures. S/R levels are one of the most reliable tools for oil trading because they provide exact price points for entries, exits, and stop-loss placement .
Markets: MCX Crude Oil, WTI, Brent
Timeframe: 15-minute to daily
Part 1: Why S/R Works for Crude Oil
Crude oil is highly volatile and sensitive to geopolitical events and OPEC+ decisions . This volatility creates strong reactions at key technical levels.
S/R levels are empirical — calculated by external indicators like pivot points, Fibonacci tools, and moving averages. They generate exact price points that leave little room for error .
Key Upsides of S/R in Oil Trading :
Precision: Exact price points below (support) and above (resistance) price
Market entry/exit: Ideal for identifying entry/exit points and profit targets
Complementary: Works well with momentum oscillators and fundamental data
Part 2: How S/R Levels Are Identified
Professional traders draw S/R using :
Methods:
Horizontal levels from swing highs and swing lows
Moving averages (dynamic support/resistance)
Trendlines
Fibonacci retracement levels
Pivot points
The Flip Zone Concept :
A resistance level, after a successful breakout, turns into support
A support level, after a breakdown, turns into resistance
This is called "Change of Polarity"
Part 3: The Three Trading Strategies
Strategy 1: Bounce from Support
Setup: Price approaches a key support zone
Entry: After bullish candle confirmation at support
Stop Loss: Below the support level
Target: Next resistance level
Best for: Range-bound markets
Strategy 2: Rejection from Resistance
Setup: Price approaches a key resistance zone
Entry: After bearish candle confirmation at resistance
Stop Loss: Above the resistance level
Target: Next support level
Best for: Range-bound markets
Strategy 3: Breakout/Flip Zone Trade
Setup: Price breaks through support or resistance with momentum
Entry: On retest of the flipped level (support becomes resistance, or resistance becomes support)
Stop Loss: Beyond the flip zone
Target: Next major S/R level
Best for: Trending markets
Part 4: Current Market Example
Current MCX Crude Setup :
Support: Near 5162-5165 (low of bullish Marubozu candle)
Resistance: 5280-5330-5400
Range-bound movement: Between short-term 10 and 20 DEMA lines without firm direction
What this tells a trader:
Multiple support levels at 5165-5150 offer a favorable risk-reward setup for bulls
Resistance is seen at 5280-5330-5400
Any close below 5130 would invalidate bullish view
Part 5: How to Place Orders
Pro Tip: Since there is a concentration of buyers and sellers at S/R levels, there is a lot of liquidity around these points. It is not wise to place orders right at the level — always keep a buffer .
Sample Trade Setups :
Buying Support: If price rejects several times from resistance and finally breaks out, wait for a successful retest of the flipped level before going long. This avoids fake breakouts.
Selling Resistance: If price breaks down through support, wait for a successful retest of the flipped level before going short. This avoids bear traps.
Disclaimer
This is for educational purposes only. Crude oil trading involves high risk. Past performance does not guarantee future results. Users are responsible for their own trading decisions.  Education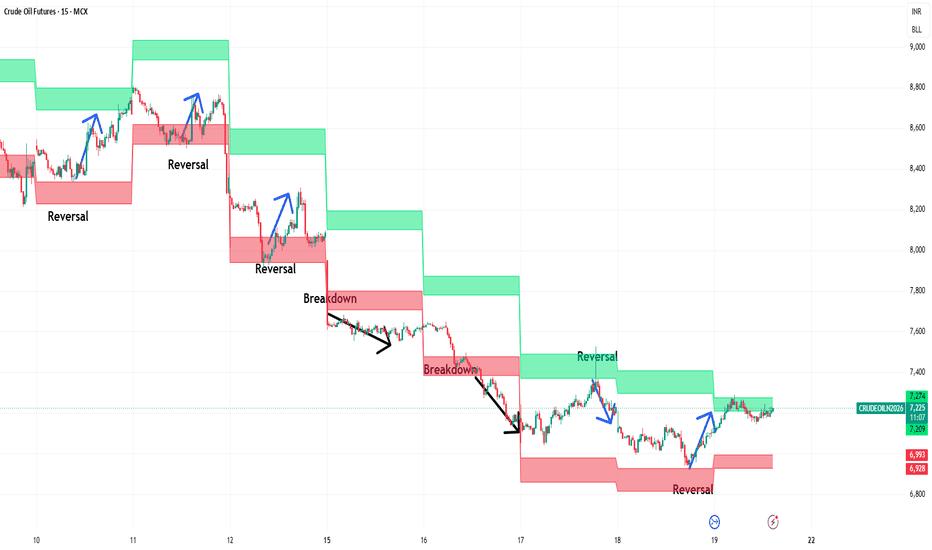
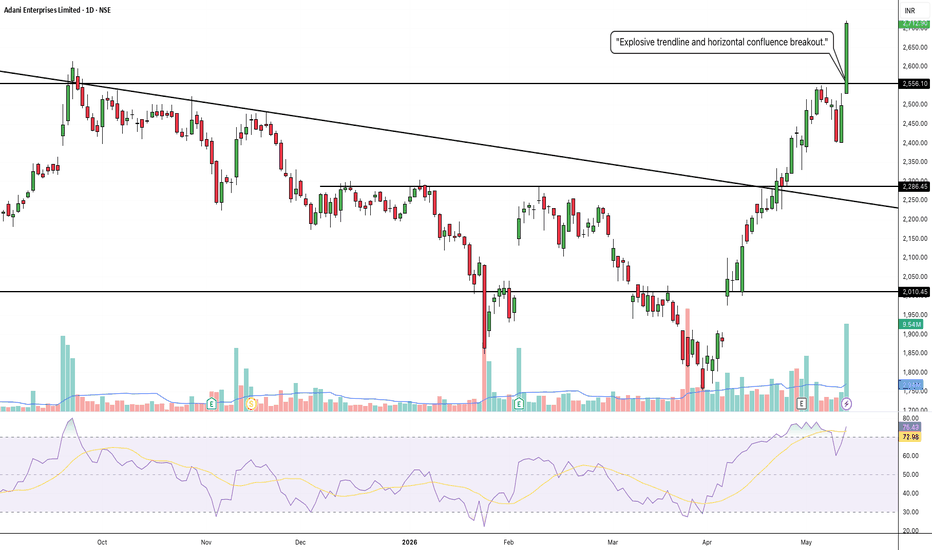
ADANIENT: Massive Trendline Break and Explosive Macro Breakout 1. The Macro Perspective: The Squeeze and The Floor
I am taking a LONG bias on Adani Enterprises Limited (ADANIENT) on the daily (1D) timeframe.
When analyzing pure market structure, the most violent reversals happen when a major descending trend is broken. Look at the structural development on the left half of this chart. The stock suffered a deep, agonizing markdown phase, with every attempted rally being aggressively swatted down by that massive descending black trendline. This brutal correction successfully washed out weak hands, eventually establishing a rock-solid floor around the 1,800 zone.
2. The Educational Setup: Conquering the Confluence
To understand the sheer strength of this current breakout, look at how the price systematically transitioned from a downtrend back into a markup phase:
The Trendline Break: The first major signal of institutional accumulation was the aggressive push through the descending trendline. The stock didn't just break it; it blasted through and used the 2,286.45 horizontal line as a mid-level stepping stone to build a higher launchpad.
The High-Level Squeeze: After conquering the trendline, the stock marched directly up to the ultimate macro ceiling at the solid black 2,556.10 line. Instead of suffering a massive double-top rejection, buyers aggressively defended the structure, absorbing supply and forming a tight consolidation flag right beneath the resistance. This high-level absorption acts like a pressure cooker, transferring millions of shares to strong-handed buyers.
3. Current Price Action: The Lid Blows Off
Look at the most recent daily candles on the far right. The pressure cooker has absolutely exploded. Buyers have effortlessly shattered the 2,556.10 macro ceiling with a violent, near-vertical momentum thrust, pushing the price above 2,700. Furthermore, look at the RSI indicator on the bottom panel. It is trading strongly in the bullish zone (mid-70s), confirming that the momentum expansion is completely validated by buying pressure. The prolonged markdown phase is officially dead; a brand-new macro markup phase has begun.
4. The Trade Plan: Entries, Targets, and Risk Management
Entry Strategy: Momentum is exceptionally strong right now near 2,712.90. Chasing a massive daily expansion candle always carries a higher risk of an immediate intraday drawdown as the stock naturally breathes. The highest-probability, lowest-risk entry involves stepping down to an hourly timeframe and placing limit orders to catch a potential minor structural pullback to perfectly retest the 2,550.00 to 2,600.00 breakout zone. Letting that massive historical resistance prove itself as a new, indestructible support floor offers a phenomenal risk-to-reward ratio.
Take Profit (Targets): We use measured structural targets based on the depth of the macro base. By taking the depth of the massive recovery (roughly 750 points from the ~1,800 floor to the 2,556.10 ceiling) and projecting it upward from the breakout line, our primary structural macro target sits comfortably in the 3,250.00 to 3,300.00 zone. The massive 3,000.00 century mark will act as the immediate psychological magnet.
Invalidation (Stop Loss): A trade thesis is only valid if the new market structure holds. A hard stop loss should be placed safely below the high-level flag and recent swing lows, around the 2,350.00 to 2,400.00 level. A definitive daily close completely back below the 2,286.45 mid-level pivot would act as a massive warning sign of a failed structural breakout and a severe bull trap.
5. Time Horizon:
Because this technical setup is built on a 1-Day chart capturing a massive trendline reversal and macro ceiling breakout, this is a short-to-medium-term swing trade designed to capture the explosive markup phase. Let the new trend run!  Long
Long