USOIL Analysis on (02 AUG 2026)#USOIL UPDATEDE
CURRENT PRICE - 84.589
If price stay above 80.000, then next target 86.000,90.000 and 93.500 and below that 77.800
Plan;If price break 83.500-83.000 area,and stay above 83.500,we will place sell order in USOIL with target of 86.000,90.000 and 93.500 & stop loss should be placed at 80.000
Trend Lines
NIFTY –Holding Above Trendline,Eyes on the Descending ResistanceOverview
Nifty closed the week at 24,383.60, up 616 points or 2.59%. The index made a strong move this week, closing well above last week's high and staying above the weekly 50 EMA at 24,354.78. Price is now sitting right at the descending resistance line that has been capping every rally since February.
Pattern Explanation
If we look at the chart, Nifty has been respecting a rising trendline since late March, with each dip getting bought around that line. A couple of weeks back, we saw a cle
Nifty Intraday Analysis for 31st July 2026NSE:NIFTY
Range bound moment is expected between 24200 - 24525 range.
The upward movement may lead to 24525 – 24575 resistance range and if the index crosses and sustains above this level then may reach near 24800 – 24850 range.
On the contrary, The downward moment may drag the Index to 24100 – 24050 support range in downward momentum and if this support is broken then index may tank near 23850 – 23800 range.
Banknifty Intraday Analysis for 31st July 2026NSE:BANKNIFTY
Index is near 57300 - 57400 resistance zone and if the Index breaks and sustains above this zone.
The upward moment may lead the Index to 57900 – 58000 resistance range in upward momentum and if the index crosses and sustains above this level then may reach near 58600 – 58700 range.
On the contrary, The downward moment may drag the Index to 56400 – 56300 support range in downward momentum and if this support is broken then the index may tank near the 55700 – 55600 range.
Finnifty Intraday Analysis for 31st July 2026NSE:CNXFINANCE
Uptrend is expected to continue as long as the Index is above 26200.
The upward movement may lead the Index to 26500 - 26550 resistance range and if the index crosses and sustains above this level then may reach near 26800 - 26850 range.
On the contrary, The downward moment may drag the to 26000 – 25950 support range and if this support too is broken then index may tank near 25700 – 25650 range.
Midnifty Intraday Analysis for 31st July 2026NSE:NIFTY_MID_SELECT
Uptrend is expected to continue as long as the Index is above 14600.
The upward movement may lead the Index near 14825 – 14850 resistance range and if the index crosses and sustains above this level then may reach 15000 – 15025 range.
On the contrary, The downward moment may drag the index to 14525 – 14500 support range and if this support is broken then index may tank near 14350 – 14325 range.
Gold(XAUUSD) Ready for breakout ??After yesterday's retest of 4120, price has retraced back till 4070, now taking support and trying to bounce-back, bullish structure intact, immediate resistance is at 4088 strong resistance is at 4120 if breached then expect the retest of 4166, and immediate support is at 4065, if taken out the very likely to retest 3995.
Acting according to the levels mentioned is the best way to move forward today. This seems like a critical point of trend transitioning may take some times to evolve & beware
XAUUSD — 4,106 Is the Real TestGold is trying to recover, but the market is now entering the area where buyers need to prove real strength.
Price reacted from the 4,072 Fibo buy zone and pushed back toward the short-term resistance area.
This bounce looks clean.
But it is still happening below the downtrend line.
That is why I do not want to call this a full bullish reversal yet.
The simple read
Gold is currently trading around 4,080 - 4,090.
The most important level above is 4,106.
This is the order sell / downtrend
cyient is on disocunt price ready to FLY cyient is on disocunt price and for investors and have potencial to go on top
hold some technical points
1- have strong support zone at 820 to 800
2- Trend line breakout at 860
3 - holnding time based trendline one big zone
4- holding hook pattern and after breakout convert in rounding bottom reversal
5- stong supply zone and resitance at 980 to 1000
6- cup complete at 1500
life time high 2366 may be in next few year we reached that point
cyient buy at 860 TRG 1000/1220/1520/1800/2000 S
XAUUSD — FOMC Spike or Real Breakout?Gold reacted strongly after the FOMC release, creating a fast bullish move from the lower support area.
But after a news-driven move, the real question is never only “how strong was the candle?”
The real question is:
Can price hold the structure after the volatility?
Right now, gold is trading around 4,075 - 4,085 after rejecting near the descending trendline and the 4,109 resistance zone.
This is a very important area.
Because if buyers cannot reclaim 4,109, the move may simply be a post-
Nifty Intraday Analysis for 30th July 2026NSE:NIFTY
Uptrend is expected to continue as long as the Index is above 24200 - 24150 support zone. However, global uncertainty and volatility may result in gap down opening.
The upward movement may lead to 24450 – 24500 resistance range and if the index crosses and sustains above this level then may reach near 24700 – 24750 range.
On the contrary, The downward moment may drag the Index to 24050 – 24000 support range in downward momentum and if this support is broken then index may tank
Banknifty Intraday Analysis for 30th July 2026NSE:BANKNIFTY
Index is near 57300 - 57400 resistance zone and if the Index breaks and sustains above this zone. However, global uncertainty and volatility may result in gap down opening.
The upward moment may lead the Index to 58000 – 58100 resistance range in upward momentum and if the index crosses and sustains above this level then may reach near 58700 – 58800 range.
On the contrary, The downward moment may drag the Index to 56500 – 56400 support range in downward momentum and if this su
Finnifty Intraday Analysis for 30th July 2026NSE:CNXFINANCE
Uptrend is expected to continue as long as the Index is above 26200. However, global uncertainty and volatility may result in gap down opening.
The upward movement may lead the Index to 26550 - 26600 resistance range and if the index crosses and sustains above this level then may reach near 26850 - 26900 range.
On the contrary, The downward moment may drag the to 26025 – 25975 support range and if this support too is broken then index may tank near 25700 – 25650 range.
Midnifty Intraday Analysis for 30th July 2026NSE:NIFTY_MID_SELECT
Uptrend is expected to continue as long as the Index is above 14600. However, global uncertainty and volatility may result in gap down opening.
The upward movement may lead the Index near 14850 – 14875 resistance range and if the index crosses and sustains above this level then may reach 15025 – 15050 range.
On the contrary, The downward moment may drag the index to 14525 – 14500 support range and if this support is broken then index may tank near 14350 – 14325 range
Bitcoin structure, bearishness to continue??The up-swing which was started on 1st July, has already taken resistance from 66950 and has changed its direction and currently correcting in the bearish direction, we have spotted a declining channel which is getting respected by price, getting rejections form the upper boundary, currently after breaking below 63640 price has kept the bearish structure intact, we are expecting a further decline on the bitcoin an retest of ~61500 in near future if this declining channel sustains.
Immediate supp
Another trap in making! GAP DOWN!?As we can see NIFTY showed strong upmove after opening strong but we are still below the important supply zone of 24600 levels. Though it has managed itself to close above the trendline resistance, but we havent got the weekly closing yet. Hence, following the global cues, we may see NIFTY opening weak. Hence until we see NIFTY closing above 24600 and trendline in weekly time frame! every rise can be sold. So, plan your trades accordingly and keep watching everyone.
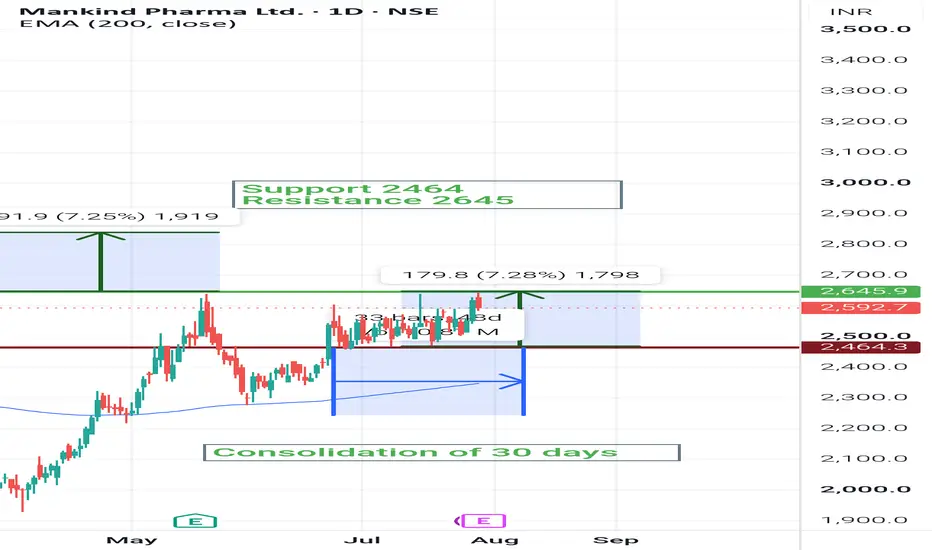
Mankind Pharma day : 29 julyMankind Pharma under consolidation,
Price range 2460-2640.
Which is of approximate 180 rs and 8%.
Once a breakout or a breakdown happens we may see same move either side.
Looking at trend chances that it will break at higher side.
Disclaimer: charts are for educational purposes.
Investment should be sole and based on self due diligence.
Charts and technical are not a guarantee of price movement..
Thanks
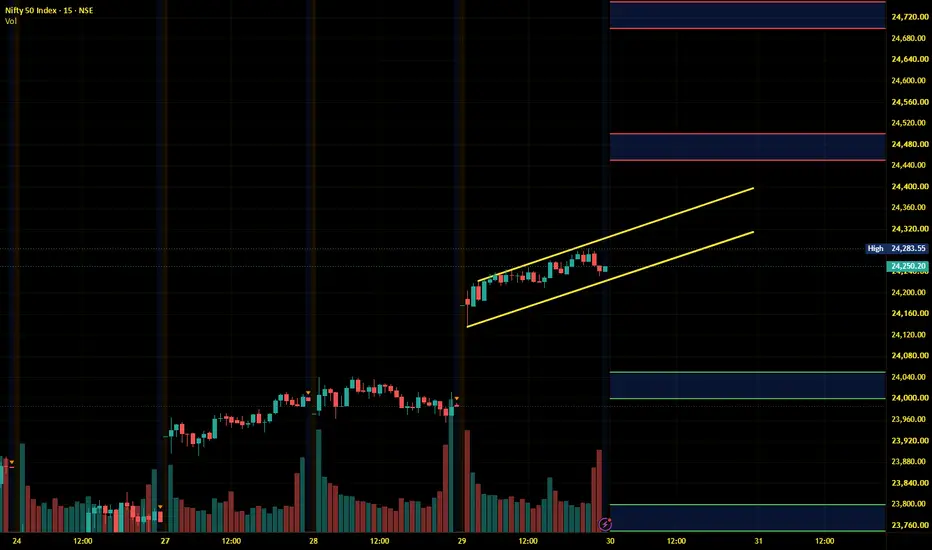
Nifty Intraday Analysis for 29th July 2026NSE:NIFTY
Index is near make or break 24000 level which is having highest Call and Put OI.
The upward movement may lead to 24200 – 24250 resistance range and if the index crosses and sustains above this level then may reach near 24450 – 24500 range.
On the contrary, The downward moment may drag the Index to 23775 – 23725 support range in downward momentum and if this support is broken then index may tank near 23500 – 23450 range.
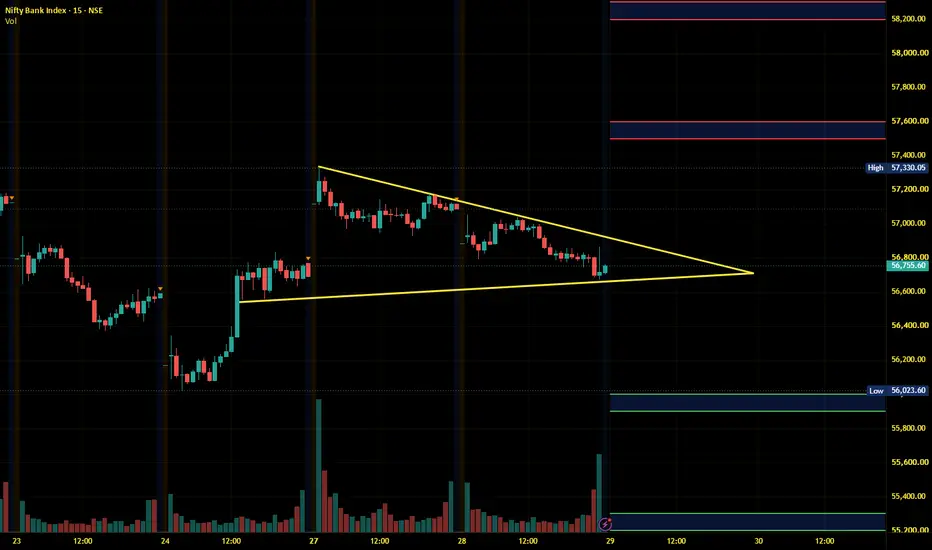
Banknifty Intraday Analysis for 29th July 2026NSE:BANKNIFTY
Index is at support and upside reversal is expected.
The upward moment may lead the Index to 57500 – 57600 resistance range in upward momentum and if the index crosses and sustains above this level then may reach near 58200 – 58300 range.
On the contrary, The downward moment may drag the Index to 56000 – 55900 support range in downward momentum and if this support is broken then the index may tank near the 55300 – 55200 range.
Finnifty Intraday Analysis for 29th July 2026NSE:CNXFINANCE
Index is near 26000 - 25950 support range and which is expected to be respected.
The upward movement may lead the Index to 26300 - 26350 resistance range and if the index crosses and sustains above this level then may reach near 26600 - 26650 range.
On the contrary, The downward moment may drag the to 25750 – 25700 support range and if this support too is broken then index may tank near 25450 – 25400 range.
Midnifty Intraday Analysis for 29th July 2026NSE:NIFTY_MID_SELECT
Index is near 14500 support which is expected to be respected.
The upward movement may lead the Index near 14700 – 14725 resistance range and if the index crosses and sustains above this level then may reach 14875 – 14900 range.
On the contrary, The downward moment may drag the index to 14375 – 14350 support range and if this support is broken then index may tank near 14200 – 14175 range.
Gold is still trading inside a bearish short-term structureXAUUSD — 4,038 Trap or 3,989?
After losing the previous triangle support, price continued to move lower and is now reacting around 4,030.
At first look, this bounce may look interesting.
But the chart is still not clean for buyers yet.
Why?
Because gold is still below the broken structure, below the descending pressure, and very close to the next OB Sell Zone around 4,038.
The simple read
Gold is currently testing the 4,030 - 4,038 reaction area.
If price reaches 4,038 and rejects, selle
Cochin Shipyard: Multi-Year Support TestOverview
Cochin Shipyard is currently testing a long-term trendline support around 1,200–1,250, with the weekly 200 EMA sitting right in this zone too. Before treating this as a simple "buy the dip" opportunity, it's worth digging into the fundamentals — and the picture here is more cautious than it first appears.
What's Happening on the Chart
Price has pulled back sharply from its highs and is now testing a long-term rising trendline that's held since the stock's early years. The weekly 200
We might see continuation of the fall below 23950 level!As we can see NIFTY got rejected exactly from our discussed supply zone, as expected. But NIFTY can still show signs of bullishness but we will get rejected eventually as there are many resistances in the form of trendline and demand zone that would hinder NIFTY to move unidirectionally, so we cannot confirm bullishness until NIFTY closes itself above 25600 level. Till then we may see NIFTY being volatile to negative. So, plan your trades accordingly and keep watching everyone.