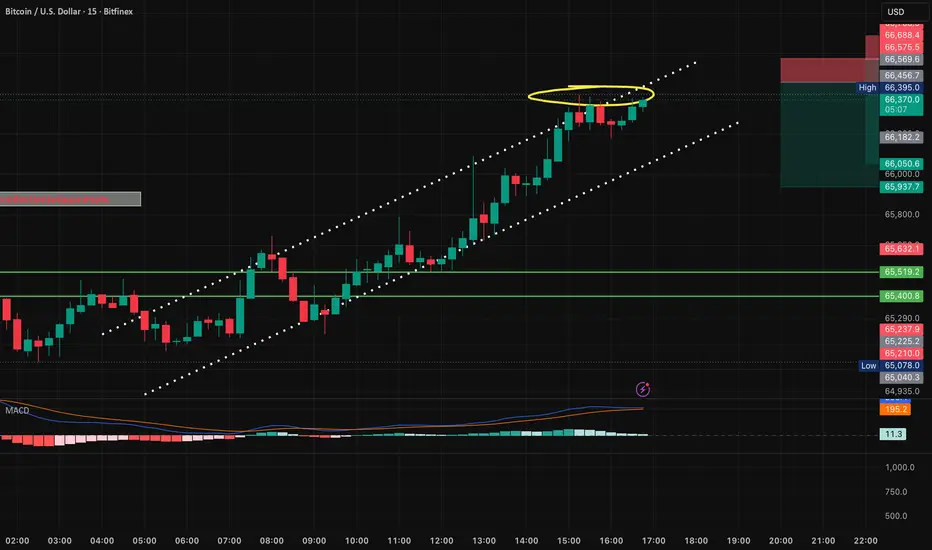
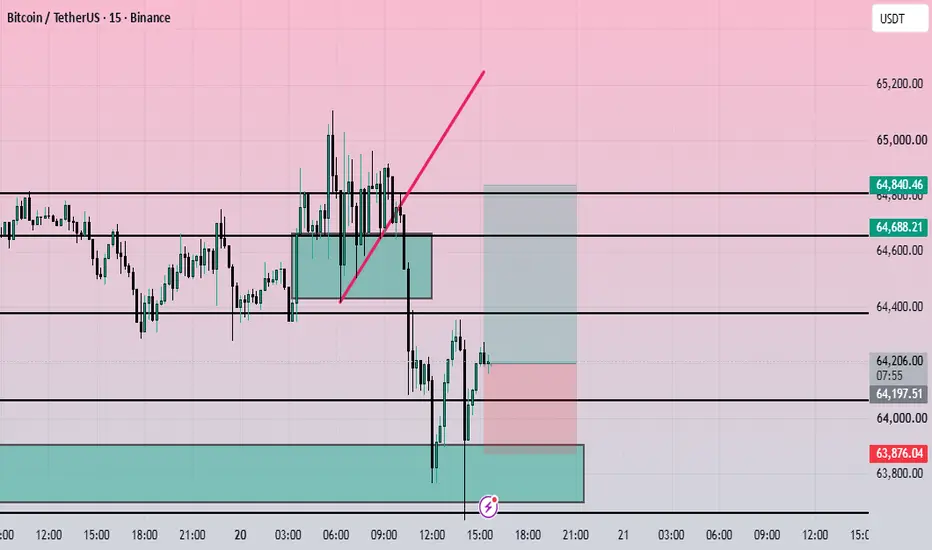
BTCUSDTShort: BTC Entry: 66456 SL. : 66575.5 TP. : 65937.7 There are two commands for everyone to take a look at.Shortby kulykiulyab0
XAUUSD: Bullish Displacement Leaves an FVG, 4,120 Next TargetPrice has recently displaced higher from the lower part of the range, leaving behind an imbalance around the 4,035–4,045 area (FVG). My expectation is not for price to immediately move straight to the upside target. Instead, I am watching for a possible retracement into the FVG. If the imbalance holds as support and bullish order flow remains intact, I will then expect price to continue expanding higher to $4,120Longby EmpressBTC0
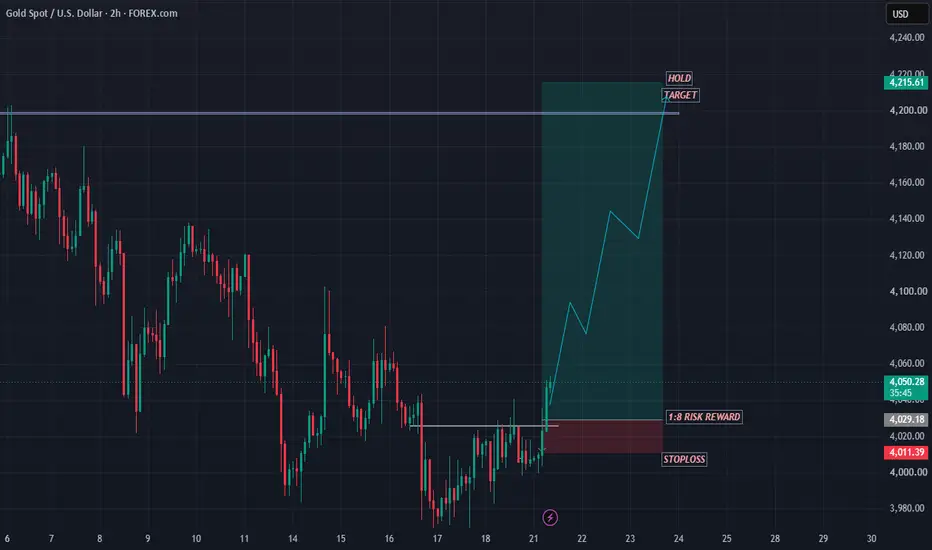
GOLD SHOWING A GOOD UP MOVE WITH 1:8 RISK REWARD GOLD SHOWING A GOOD UP MOVE WITH 1:8 RISK REWARD DUE TO THESE REASON A. its following a rectangle pattern that stocked the market which preventing the market to move any one direction now it trying to break the strong resistant lable B. after the break of this rectangle it will boost the market potential for break C. also its resisting from a strong neckline the neckline also got weeker ald the price is ready to break in the outer region all of these reason are indicating the same thing its rLongby tradergyan0115
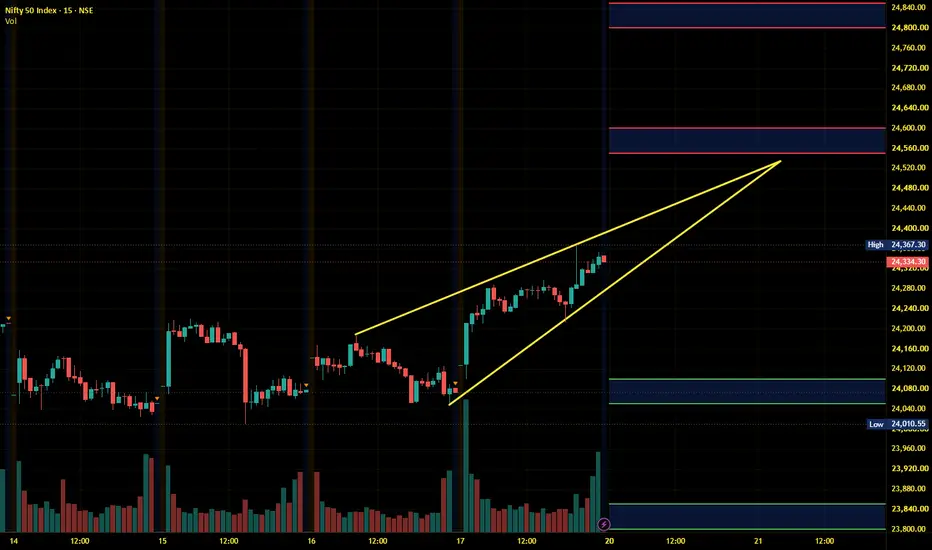
And the volatility continues..As we can see NIFTY again opened weak and remained sideways throughout the day. We clearly analysed that until and unless NIFTY breaks and sustains either of the mentioned levels, it would likely remain volatile. So keep a close watch of these levels and plan your trades accordingly.by Kaushalfin2
Nifty Intraday Analysis for 20th July 2026NSE:NIFTY Volatility is expected in the index due to mixed results from banking sector stocks as well as RIL. The upward movement may lead to 24550 – 24600 resistance range and if the index crosses and sustains above this level then may reach near 24800 – 24850 range. On the contrary, The downward moment may drag the Index to 24100 – 24050 support range in downward momentum and if this support is broken then index may tank near 23850 – 23800 range. by RKMAURYAUpdated 3
Banknifty Intraday Analysis for 20th July 2026NSE:BANKNIFTY Volatility is expected in the index due to mixed results from banking sector stocks. The upward moment may lead the Index to 59200 – 59300 resistance range in upward momentum and if the index crosses and sustains above this level then may reach near 60000 – 60100 range. On the contrary, The downward moment may drag the Index to 57800 – 57700 support range in downward momentum and if this support is broken then the index may tank near the 57100 – 57000 range. by RKMAURYAUpdated 1
Finnifty Intraday Analysis for 20th July 2026NSE:CNXFINANCE Volatility is expected in the index due to mixed results from banking sector stocks. The upward movement may lead the Index to 27150 - 27200 resistance range and if the index crosses and sustains above this level then may reach near 27450 - 27500 range. On the contrary, The downward moment may drag the to 26650 – 26600 support range and if this support too is broken then index may tank near 26350 – 26300 range. by RKMAURYAUpdated 1
Midnifty Intraday Analysis for 20th July 2026NSE:NIFTY_MID_SELECT Index is near resistance and if the index sustain above 14750 then - The upward movement may lead the Index near 14875 – 14900 resistance range and if the index crosses and sustains above this level then may reach 15050 – 15075 range. On the contrary, The downward moment may drag the index to 14575 – 14550 support range and if this support is broken then index may tank near 14400 – 14375 range. by RKMAURYAUpdated 2
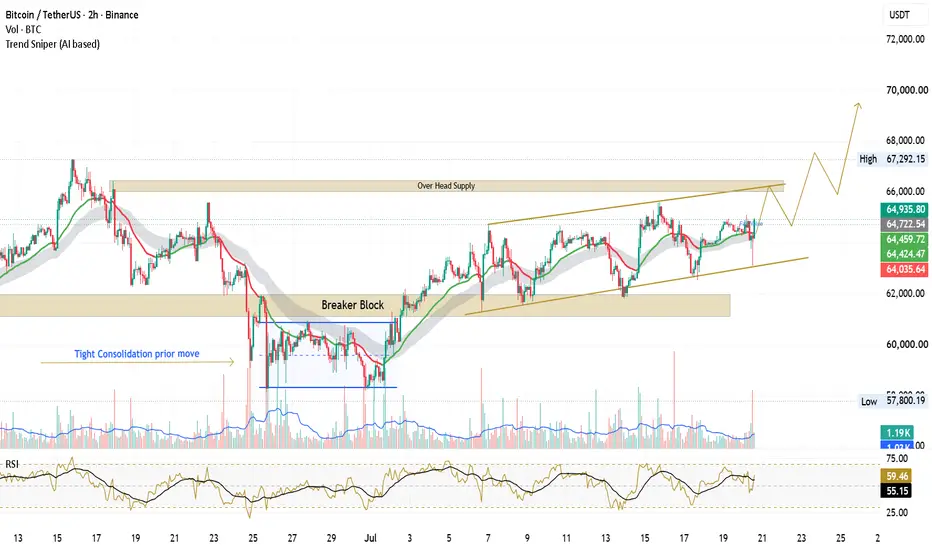
BTCUSDT: Ascending Structure Meets Major Supply Zone – Breakout BINANCE:BTCUSDT BTCUSDT is approaching a significant overhead supply zone after maintaining a series of higher lows within an ascending structure on the 2H timeframe. A previous breaker block has successfully acted as support, reinforcing the current bullish market structure. The recent consolidation near resistance suggests buyers are absorbing supply, but confirmation is still required before assuming a sustained breakout. Key observations: * Price continues to respect the ascending trenLongby KingDoxa_trades5
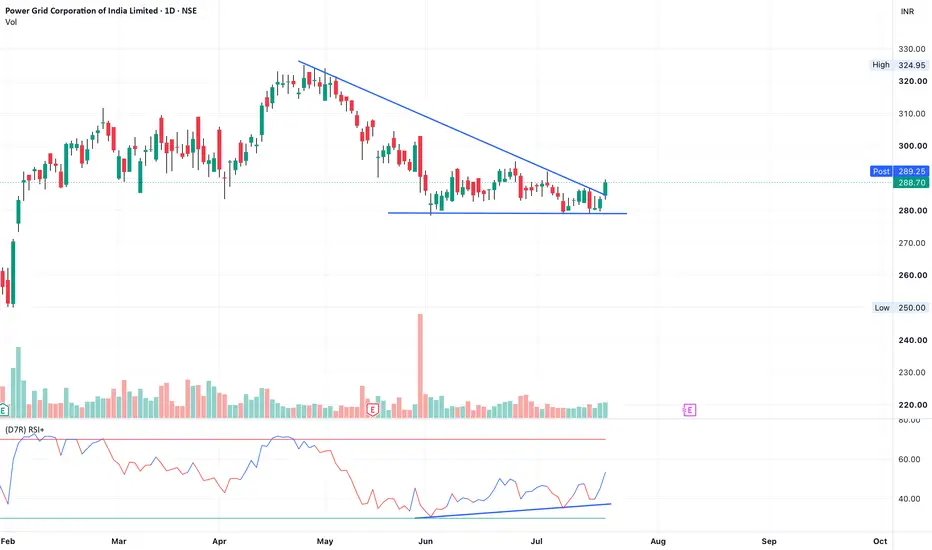
PowerGrid - RSI Bullish DivergencePowergrid has shown up move based on RSI bullish divergence. What this means is, the price was at the same level but the RSI was making higher lows. This is a long setup. Moreover, the price has broken descending triangle. Note: I am not a registered SEBI member. Hence, please do not consider this as an investment advice. This is just for educational purposes. Longby kalyanganguly1
BTCUSDT LONGPair taking support on the Bullish fvg after falling. Might show some upside move.Longby advancedleg81081
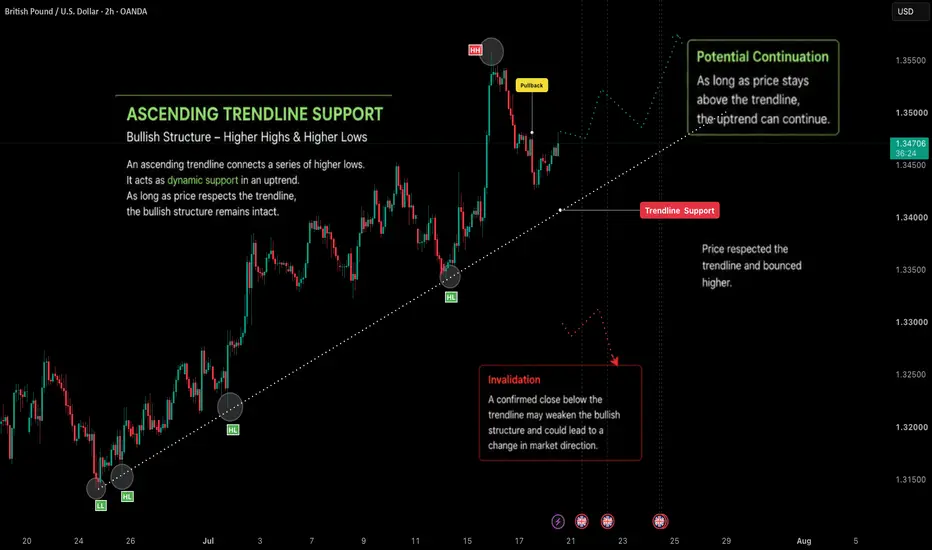
Ascending Trendline Support📌 Overview An Ascending Trendline is a technical analysis tool used to identify a series of higher lows during an uptrend. In this chart, price has respected the trendline multiple times, indicating that buyers have continued to defend the rising support area. The latest bounce from the trendline suggests that the current bullish structure remains intact while price stays above this dynamic support. ___________________________________________________________ 📘 Definition An Ascending TrendLongby MarketAlgoBot5
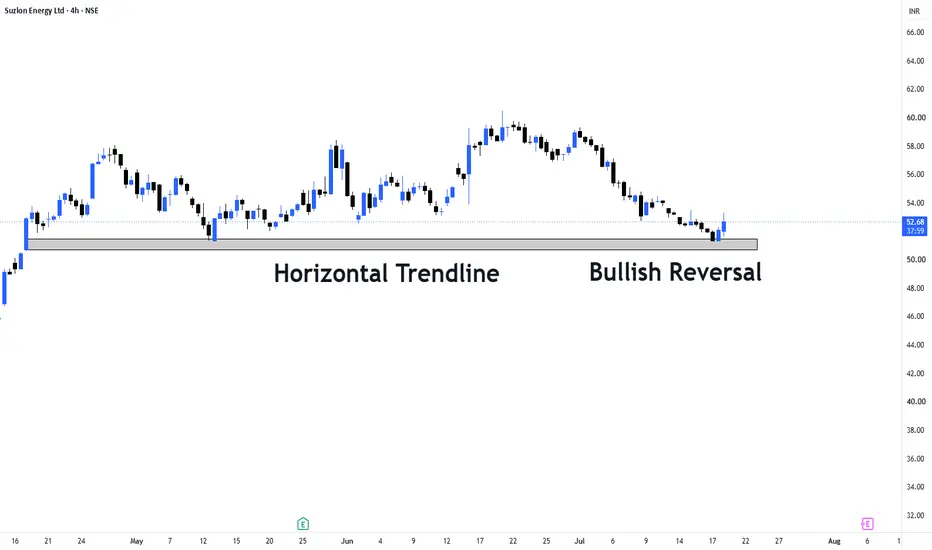
Suzlon Energy Stock Analysis , Bullish ReversalA horizontal support zone repeatedly attracted buyers. The rebound from this level confirms a bullish reversal, indicating renewed buying interest and improving price strength. Possible upper side targets : 57.50 | 61.20 | 68.00Longby shailendrasinh_vadha19
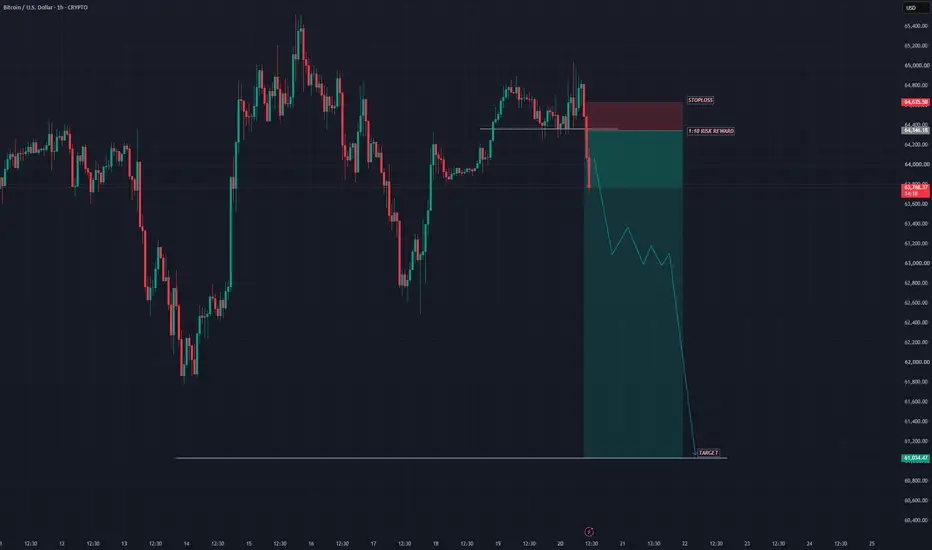
BTCUSD SHOWING A GOOD DOWN MOVE WITH 1:10 RISK REWARD BTCUSD SHOWING A GOOD DOWN MOVE WITH 1:10 RISK REWARD DUE TO THESE REASON A. its following a rectangle pattern that stocked the marketwhich preventing the market to move any one direction now it trying to break the strong resistant lable B. after the break of this rectangle it will boost the market potential for breakC. also its resisting from a strong neckline the neckline also got weeker ald the price is ready to break in the outer region all of these reason are indicating the same thing itShortby tradergyan015
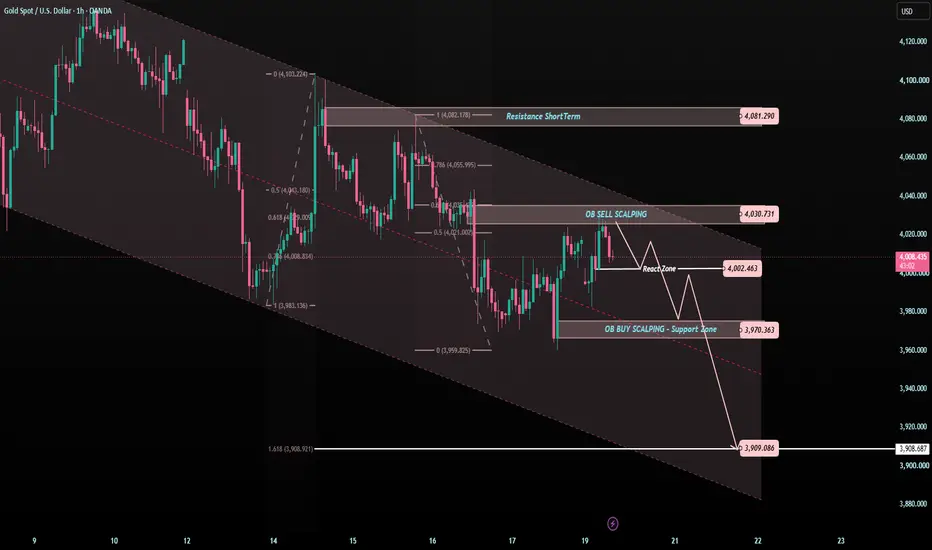
XAUUSD — 4,030 Is the Trap Zone?Gold is still moving inside the descending price channel. Price is trading around 4,010 after reacting from the lower area, but the recovery is not clean yet. Why? Because gold is now moving into the first sell reaction zone, while the larger structure is still under bearish pressure. For me, today’s chart is not about chasing the bounce. It is about watching whether 4,030 becomes a trap for buyers. The simple read Gold is still cautious while price stays below 4,030. The 4,030 area is the OBShortby Tiara_PrimeGold211
MASON XAUUSD – Key Support And Resistance SetupXAUUSD is trading around 4,010 after recovering from the lower support area, but price is still moving below the main descending trendline. The short-term reaction shows buyers are defending the support zone, but the broader structure still needs confirmation before a stronger bullish move can be trusted. The priority plan is to trade from strong support and resistance zones, with sell pressure still favoured if gold rejects from the upper Fibonacci resistance areas. Technical View Gold is curLongby Mason_Drake12
Mazagon Dock (MAZDOCK) — Second Test of the 0.786 Fib ZoneOverview Mazagon Dock has pulled back hard from its highs, and price is now testing an important support zone for the second time. Let's look at what's happening and what to watch for. What's Happening The stock had a strong run from 1,926 all the way up to 3,775, and has been falling back since then. Right now, price is sitting at the 0.786 Fib level (2,321.90) — and this is actually the second time it's come down to test this exact zone. That matters. A level that gets tested once and holds by Hkd887
Investing:Nifty IT is looking good for long term accumulation!If you have been following the tech related news lately, it has been about the new AI "revolutionary" tool named Anthropic. And the same is visible on charts of Nifty IT. TCS is available at a price at which it was trading in December 2020. Infy has just broke a crucial support. Wipro has always been the weakest of 3. So what next? My opinion is that the fall is now almost in the end stage. The accumulation has already started on Friday as we have seen some good recovery by end of the day. Longby chartistameyUpdated 431
Is it the time for CDSL consolidation breakout?CDSL has been consolidating in a descending triangle pattern since last 1.5 years. Stock is looking ripe for a breakout now as volumes have started to rise. This stock is driven mostly by the how the money flow happens in capital markets. If the inflow in Nifty starts in next few months, we might see a new ATH in this stock as well. Let's see whether the breakout sustains or fails. Only time can tell. Stock is expensive at current valuation which should also be considered. This idea is not a reLongby chartistamey2
XAUUSD — Bearish Continuation Toward Fibonacci Target Fundamental Analysis Gold remains sensitive to USD momentum, Treasury yields, and upcoming U.S. macro data. For next week, the technical bias still leans bearish while price stays below the major descending structure. Technical Analysis On the 4H chart, XAUUSD is trading around 4,017 after losing momentum under the downtrend trendline. The nearest sell reaction zone is around 4,050 - 4,070, where price may retest the Fibonacci sell area before another downside move. If this zone rejects priceShortby XAU_Macro_Pulse1
MASON XAUUSD – Medium-Term Recovery Setup Gold is trading around 4,017 after reacting near the lower part of the descending channel. The main medium-term idea for next week is a bullish correction, but confirmation is still needed because price remains inside the larger bearish channel. Technical View On the H4 chart, gold is still moving inside a wide descending channel, but price is now reacting from the lower channel area and liquidity zone. This suggests sellers may start losing momentum in the short term. The recent structure Longby Mason_Drake2
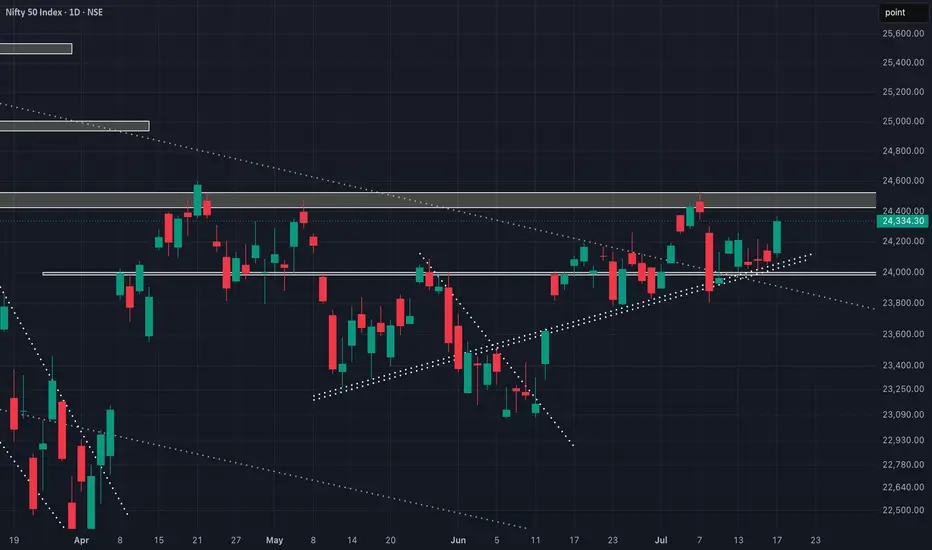
NIFTY still in a range!! NOT YET CONFIRMED!As we can see NIFTY is still in the range despite the strong upmove. Going by our analysis we can still see NIFTY has not broke the important supply zone and psychological level of 24500, which could hinder NIFTY from continuing its bullishness. Hence we can expect NIFTY to remain sideways and bulllishness will only be confirmed if NIFTY manages to close above the mentioned supply zone. So, plan your trades accordingly and keep watching everyone.by Kaushalfin1
Nifty Intraday Analysis for 17th July 2026NSE:NIFTY Index is near 24000 support and if it could not sustain then - The downward moment may drag the Index to 23850 – 23800 support range in downward momentum and if this support is broken then index may tank near 23600 – 23550 range. On the contrary, The upward movement may lead to 24300 – 24350 resistance range and if the index crosses and sustains above this level then may reach near 24550 – 24600 range. by RKMAURYAUpdated 2
Banknifty Intraday Analysis for 17th July 2026NSE:BANKNIFTY Index is near 57250 support and if it could not sustain then - The downward moment may drag the Index to 56900 – 56800 support range in downward momentum and if this support is broken then the index may tank near the 56100 – 56000 range. On the contrary, The upward moment may lead the Index to 58300 – 58400 resistance range in upward momentum and if the index crosses and sustains above this level then may reach near 59100 – 59200 range. by RKMAURYAUpdated 2
 ShortShort
 LongLong


 Long
Long LongLong
 Long
Long LongShortShortLong

 Long
Long LongShortLong