Trend Lines
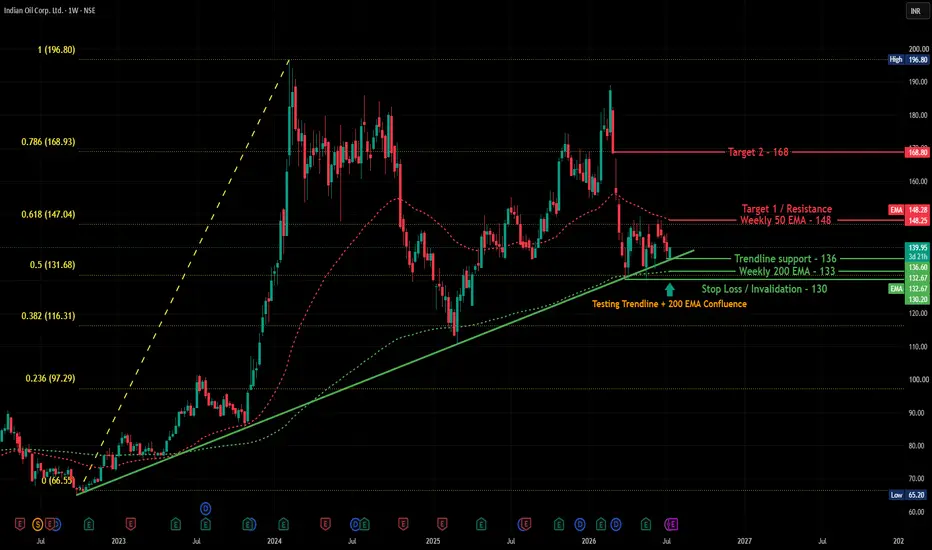
IOC Trendline Support Holds, Valuation Backs the Technical StoryOverview
Indian Oil Corporation is holding right at a confluence of technical support on the weekly chart, while also trading at valuations that stand out favorably against its refining peers. This is a good example of technical and fundamental pictures lining up — worth examining both together.
Technical Structure
On the weekly chart, IOC is trading at 139.95 (+0.71%), sitting right on a rising trendline support (~136) that has held since the 2022 lows, with the Weekly 200 EMA (132.67) just be
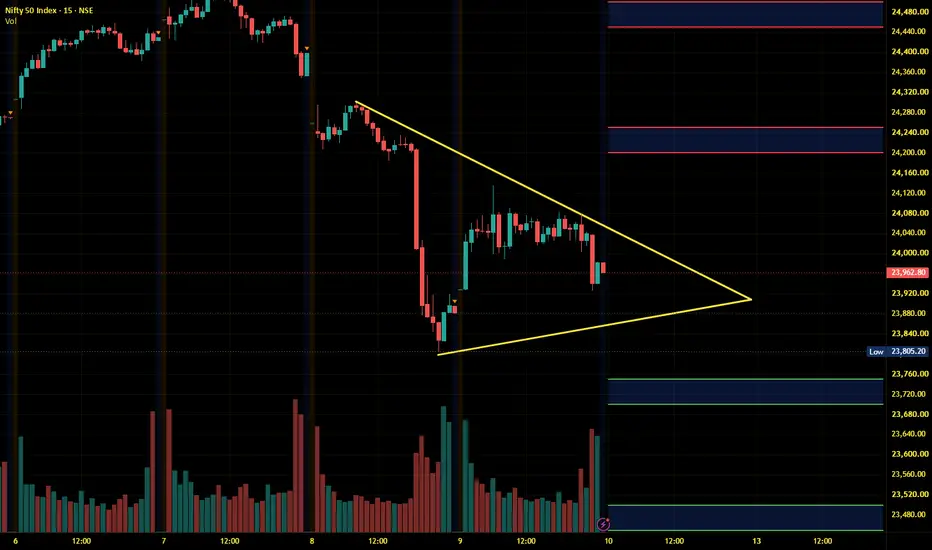
Nifty Intraday Analysis for 13th July 2026NSE:NIFTY
Market volatility will surge as global indices open lower due to escalating US-Iran tensions, the threatened closure of the Strait of Hormuz, and soaring crude prices. Any positive diplomatic news to de-escalate the conflict will sharply boost sentiment, whereas further escalation will deepen the sell-off.
The downward moment may drag the Index to 23950 – 23900 support range in downward momentum and if this support is broken then index may tank near 23700 – 23650 range.
On the c
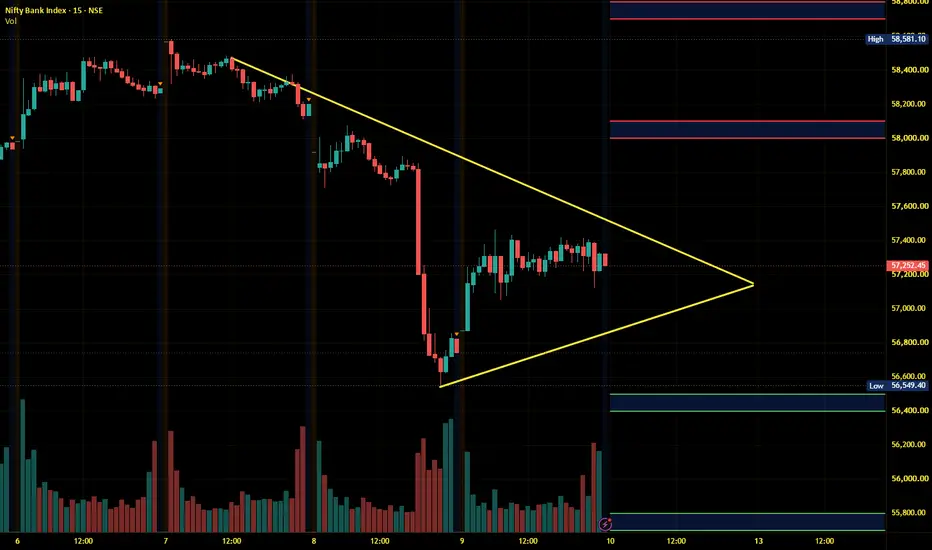
Banknifty Intraday Analysis for 13th July 2026NSE:BANKNIFTY
Market volatility will surge as global indices open lower due to escalating US-Iran tensions, the threatened closure of the Strait of Hormuz, and soaring crude prices. Any positive diplomatic news to de-escalate the conflict will sharply boost sentiment, whereas further escalation will deepen the sell-off.
The downward moment may drag the Index to 57300 – 57200 support range in downward momentum and if this support is broken then the index may tank near the 56600 – 56500 range
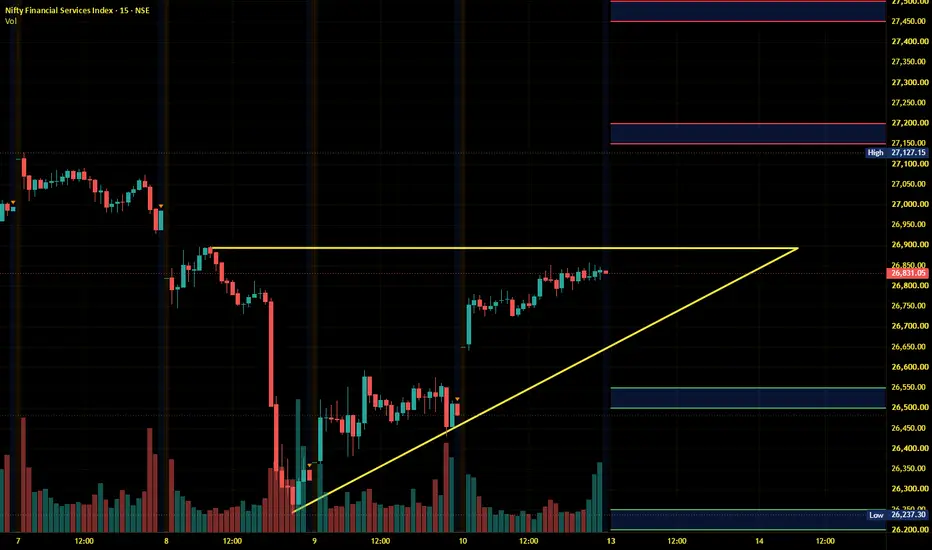
Finnifty Intraday Analysis for 13th July 2026NSE:CNXFINANCE
Market volatility will surge as global indices open lower due to escalating US-Iran tensions, the threatened closure of the Strait of Hormuz, and soaring crude prices. Any positive diplomatic news to de-escalate the conflict will sharply boost sentiment, whereas further escalation will deepen the sell-off.
The downward moment may drag the to 26550 – 26600 support range and if this support too is broken then index may tank near 26250 – 26200 range.
On the contrary, the upwar
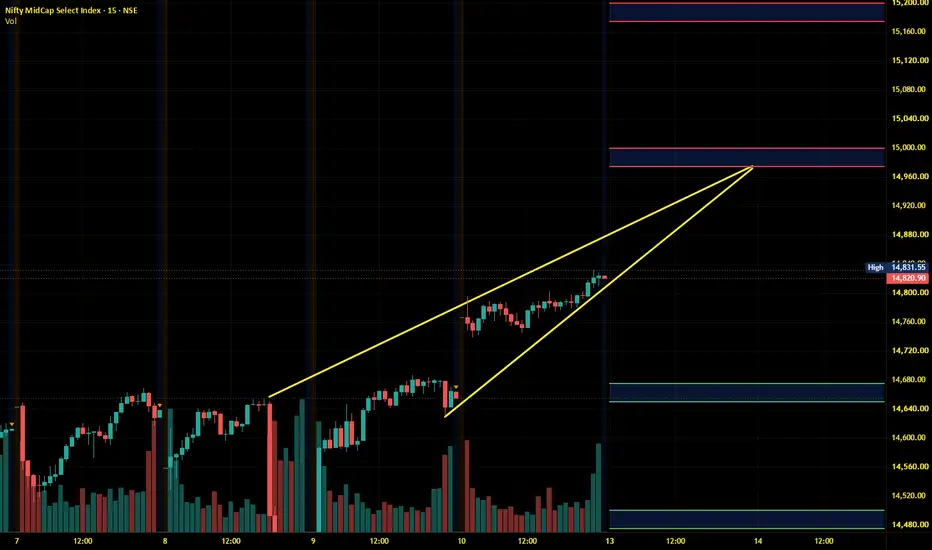
Midnifty Intraday Analysis for 13th July 2026NSE:NIFTY_MID_SELECT
Market volatility will surge as global indices open lower due to escalating US-Iran tensions, the threatened closure of the Strait of Hormuz, and soaring crude prices. Any positive diplomatic news to de-escalate the conflict will sharply boost sentiment, whereas further escalation will deepen the sell-off.
The downward moment may drag the index to 14675 – 14650 support range and if this support is broken then index may tank near 14500 – 14475 range.
On the contrary, th
Ashok Leyland...The price was making lower lows and falling. Now it has stopped falling, given a trendline breakout, and formed a higher low.
The price should sustain above it to move up further.
Buy above 157 - 159 with the stop loss of 153.5 for the targets 162, 166, 172, 176 and 180.
This movement can happen if the price moves with the same momentum.
If it breaks 153 and falls below 150, it can test the next support at the 140 - 142 zone.
Always do your analysis before taking any trade.
EUR/USD Short: Trendline Breakout and Resistance RejectionThis trade setup captures a bearish reversal on the EUR/USD 4-hour chart. After a significant downward impulsive move, the price entered a consolidation phase, forming a series of lower highs against a clear ascending trendline.
The setup is triggered by a decisive break below the yellow diagonal support line, following a failed attempt to rally back into the overhead supply zone (the shaded grey area near 1.1480).
MASON XAUUSD – Trendline Break May Target FibonacciXAUUSD is trading around 4,071 after losing short-term recovery momentum near the Ichimoku structure. Price is now testing the rising trendline support, and the early-week focus is on whether gold can hold this structure or break lower.
The priority view is bearish if gold breaks below the trendline and strong support area. A clean breakdown may open the way toward the Fibonacci extension targets.
Technical View
Gold is currently moving inside a tightening structure between the descending resi
DLF — Reclaiming EMAs After Multi-Year Trendline Support TestOverview
DLF has staged a sharp move today (+3.96%, closing at 685.75), reclaiming both its 50 EMA (615) and 200 EMA (645) after a multi-month downtrend from the 2024 high of 967.60. This bounce comes off a well-established rising trendline that has held since 2021, having been tested and respected at the 2022 low, the 2023 low, and again at the recent 2026 low — making it a genuine multi-year structural support.
Closer view of recent Chart patterrn
Pattern Explanation
The stock has been i
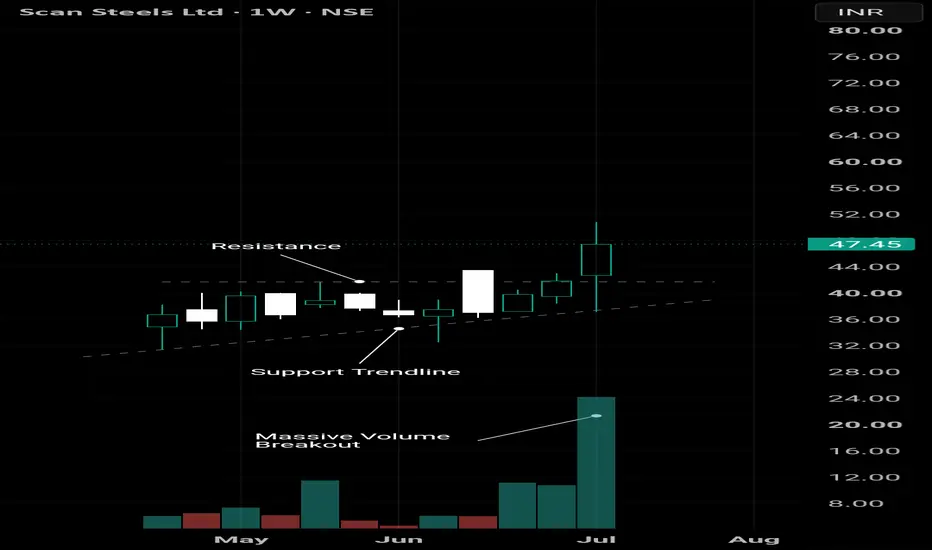
Chart Alert : Scan Steels🚨 Chart Alert : Scan Steels
Resistance ✅ Broken
Volume ✅ Explosive
Trend ✅ Strong
Ab Asli Sawal... Ye Sirf Breakout Hai Ya Next Big Rally Ki Beginning? 👀
📌 Bullish ya Fakeout? Apna target comments me batao.
🔖 Bookmark this tweet & let's revisit this chart after a few weeks.
🚨 Disclaimer: Not SEBI Registered. This post is for educational purposes only and is not a buy/sell recommendation.
#ScanSteels #StockMarket #Breakout #Trading
PAYTM | WEEKLY/CHARTMulti-month resistance has been broken. ✅
Old resistance is now acting as support. 📈
If this breakout sustains, the next leg of momentum could begin.
📌 Bookmark this tweet and revisit it in a few weeks.
Question for you:
Where do you think PAYTM heads next?
🔹 ₹1,500
🔹 ₹1,800
🔹 New ATH 🚀
👇 Drop your target in the replies.
⚠️ Not SEBI Registered. This post is for educational purposes only and is not a buy/sell recommendation.
#Paytm #StockMarket #Breakout #Trading
Nifty Intraday Analysis for 10th July 2026NSE:NIFTY
Global uncertainty has increased due to a fresh escalation between the US and Iran, which is expected to trigger market volatility. Consequently, markets may edge lower ahead of the weekend if the conflict intensifies further. However, any positive signals from either side before the closing bell could lift market sentiment.
The upward movement may lead to 24200 – 24250 resistance range and if the index crosses and sustains above this level then may reach near 24450 – 24500 range
Banknifty Intraday Analysis for 10th July 2026NSE:BANKNIFTY
Global uncertainty has increased due to a fresh escalation between the US and Iran, which is expected to trigger market volatility. Consequently, markets may edge lower ahead of the weekend if the conflict intensifies further. However, any positive signals from either side before the closing bell could lift market sentiment.
The upward moment may lead the Index to 58000 – 58100 resistance range in upward momentum and if the index crosses and sustains above this level then may
Finnifty Intraday Analysis for 10th July 2026NSE:CNXFINANCE
Global uncertainty has increased due to a fresh escalation between the US and Iran, which is expected to trigger market volatility. Consequently, markets may edge lower ahead of the weekend if the conflict intensifies further. However, any positive signals from either side before the closing bell could lift market sentiment.
The upward movement may lead the Index to 26750 - 26800 resistance range and if the index crosses and sustains above this level then may reach near 27050
Midnifty Intraday Analysis for 10th July 2026NSE:NIFTY_MID_SELECT
Global uncertainty has increased due to a fresh escalation between the US and Iran, which is expected to trigger market volatility. Consequently, markets may edge lower ahead of the weekend if the conflict intensifies further. However, any positive signals from either side before the closing bell could lift market sentiment.
The upward movement may lead the Index near 14800 – 14825 resistance range and if the index crosses and sustains above this level then may reach 1
MASON XAUUSD – Bullish Pullback Before Mid-Term Rally
XAUUSD is trading around 4,123 after recovering from the short-term correction zone. Price is still holding above the main uptrend trendline, while the current pullback is moving around the Fibonacci reaction area.
The priority view remains bullish in the medium term, as long as gold continues to hold above the buy order zone and the rising trendline support.
Technical View
Gold is still moving inside a bullish recovery structure. The higher low formation from the previous support area shows
NIFTY might show strong downfall below 23800!!As we can see NIFTY started off strong but failed to sustain itself at higher levels and has formed more like a hammer candle showing bearish bias. Now, until and unless NIFTY manages to close itself above 24150 level, every rise can be sold. Till then NIFTY is very bearish. So plan your trades accordingly and keep watching everyone.
Nifty Intraday Analysis for 09th July 2026NSE:NIFTY
The global market sentiment has turned negative following news that the United States cancelled its ceasefire agreement with Iran; however, any positive clarification could quickly lift the market, whereas a lack of resolution will likely keep it depressed.
The upward movement may lead to 24100 – 24150 resistance range and if the index crosses and sustains above this level then may reach near 24350 – 24400 range.
On the contrary, a downward moment may drag the Index to 23650 –
Banknifty Intraday Analysis for 09th July 2026NSE:BANKNIFTY
The global market sentiment has turned negative following news that the United States cancelled its ceasefire agreement with Iran; however, any positive clarification could quickly lift the market, whereas a lack of resolution will likely keep it depressed.
The upward moment may lead the Index to 57500 – 57600 resistance range in upward momentum and if the index crosses and sustains above this level then may reach near 58100 – 58200 range.
On the contrary, a downward moment m
Finnifty Intraday Analysis for 09th July 2026NSE:CNXFINANCE
The global market sentiment has turned negative following news that the United States cancelled its ceasefire agreement with Iran; however, any positive clarification could quickly lift the market, whereas a lack of resolution will likely keep it depressed.
The upward movement may lead the Index to 26600 - 26650 resistance range and if the index crosses and sustains above this level then may reach near 26900 - 26950 range.
On the contrary, a downward moment may drag the to