Nifty Intraday Analysis for 03rd July 2026NSE:NIFTY
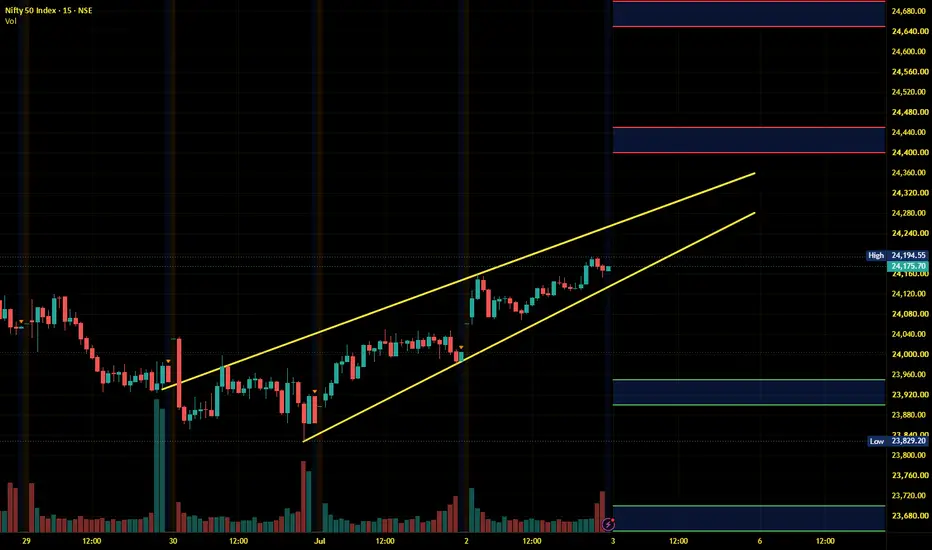
The uptrend is expected to continue, however, profit booking is expected on a higher level.
The upward movement may lead to 24400 – 24450 resistance range and if the index crosses and sustains above this level then may reach near 24650 – 24700 range.
On the contrary, a downward moment may drag the Index to 23950 – 23900 support range in downward momentum and if this support is broken then index may tank near 23700 – 23650 range.
Trend Lines
EIH Ltd – Inverse Head & Shoulders Near BreakoutEIH Ltd – Inverse Head & Shoulders Near Breakout
EIH appears to be forming a bullish Inverse Head & Shoulders (IH&S) pattern after a prolonged downtrend. The price has also reached the descending trendline, making this a high-confluence zone.
Technical Observations
* ✅ Inverse Head & Shoulders formation is clearly visible.
* ✅ Price is testing the neckline around ₹330–331.
* ✅ Long-term descending trendline is also being challenged at the same level.
* ✅ A close above both the neckline and tr
XAUUSD — Bullish Structure Holds Above EMA Value ZoneXAUUSD — Bullish Structure Holds Above EMA Value Zone
Fundamental Analysis
Gold is holding a stronger recovery structure as traders continue to watch USD momentum, Treasury yields, and upcoming U.S. macro data.
For now, the technical structure is improving. As long as price holds above the EMA value zone, the bullish continuation scenario remains favoured.
Technical Analysis
On the 1H chart, XAUUSD is trading around 4,179 after a strong recovery from the lower structure near 3,970 - 4,020.
EURUSD — Bearish EMA Trend, Sell From Fibonacci Value Zone
Fundamental Analysis
EURUSD remains under pressure as traders continue to watch USD momentum, Fed expectations, and upcoming macro data.
For now, the main structure still favours sellers while price trades below the higher EMA resistance zone. Any recovery should be viewed as a corrective pullback unless EURUSD can reclaim the main sell zone with strong confirmation.
Technical Analysis
On the 2H chart, EURUSD is still moving in a bearish structure. EMA 34, EMA 89, and EMA 200 remain positi
TATAMOTORS-PV | Inverse Head & Shoulders —Right Shoulder FormingOverview
Tata Motors Passenger Vehicles is forming a textbook Inverse Head & Shoulders pattern on the Daily chart — one of the most reliable bullish reversal patterns in technical analysis. The pattern is currently in its final phase, with the Right Shoulder actively forming near current price levels. A breakout above the Neckline at ₹414 would confirm the pattern and signal a potential major trend reversal.
The Broader Context — Descending Channel
Since the highs of late 2025, TATAMOTORS-PV ha
LT: Pullback Near Rising Trendline – Will Support Hold ?Overview
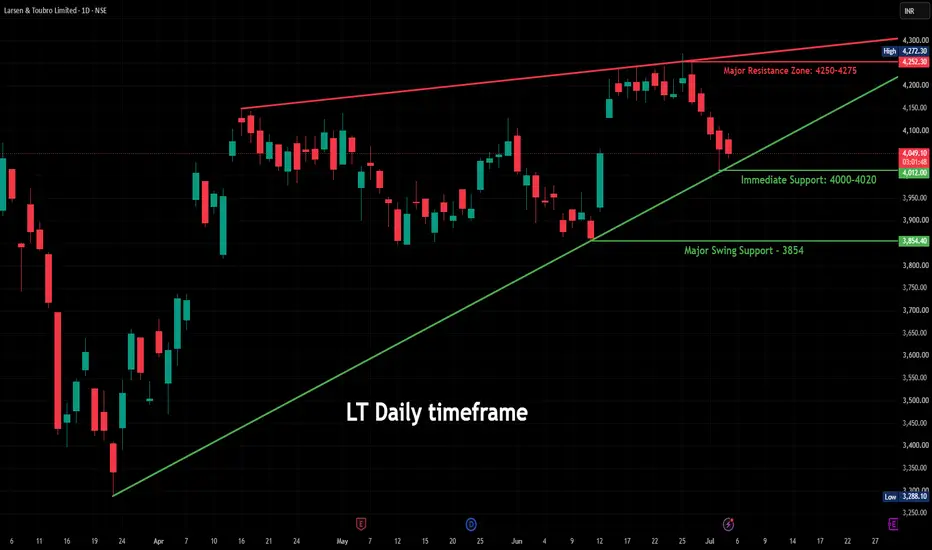
Larsen & Toubro (LT) has entered a healthy pullback after facing rejection from the 4250–4275 resistance zone. Despite the recent decline, the broader market structure remains constructive, with price approaching a rising trendline that has acted as dynamic support over the past few months.
The current setup places LT at an important technical decision point.
Chart Structure
The rising trendline has consistently attracted buyers during previous corrections, making the 4000–4020 regi
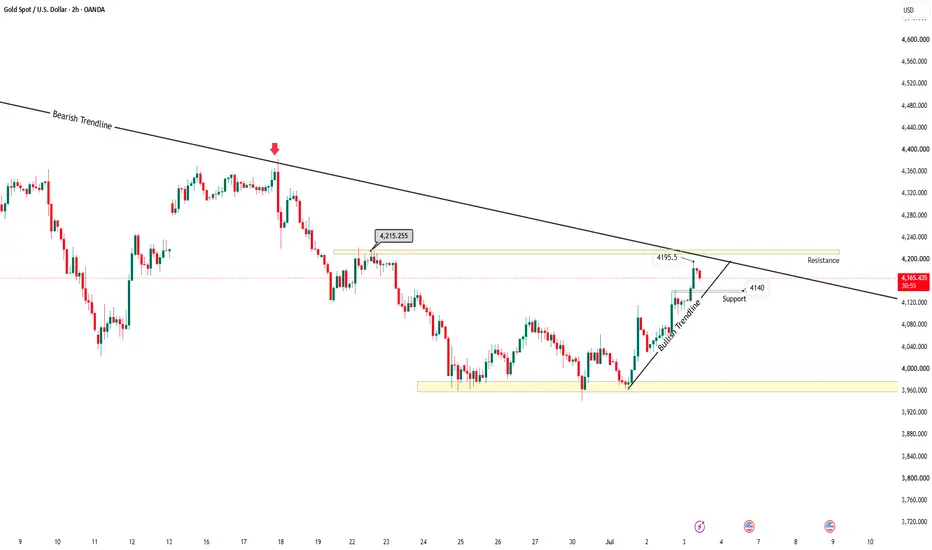
Outlook for GOLD(XAUUSD) & the way ahead.Price is making higher highs and higher lows structure, supported by bullish trendline, flag and pennant formation is visible and price has already shown 3 legs and now 4th leg is expected to be an extended one, immediate resistance is at 4215.3 and is a strong supply zone, price is approaching major bearish trendline, expected to face rejection, only if price rejects further up move and after a consolidation breaks below the range we can plan for short entries.
In summary: Bullish to side ways
MASON XAUUSD – Gold Extends Bullish Momentum After NFP
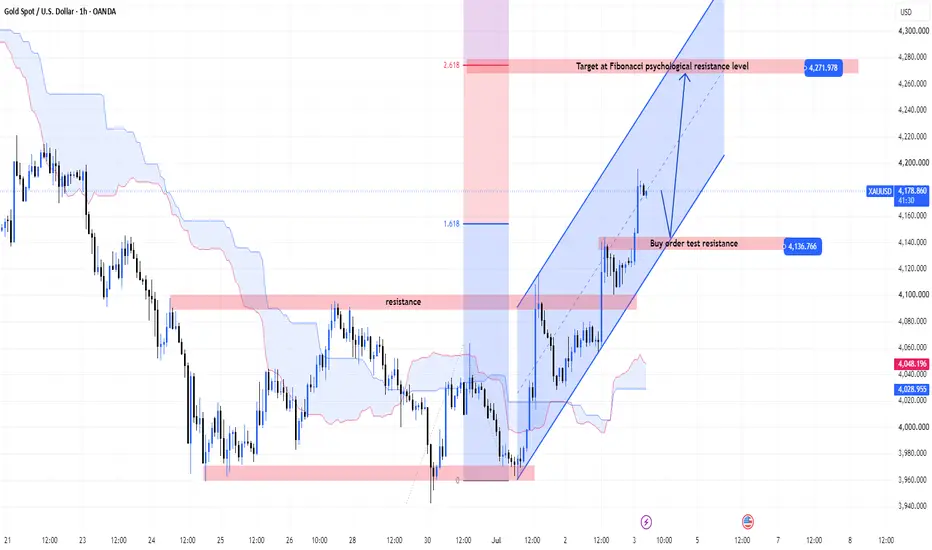
XAUUSD is trading around 4,178 after a strong bullish continuation following the NFP reaction. Price has broken above the previous resistance zone and continues to hold above the Ichimoku structure, keeping the short-term bias bullish.
The priority view remains buy on pullback, but traders should be careful today because bank holiday conditions may reduce liquidity and create irregular price movement.
Technical View
Gold is showing clear bullish momentum after breaking above the previous res
Strong Breakout, But Smart Money Will Wait for the RetestGold is showing a strong bullish reaction after breaking above the previous resistance structure.
The price is now trading around 4,180 - 4,185, moving inside a clear short-term uptrend channel.
This move looks powerful.
But this is also the moment where many traders make the same mistake:
They chase the candle too late.
For me, the better plan is not to chase the breakout.
The better plan is to wait for the market to retest the zones that created the move.
THE SIMPLE READ
Gold is curren
The Breakout Looks Strong, But This Level Decides EverythingGold has finally pushed out of the previous compression structure.
The move looks stronger now, but this is where traders need to stay calm.
A breakout can attract buyers.
But the real question is not whether gold broke out.
The real question is whether gold can hold the breakout.
Right now, price is trading around 4,070 - 4,075, near the Fibo reaction zone.
This area may decide whether gold continues higher or needs a deeper retest first.
THE SIMPLE READ
Gold is trying to shift from rec
A strong closing above the trendline! STRONG UPMOVE INCOMING!??As we can see NIFTY managed to close itself above the trendline which is a strong bullish bias. Additionally, we can see NIFTY forming more of an inverted head and shoulders pattern which is strong bullish reversal structure. Keeping all these in mind, we can expect NIFTY to remain bullish and show a strong upmove above 24180-200 levels, which is the neckline of the structure. So plan your trades accordingly and keep watching everyone.
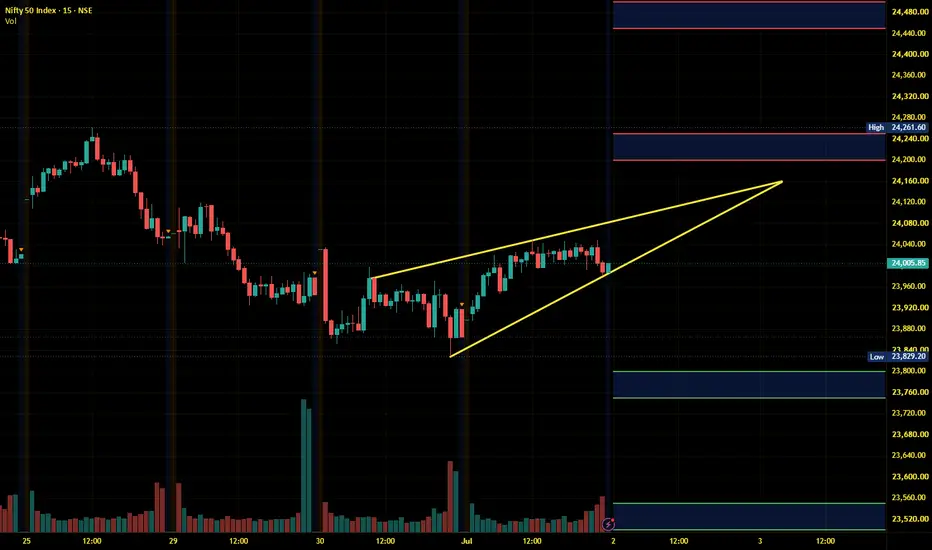
Nifty Intraday Analysis for 02nd July 2026NSE:NIFTY
The uptrend should continue, with a reversal expected from support levels if the market drops.
The upward movement may lead to 24200 – 24250 resistance range and if the index crosses and sustains above this level then may reach near 24450 – 24500 range.
On the contrary, a downward moment may drag the Index to 23800 – 23750 support range in downward momentum and if this support is broken then index may tank near 23550 – 23500 range.
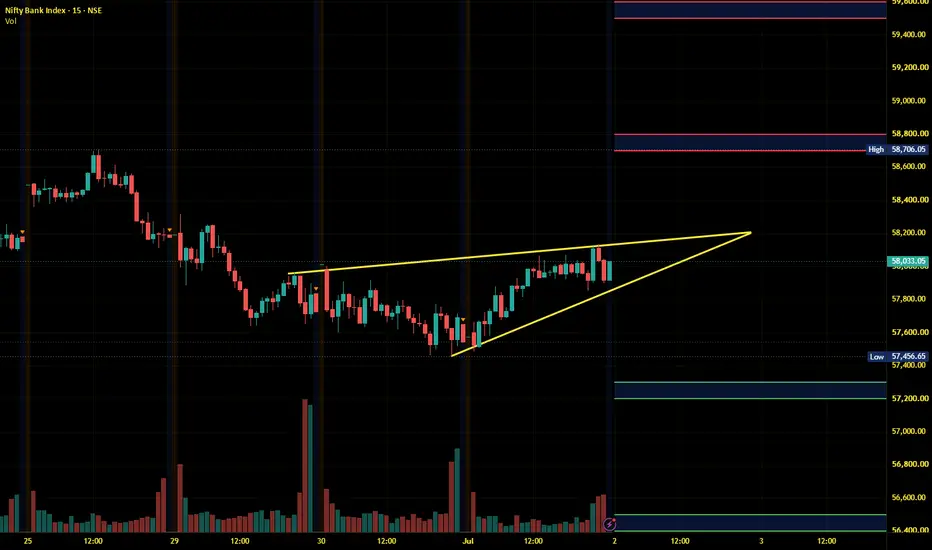
Banknifty Intraday Analysis for 02nd July 2026NSE:BANKNIFTY
The uptrend should continue, with a reversal expected from support levels if the market drops.
The upward moment may lead the Index to 58700 – 58800 resistance range in upward momentum and if the index crosses and sustains above this level then may reach near 59500 – 59600 range.
On the contrary, a downward moment may drag the Index to 57300 – 57200 support range in downward momentum and if this support is broken then the index may tank near the 56500 – 56400 range.
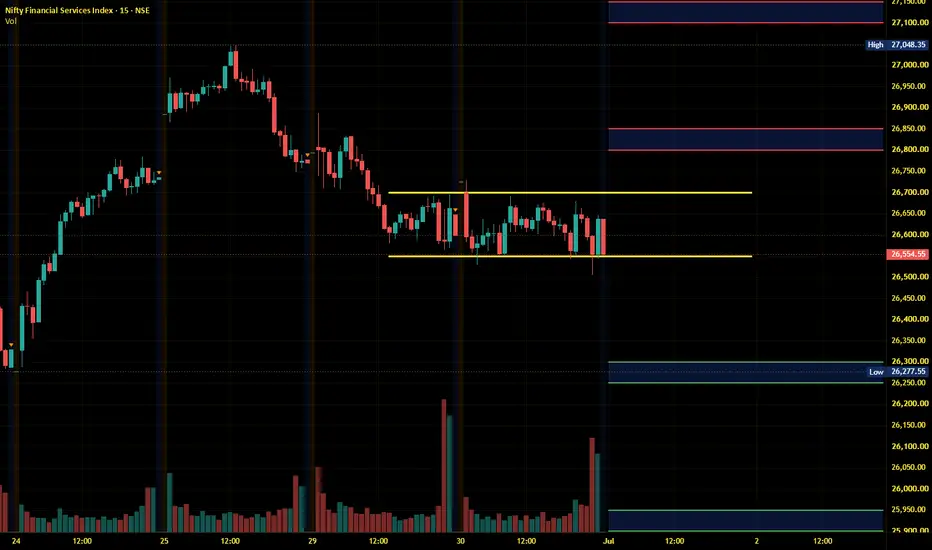
Finnifty Intraday Analysis for 02nd July 2026NSE:CNXFINANCE
The uptrend should continue, with a reversal expected from support levels if the market drops.
The upward movement may lead the Index to 27050 - 27100 resistance range and if the index crosses and sustains above this level then may reach near 27350 - 27400 range.
On the contrary, a downward moment may drag the to 26550 – 26500 support range and if this support too is broken then index may tank near 26250 – 26200 range.
Midnifty Intraday Analysis for 02nd July 2026NSE:NIFTY_MID_SELECT
The uptrend should continue, with a reversal expected from support levels if the market drops.
The upward movement may lead the Index near 14700 – 14725 resistance range and if the index crosses and sustains above this level then may reach 14900 – 14925 range.
On the contrary, a downward moment may drag the index to 14400 – 14375 support range and if this support is broken then index may tank near 14200 – 14175 range.
ONGC Weekly | Long Term Trendline Support Test — Decision PointOverview
Oil & Natural Gas Corporation — one of India's largest PSU energy companies — is currently testing a critical long term rising trendline on the Weekly chart. This trendline has supported ONGC's price structure since 2020 and is now being tested for the first time in recent memory, making the current price zone one of the most important levels on ONGC's chart.
The Long Term Rising Trendline
Since the 2020 low of ₹50, ONGC has been rising within a well-defined uptrend, supported by a cle
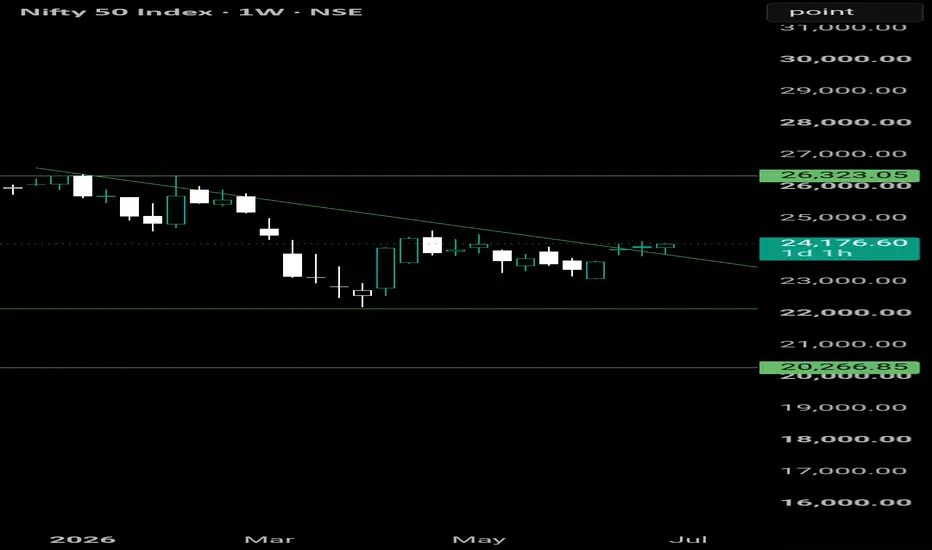
Weekly Nifty50 Update Nifty is testing a key falling trendline.
A decisive breakout could trigger fresh bullish momentum. 🚀
The next few weekly candles will be crucial for defining the market's medium-term trend.
What's your view — Breakout or Rejection? 👇
Disclaimer: This analysis is shared for educational purposes only and should not be considered as buy/sell or investment advice. Always do your own research before investing.
XAUUSD — Sell From Fibonacci Value Zone With EMA TrendXAUUSD — Sell From Fibonacci Value Zone With EMA Trend
Fundamental Analysis
Gold remains under pressure as traders continue to watch USD strength, Treasury yields, and upcoming U.S. macro data.
For now, the technical structure still favours sellers while price trades below the main EMA resistance area. Any recovery should be treated as a pullback unless gold can reclaim the EMA value zone with strong confirmation.
Technical Analysis
On the 4H chart, XAUUSD is still moving inside a bearish s
NIFTY must break and close above either of the trendlineAs we can see NIFTY reversed as expected because of the trendline support below. Now that we between the two important trendline support and resistance, we may see NIFTY showing a strong breakout or breakdown on the break of either of the trendline. We must keep a close watch the movement could be quick which could be unidirectional so keep watching and plan your trades accordingly.
Nifty Intraday Analysis for 01st July 2026NSE:NIFTY
Market is expected to bounce on at the start of July '2026 Month F&O contract.
The upward movement may lead to 24100 – 24150 resistance range and if the index crosses and sustains above this level then may reach near 24350 – 24400 range.
On the contrary, a downward moment may drag the Index to 23650 – 23600 support range in downward momentum and if this support is broken then index may tank near 23400 – 23350 range.
Banknifty Intraday Analysis for 01st July 2026NSE:BANKNIFTY
Market is expected to bounce on at the start of July '2026 Month F&O contract.
The upward moment may lead the Index to 58250 – 58350 resistance range in upward momentum and if the index crosses and sustains above this level then may reach near 59050 – 59150 range.
On the contrary, a downward moment may drag the Index to 56850 – 56750 support range in downward momentum and if this support is broken then the index may tank near the 56050 – 55950 range.
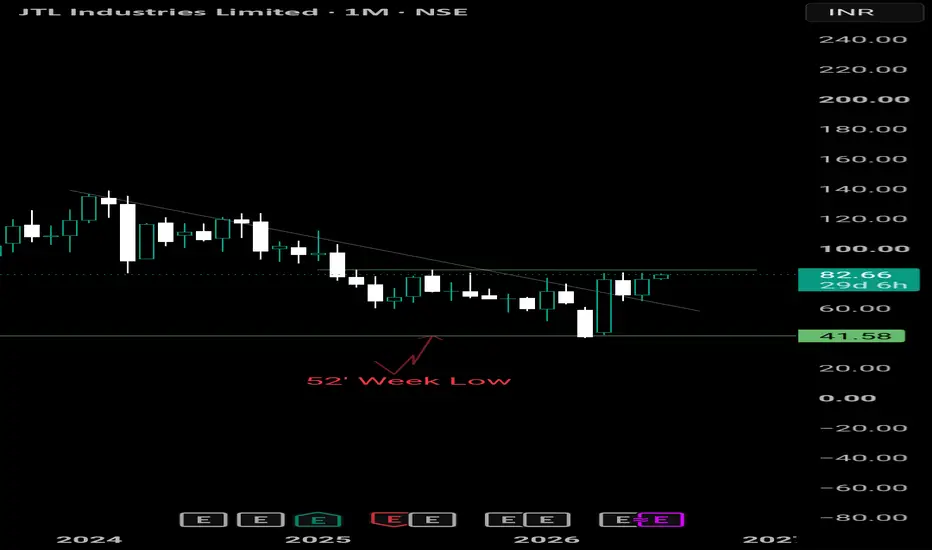
Finnifty Intraday Analysis for 01st July 2026NSE:CNXFINANCE
Market is expected to bounce on at the start of July '2026 Month F&O contract.
The upward movement may lead the Index to 26800 - 26850 resistance range and if the index crosses and sustains above this level then may reach near 27100 - 27150 range.
On the contrary, a downward moment may drag the to 26300 – 26250 support range and if this support too is broken then index may tank near 25950 – 25900 range.