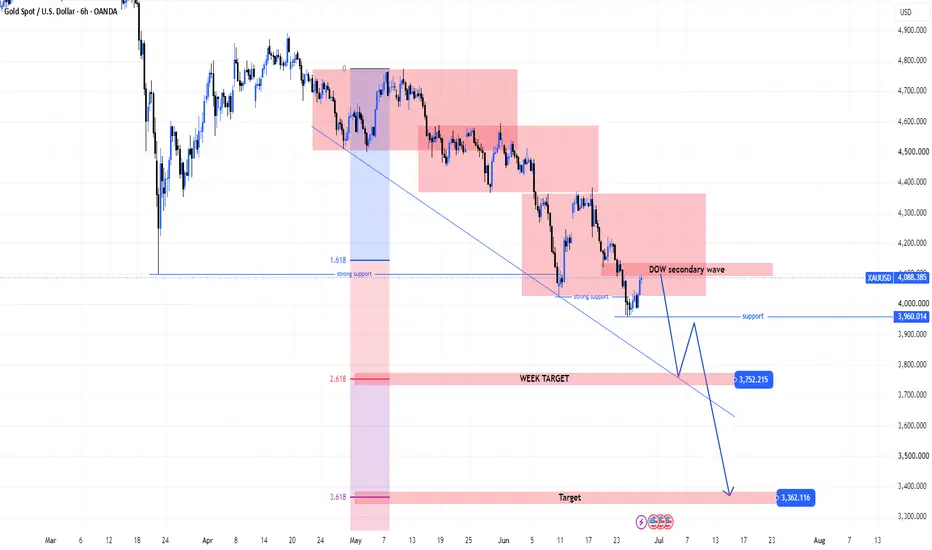
XAU- Medium-Term Bearish Structure Still Targets Lower LiquidityMASON XAUUSD – Medium-Term Bearish Structure Still Targets Lower Liquidity
XAUUSD is trading around 4,088 after recovering from the recent support area. Although gold is showing a short-term rebound, the medium-term structure remains bearish.
The main trend is still down, and any recovery toward resistance should be treated as a corrective wave unless price breaks back above the major supply structure.
Technical View
Gold is still moving inside a broad bearish structure. The chart shows a cle
Trend Lines
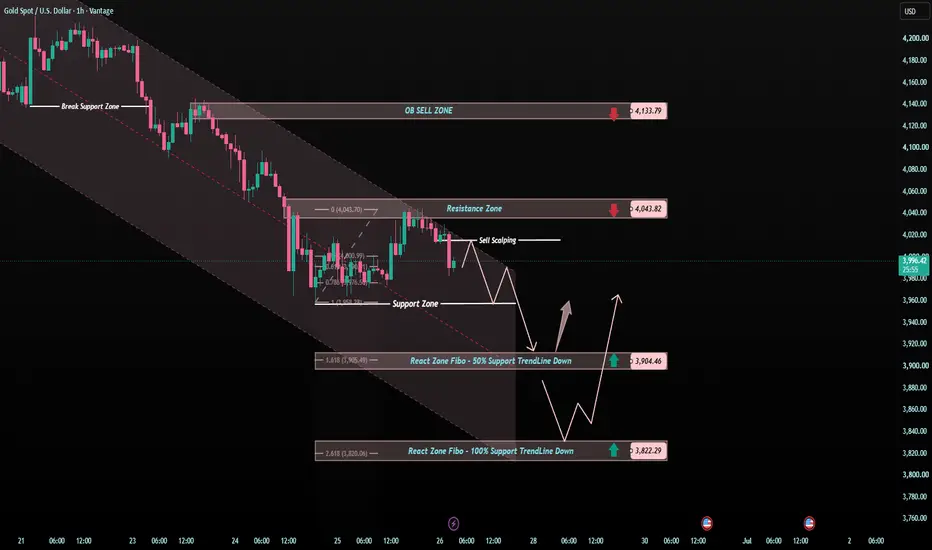
MASON XAUUSD – Important Rebound Zone AheadMASON XAUUSD – Gold May Rebound Toward Fibonacci Before Next Decision
XAUUSD is trading around 3,997 after a strong bearish move inside the descending channel. Price remains below the Ichimoku cloud, so the main structure is still bearish.
However, gold is reacting near the strong liquidity zone and buy area around 3,960–3,990, so a short corrective rebound may appear before the next trend confirmation.
Technical View
Gold is still moving inside a clear bearish channel. The market has been cr
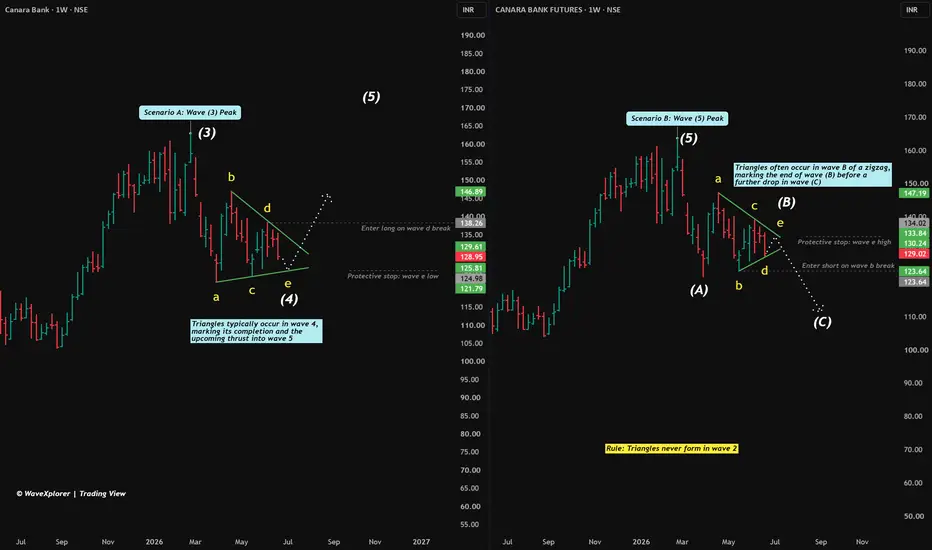
The Elliott Wave Triangle PlaybookTriangles are a trader’s best friend and worst nightmare.
They are notorious for driving technical analysts crazy. Why? Because while a triangle is forming, it looks exactly the same whether the market is preparing for a massive bullish breakout or setting a deadly trap for buyers.
To have different triangle notations, I have used Canara Bank spot chart on the left panel and the Futures chart on the right panel.
Look at the chart. We have a tightening squeeze with five sub-waves ( a-b-c-d-
XAUUSD — EMA Downtrend, Waiting for a Value Pullback
Fundamental Analysis
Gold remains under bearish pressure as price continues to trade below the main EMA structure. Traders are still watching USD momentum, Treasury yields, and upcoming U.S. macro data.
For now, any short-term recovery should be treated as a technical pullback unless price can reclaim the EMA resistance zone with strong confirmation.
Technical Analysis
On the 2H chart, XAUUSD is still trading below EMA 34, EMA 89, and EMA 200. This confirms that the main trend remains bear
GBPUSD — EMA Bearish Trend, Sell From Fibonacci Confluence
Fundamental Analysis
GBPUSD remains under pressure as traders continue to watch USD momentum, U.K. data, and broader market risk sentiment.
For now, the technical structure still favours sellers while price trades below the main EMA range. Any recovery should be treated as a corrective pullback unless GBPUSD can reclaim the key resistance zone with strong confirmation.
Technical Analysis
On the 1H chart, GBPUSD is still trading below EMA 34, EMA 89, and EMA 200. This confirms that the shor
EURUSD — EMA Bearish Trend, Sell From Value Zone
Fundamental Analysis
EURUSD remains under bearish pressure as price continues to trade below the main EMA structure. Traders are still watching USD momentum, Fed expectations, and upcoming macro data.
For now, the technical structure still favours sellers while recovery attempts remain limited below EMA resistance.
Technical Analysis
On the 2H chart, EURUSD is trading below EMA 34, EMA 89, and EMA 200. This shows that the short-term trend remains bearish, with the EMA structure acting as d
XAUUSD — Gold Is Still Under the Channel PressureGold is trying to stabilise around the 3,990 area, but the bigger structure is still not bullish yet.
Price remains inside a bearish channel, and every bounce is still facing selling pressure from above.
This is why I don’t want to rush into the recovery too early.
The real question is simple:
Can gold break resistance, or is this only another bounce before the next drop?
THE SIMPLE READ
Gold is currently moving between short-term support and resistance.
The support area is near 3,958.
T
Exact REVERSAL from our given trendline resistanceAs we can see NIFTY got strongly rejected exactly from our trendline resistance by trapping and creating a long wick above. This long wick not only shows the strength of rejection but also shows the effectiveness of trendline resistance. Hence as long as we are below the trendline and doesn't close above the trendline, every rise should be shorted. SO plan your trades accordingly and keep watching everyone.
Gold Is Bouncing, But the Sell Zones Are Still WaitingGold is trying to recover from the lower area, but the chart is still not giving buyers a clean victory yet.
Price is now reacting above the 3,966 support zone, while the short-term structure remains inside a bearish channel.
This is where traders need to be careful.
A bounce from support can look strong.
But the real test always comes at resistance.
THE SIMPLE READ
Gold is still trading under bearish pressure.
The current bounce may continue in the short term, but buyers need to prove st
Nifty Intraday Analysis for 25th June 2026NSE:NIFTY
Uptrend is intact, however, volatility is expected due to expiry of F&O contract on BSE on 25th June.
The upward movement may lead to 24250 – 24300 resistance range and if the index crosses and sustains above this level then may reach near 24500 – 24550 range.
On the contrary, a downward moment may drag the Index to 23800 – 23750 support range in downward momentum and if this support is broken then index may tank near 23550 – 23500 range.
Banknifty Intraday Analysis for 25th June 2026NSE:BANKNIFTY
Uptrend is intact, however, volatility is expected due to expiry of F&O contract on BSE on 25th June.
The upward moment may lead the Index to 58900 – 59000 resistance range in upward momentum and if the index crosses and sustains above this level then may reach near 59600 – 59700 range.
On the contrary, a downward moment may drag the Index to 57600 – 57500 support range in downward momentum and if this support is broken then the index may tank near the 56900 – 56800 range.
Finnifty Intraday Analysis for 25th June 2026NSE:CNXFINANCE
Uptrend is intact, however, volatility is expected due to expiry of F&O contract on BSE on 25th June.
The upward movement may lead the Index to 27000 - 27050 resistance range and if the index crosses and sustains above this level then may reach near 27300 - 27350 range.
On the contrary, a downward moment may drag the to 26450 – 26400 support range and if this support too is broken then index may tank near 26150 – 26100 range.
Midnifty Intraday Analysis for 25th June 2026NSE:NIFTY_MID_SELECT
Uptrend is intact, however, volatility is expected due to expiry of F&O contract on BSE on 25th June.
The upward movement may lead the Index near 14675 – 14700 resistance range and if the index crosses and sustains above this level then may reach 14875 – 14900 range.
On the contrary, a downward moment may drag the index to 14375 – 14350 support range and if this support is broken then index may tank near 14200 – 14175 range.
ICICI BankThe price is giving a trend line breakout. Though it looks bullish, today's candle close shows bearish sentiment. The price can take support from 1372 - 1382 zone. If this support did not hold, then it can take support from the trend line at the 1350 zone.
Support zones are 1350 and 1372.
Resistance zones are 1430 and 1442.
Watch how the price is acting at support/resistance before taking a trade.
XAUUSD — EMA Bearish Trend, Fibonacci Confluence Target in Focus
Fundamental Analysis
Gold remains under pressure as price continues to trade below the main EMA structure. Traders are still watching USD momentum, Treasury yields, and upcoming U.S. macro data.
For now, the technical structure still favours sellers while recovery attempts remain weak below EMA resistance.
Technical Analysis
On the 2H chart, XAUUSD is trading below EMA 34, EMA 89, and EMA 200. This confirms that the short-term trend remains bearish, with the EMA structure acting as dynamic
XAUUSD — Bearish Structure Holds, Sell Bias Below 4018
Gold is trading around $3,982 after forming a light accumulation phase near the lower range. Price has slowed down after the recent sell-off, but the main structure is still bearish as long as gold remains below the descending trendline and below the $4,018 invalidation area.
From an SMC perspective, gold has already created multiple MSS confirmations to the downside. The current sideways movement looks more like liquidity accumulation than a clear bullish reversal. This means sellers may sti
Gold Broke Support, But the Next Reaction MattersGold is starting the week with sellers still in control.
The earlier recovery failed to hold above the 4,201 - 4,223 reaction area, and price has now moved back below the short-term structure.
Now the market is asking a new question:
Will gold defend 4,128, or continue lower toward the deeper reaction zones?
THE SIMPLE READ
Gold is still trading inside a bearish structure.
The bounce into the upper reaction zone was not strong enough to create a clean breakout, and sellers reacted again fr
Gold Is Sitting on Support, But Sellers Are Still AboveGold is now testing one of the most important areas on the chart.
Price has moved down into the 4,059 support zone, while the bigger structure is still showing bearish pressure.
This is where the market often becomes emotional.
Some traders want to sell after the drop.
Others want to buy the support too early.
For me, this is not a place to rush.
This is a place to watch the reaction.
THE SIMPLE READ
Gold is still moving inside a bearish channel.
The recent breakdown shows that sellers
XAUUSD – Bearish Structure Remains Strong Below IchimokuMASON XAUUSD – Bearish Structure Remains Strong Below Ichimoku
XAUUSD is trading around 3,971 after a strong bearish continuation. Price remains inside the descending channel and below the Ichimoku cloud, so the main structure is still bearish.
The priority view remains sell setups, especially if price retests the short-term sell zone.
Technical View
Gold is still moving in a clear downtrend channel. The market continues to create lower highs and lower lows, showing that sellers are controlli
MASON XAUUSD – Downtrend Still Dominates, Rebound Is Secondary
XAUUSD is trading around 4,062 after another strong bearish move. Price remains below the Ichimoku cloud and below the broken trendline, so the main structure is still bearish.
The primary view is sell continuation, while the secondary scenario is a short technical rebound before the next confirmation.
Technical View
Gold is still moving under clear bearish pressure after breaking the previous trendline support. The latest reaction around 4,054 shows that price is testing a strong liquidity
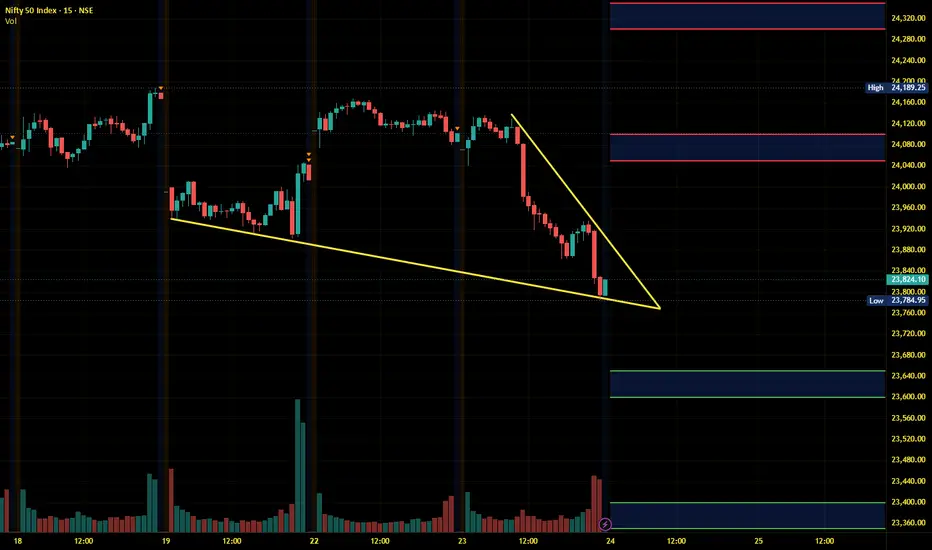
RECOVERED! But still below the trendline resistance As we can see NIFTY showed short covering as analysed In our previous turn that it could show some recovery because it is around the trendline support. Despite the recovery, we can still see NIFTY sustaining below the trendline support, making it weak technically. Hence as long as we are below the trendline resistance, every rise can be shorted till it finally closes above the trendline. So plan your trades accordingly and keep watching everyone.
Nifty Intraday Analysis for 24th June 2026NSE:NIFTY
Index is near resistance, however, volatility is expected due to expiry of F&O contract on BSE on 25th June.
The upward movement may lead to 24050 – 24100 resistance range and if the index crosses and sustains above this level then may reach near 24300 – 24350 range.
On the contrary, a downward moment may drag the Index to 23650 – 23600 support range in downward momentum and if this support is broken then index may tank near 23400 – 23350 range.
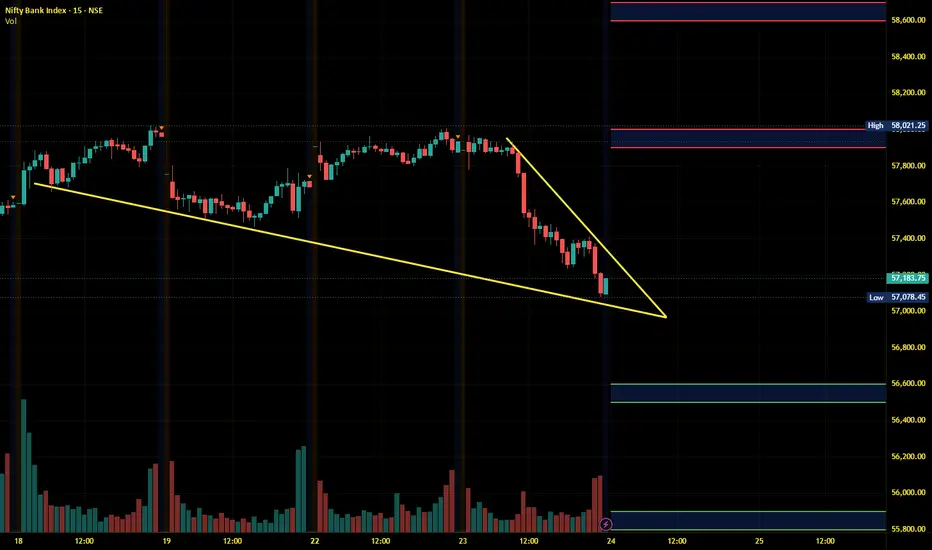
Banknifty Intraday Analysis for 24th June 2026NSE:BANKNIFTY
Index is near support, however, volatility is expected due to expiry of F&O contract on BSE on 25th June.
The upward moment may lead the Index to 57900 – 58000 resistance range in upward momentum and if the index crosses and sustains above this level then may reach near 58600 – 58700 range.
On the contrary, a downward moment may drag the Index to 56600 – 56500 support range in downward momentum and if this support is broken then the index may tank near the 55900 – 55800 range.
Finnifty Intraday Analysis for 24th June 2026NSE:CNXFINANCE
Index is near support, however, volatility is expected due to expiry of F&O contract on BSE on 25th June.
The upward movement may lead the Index to 26600 - 26650 resistance range and if the index crosses and sustains above this level then may reach near 26900 - 26950 range.
On the contrary, a downward moment may drag the to 26050 – 26000 support range and if this support too is broken then index may tank near 25750 – 25700 range.