CLSEL — Bullish Symmetrical Triangle Near BreakoutCurrent price: ₹301.90 | Weekly chart
Pattern: Symmetrical triangle / consolidation after strong uptrend
Breakout zone: ₹305–310
Immediate resistance: ₹320
Targets: ₹350 → ₹380 → ₹420
Support: ₹280, then ₹260
The setup is constructive. Price is testing the upper trendline while the lower trendline is rising, creating a clear compression.
Best trigger: Weekly close above ₹310 with volume.
Avoid: A breakdown below ₹280, which would weaken the setup.
₹310 breakout = bullish acceleration; ₹280
Trend Lines
Nifty Intraday Analysis for 07th September 2026NSE:NIFTY
Index is near resistance and if crosses and sustains above 24000 - 25050 resistance zone then uptrend is expected to be formed else downtrend is expected to continue.
The upward movement may lead to 24100 – 24150 resistance range and if the index crosses and sustains above this level then may reach near 24350 – 24400 range.
On the contrary, The downward moment may drag the Index to 23700 – 23650 support range in downward momentum and if this support is broken then index may ta
Banknifty Intraday Analysis for 07th September 2026NSE:BANKNIFTY
Highest Call and Put OI is at 58500 strike which will act as make or break level and downside risk is expected as long as Index is below 58500 level.
The upward moment may lead the Index to 58100 – 58200 resistance range in upward momentum and if the index crosses and sustains above this level then may reach near 58800 – 58900 range.
On the contrary, The downward moment may drag the Index to 56700 – 56600 support range in downward momentum and if this support is broken then th
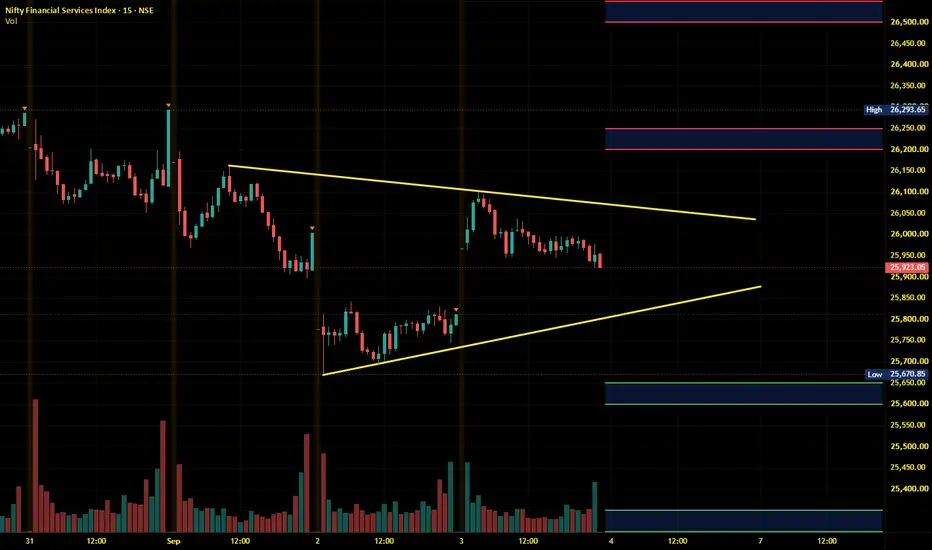
Finnifty Intraday Analysis for 07th September 2026NSE:CNXFINANCE
Index is in the 26000 - 26200 resistance zone and if it crosses and sustains above the resistance zone then uptrend is expected to be formed else downtrend is expected to continue.
The upward movement may lead the Index to 26300 - 26350 resistance range and if the index crosses and sustains above this level then may reach near 26600 - 26650 range.
On the contrary, The downward moment may drag the to 25800 – 25750 support range and if this support too is broken then index m
Midnifty Intraday Analysis for 07th September 2026NSE:NIFTY_MID_SELECT
Upside moment is expected to continue with a broader 14500 - 15000 range moment.
The upward movement may lead the Index near 14875 – 14900 resistance range and if the index crosses and sustains above this level then may reach 15050 – 15075 range.
On the contrary, The downward moment may drag the index to 14550 – 14525 support range and if this support is broken then index may tank near 14375 – 14350 range.
XAUUSD — Bullish Wave 3 From Buy Zone
Gold is building a bullish recovery structure after completing the previous bearish wave near the lower area. From Kelly’s view, the current chart suggests that XAUUSD may be preparing for a new upside continuation while price is holding around the Buy zone wave 3.
The key idea is simple: gold may be forming wave (2) correction now, and if buyers defend the current buy zone, wave (3) can start pushing toward the upper liquidity levels.
⟡ Market Structure
Gold reacted strongly from the previ
XAUUSD — 4,369 Hold or 4,325 Sweep?Gold is now testing an important reaction area after pulling back from the recent recovery move.
Price is trading around 4,400 - 4,410, and the chart is sitting close to the rising trendline support.
This is where the market becomes interesting.
The bigger bounce is still alive, but buyers need to defend the support zone clearly.
The simple read
4,369 is the first key support today.
This zone is marked as Liquidity Support / Buy Zone and also sits near the rising trendline.
If gold holds
CDSL — Bullish Triangle, Near BreakoutCurrent price: ₹1,421 | Weekly chart
Pattern: Large symmetrical triangle — price is near the apex.
Key breakout zone: ₹1,450–1,500 — descending trendline resistance.
Momentum: RSI ~57 and rising → positive, not overbought.
Support: ₹1,350–1,380
Major support: ₹1,200–1,250
Targets after breakout: ₹1,600 → ₹1,750 → ₹1,950–2,000
Failure level: Weekly close below ₹1,300 would weaken the setup.
My preferred trigger: weekly close above ₹1,500 with strong volume.
At ₹1,421, it is close to a major br
The Supply zone acting as a wallAs we can see NIFTY again got rejected from the supply zone we've ascertained. We should stand by our analysis as every rise can be shorted unless the supply zone above is broken and sustained. Till then every rise can be sold for 23750, 23600 and 23300 in worst case scenarios. So, plan your trades accordingly and keep watching everyone.
XAUUSD GOLD ANALYSIS ON (06 SEP 2026)#XAUUSD UPDATEDE
SELL LIMITED 4460-4480
If price stay below 4520, then next target 4400,4360 and 4320,4270 and above that 4600
Plan;If price break 4460-4480 area,and stay below 4520,we will place sell order in gold with target of 4400,4360 and 4320,4270 & stop loss should be placed at 4520
Kotak Bank: Multi-Year Structure Nearing Major TriggerThe long correction from the 450 peak completed at the 311.70 low through a double-three pattern (w-x-y). The strong rally to 459.30 made a new high, confirming that a fresh primary Wave (1) launched from 311.70.
Wave (2) Support and Volume
From 459.30, price entered a three-wave pullback (a-b-c) for Wave (2). This correction found firm support at 347, landing right on the 1.618 extension level and long-term trendline. The sharp rise in buying volume off this low indicates strong accumulation
BTCUSD SHOWING A GOOD UP MOVE WITH 1:8 RISK REWARD BTCUSD SHOWING A GOOD
UP MOVE WITH 1:8 RISK REWARD
DUE TO THESE REASON
A. its following a rectangle pattern that stocked the market
which preventing the market to move any one direction now it trying to break the strong resistant lable
B. after the break of this rectangle it will boost the market potential for break
C. also its resisting from a strong neckline the neckline also got weeker ald the price is ready to break in the outer region
all of these reason are indicating the same thing it
RELIANCE — 5-Year Trendline Meets Falling WedgeOverview
Reliance Industries is trading at 1,322.0, up 1.50%, testing a major confluence zone where a 5-year rising trendline support meets the lower boundary of a shorter-term falling wedge. This dual support test makes the current zone an important one to watch for a potential reversal.
Long-Term Chart
Pattern Explanation
On the long-term view, Reliance has respected a rising trendline support stretching back 5 years, currently near 1,257. Zooming into the daily chart, price has been dec
XAUUSD — The Retest Zone Is the Real TestGold is trying to recover from the lower area, but the bigger structure is still not fully bullish.
Price is now trading around 4,425 - 4,435, right below the descending trendline pressure.
This is an important moment because the market is moving between two ideas:
A recovery continuation.
Or a retest trap before sellers return.
The simple read
4,469 is the first major resistance to watch.
This level is the OB Sell Zone and also sits near the downtrend retest area.
If gold moves into 4,4
Buy Today, Sell Tomorrow for 3–5%JAYASWAL NECO INDUSTRIES — BTST & SWING BREAKOUT SETUP
📊 Breakout Quality: 100/100 — Maximum Quality Score
⏱️ Timeframe: 1 Day
📈 20D: +405% | 1D: +223%
A strong bullish breakout has appeared with positive price action and momentum.
🎯 TRADE LEVELS
🔵 Entry: ₹99.89
🛑 ATR Stop Loss: ₹94.29
🎯 Target 1: ₹104.61
🎯 Target 2: ₹110.62
🎯 Target 3: ₹117.26
📌 TRADING SETUP
This setup can be considered for BTST and can also be used for Swing Trading if the price sustains above the breakout zone.
📌 NEVE
Buy Today, Sell Tomorrow for 3–5%WELSPUN ENTERPRISES LTD. — BTST & SWING BREAKOUT SETUP
📊 Breakout Quality: 75/100
A bullish breakout has appeared with positive price action and momentum.
🎯 TRADE LEVELS
🔵 Entry: ₹631.45
🛑 ATR Stop Loss: ₹600.07
🎯 Target 1: ₹651.67
🎯 Target 2: ₹677.40
🎯 Target 3: ₹705.80
📌 TRADING SETUP
This setup can be considered for BTST and can also be used for Swing Trading if the price sustains above the breakout zone.
📌 NEVER FORGET TO PLACE YOUR STOP LOSS.
Risk management is very important.
I wil
XAUUSD — The Breakdown Is Speaking NowGold is starting to show weakness again after losing the short-term support structure.
Price is currently moving around 4,390 - 4,400 after a sharp bearish candle pushed the market back below the recovery trendline.
For me, this is the important part:
The market is no longer in a clean bullish continuation.
Now the chart needs a reaction.
The simple read
The first support zone to watch is 4,367.
This is the nearest Fibo reaction area below the current price.
If gold holds this level, a s
Nifty Intraday Analysis for 04th September 2026NSE:NIFTY
Index is near resistance and if crosses and sustains above 24000 - 25050 resistance zone then uptrend is expected to be formed else downtrend is expected to continue.
The upward movement may lead to 24100 – 24150 resistance range and if the index crosses and sustains above this level then may reach near 24350 – 24400 range.
On the contrary, The downward moment may drag the Index to 23650 – 23600 support range in downward momentum and if this support is broken then index may ta
Banknifty Intraday Analysis for 04th September 2026NSE:BANKNIFTY
Highest Call and Put OI is at 58500 strike which will act as make or break level and downside risk is expected as long as Index is below 58500 level.
The upward moment may lead the Index to 58100 – 58200 resistance range in upward momentum and if the index crosses and sustains above this level then may reach near 58800 – 58900 range.
On the contrary, The downward moment may drag the Index to 56700 – 56600 support range in downward momentum and if this support is broken then th
Finnifty Intraday Analysis for 04th September 2026NSE:CNXFINANCE
Index is near 26000 - 26200 resistance zone and if crosses and sustains above resistance zone then uptrend is expected to be formed else downtrend is expected to continue if 25700 support is broken.
The upward movement may lead the Index to 26200 - 26250 resistance range and if the index crosses and sustains above this level then may reach near 26500 - 26550 range.
On the contrary, The downward moment may drag the to 25650 – 25600 support range and if this support too is b
Midnifty Intraday Analysis for 04th September 2026NSE:NIFTY_MID_SELECT
Upside moment is expected to continue with a broader 14500 - 15000 range moment.
The upward movement may lead the Index near 14925 – 14950 resistance range and if the index crosses and sustains above this level then may reach 15100 – 15125 range.
On the contrary, The downward moment may drag the index to 14600 – 14575 support range and if this support is broken then index may tank near 14425 – 14400 range.
XAUUSD — Bullish Setup From 4,425XAUUSD — Bullish Setup From 4,425
Gold is building a bullish recovery structure after completing the previous bearish wave 5 near the lower demand zone. From Kelly’s view, the current chart suggests that XAUUSD may be preparing for another upside leg if buyers continue to defend the End wave C / Buy zone.
The key idea is simple: gold may correct slightly first, but as long as price holds above the buy zone, the bullish structure remains valid toward the upper liquidity area.
⟡ Market Structur
ADANIGREEN (1D): Trendline Breakout WatchThe price is approaching a heavy confluence zone: the multi-month descending trendline and the moving average (blue curve) sitting right at 1,328.0. As your annotation correctly identifies, buying before it clears this zone is risky, as the stock could easily face rejection at this dual resistance.
Key Levels
Overhead Resistance: 1,328 – 1,335 (Moving average & descending trendline).
Crucial Support: 1,210 – 1,220 (Recent structural swing low).
Invalidation Level: Below 1,200.
Trade Setup: B
Will Nifty 50 Hit 21839 – 19037 Again?Wave (4): Complex correction developing
================================
NSE:NIFTY has entered an important technical phase after reaching 26277 . Elliott Wave count suggests that the index may still be working through a complex Wave (4) correction.
The larger picture shows Wave (3) completing near 26277, almost exactly at the 100% Fibonacci projection of Wave (1) near 26270.
From that high, Nifty declined to 21743 , forming a clear five-wave structure. The index then recovered stron