Understanding Ownership, Value, and Investment in Stock MarketWhat Are Shares?
A share is a unit of ownership in a company. When a company needs capital to start, expand, or modernize its operations, it may choose to raise funds by issuing shares to the public or to private investors. Each share represents a small portion of the company’s ownership. Shareholders, therefore, become part-owners of the business.
For example, if a company issues one million shares and an investor owns ten thousand of them, that investor owns one percent of the company. Owner
Trend Line Break
Algorithmic AI Trading Strategies: Transforming Modern Markets1. Meaning of Algorithmic AI Trading
Algorithmic AI trading refers to the use of computer programs powered by AI to execute trades based on predefined rules and adaptive learning models.
Unlike traditional algorithmic trading, AI-based systems can learn from historical and real-time data, improving decisions over time.
These strategies reduce emotional bias and enable data-driven decision-making.
2. Core Components of AI Trading Strategies
Data Collection: Market prices, volume, order book
Banknifty 15min TrendlineOn the 15-minute timeframe, Bank Nifty is forming a rising support trend line. Price is repeatedly taking support near this line, showing buying interest at lower levels. As long as this support holds, the short-term structure remains positive. A break below this support line may lead to quick downside, while holding above it can support a bounce or continuation move.
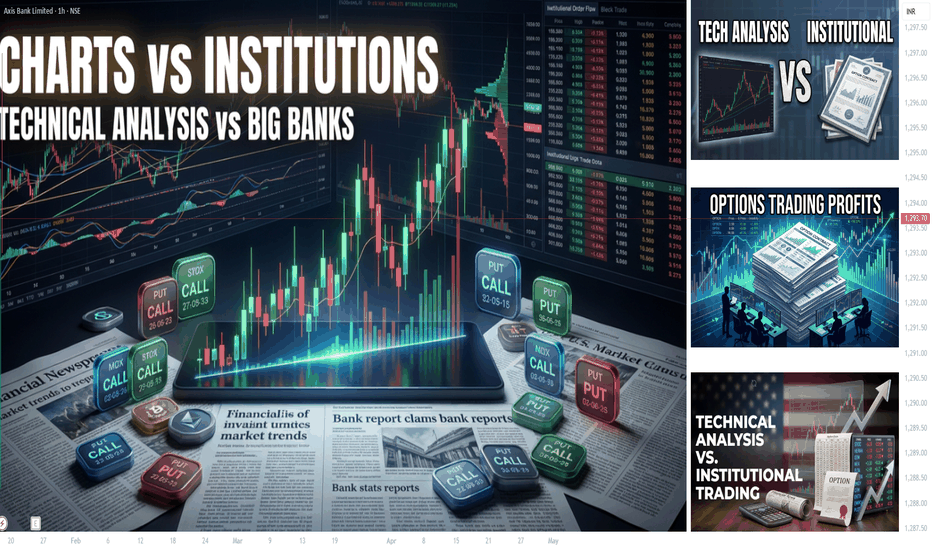
Part 2 Technical VS. Institutional Common Options Trading Strategies
Options trading is not limited to buying calls and puts. Some widely used strategies include:
Covered Call: Holding a stock and selling a call option to earn premium income.
Protective Put: Buying a put option to protect a stock holding from downside risk.
Straddle: Buying both a call and a put at the same strike price to profit from high volatility.
Strangle: Similar to a straddle but with different strike prices.
Spread Strategies: Using multiple options
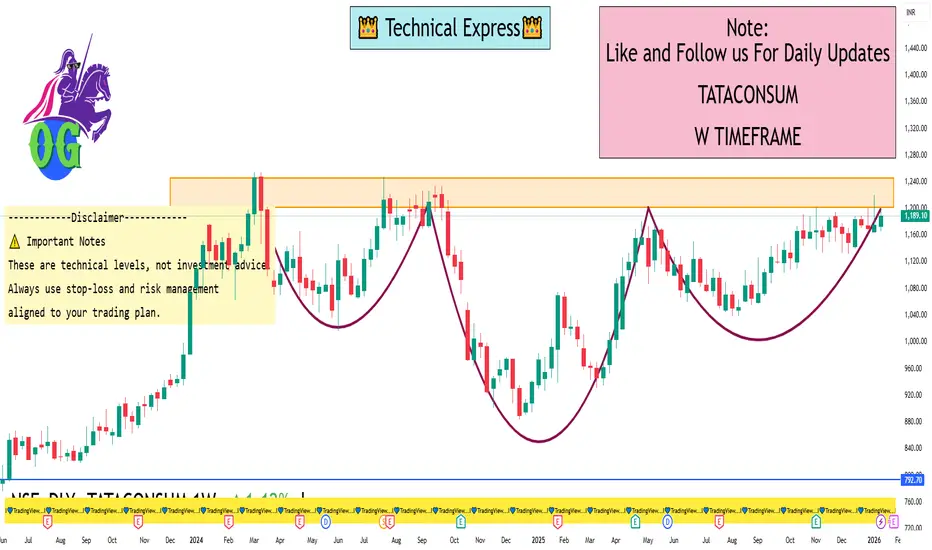
TATACONSUM 1 Week View 📊 Weekly Support & Resistance – Current Levels
Resistance Levels (Upside Targets)
R1: ~₹1,182 – first weekly resistance zone.
R2: ~₹1,200 – medium resistance.
R3: ~₹1,212–₹1,218 – higher resistance cluster.
Major weekly zone: ~₹1,243–₹1,265 – extended upside possible if breakout happens.
Support Levels (Downside Levels)
S1: ~₹1,152–₹1,153 – primary weekly support.
S2: ~₹1,131 – next support zone.
S3: ~₹1,097 – deeper support if S2 breaks.
Lower supports: ~₹1,136–₹1,151 cluster
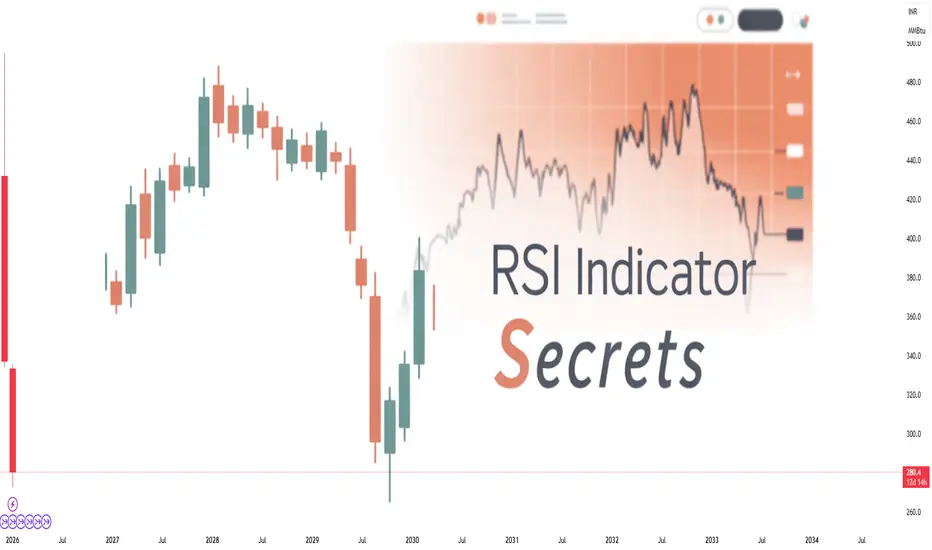
RSI Indicator: Sector-Wise Analysis and Its Importance in MarketUnderstanding RSI in Brief
RSI is plotted on a scale of 0 to 100. Traditionally:
An RSI above 70 indicates an overbought condition.
An RSI below 30 suggests an oversold condition.
RSI around 50 reflects a neutral or balanced momentum.
At the sector level, RSI does not focus on a single stock but instead represents the collective momentum of a group of stocks belonging to the same industry, such as banking, IT, pharmaceuticals, metals, FMCG, or energy.
Concept of Sector-Wise RSI
Sector-wis
Artificial Intelligence Is Transforming Modern Financial MarketsAI Trading Secrets:
The Evolution from Human Trading to AI-Driven Trading
Traditional trading relied heavily on human judgment, technical indicators, and fundamental analysis. While effective to a degree, human traders are limited by emotions such as fear and greed, slower reaction times, and the inability to process vast datasets simultaneously. AI trading systems emerged to overcome these limitations. By using algorithms trained on historical and real-time data, AI systems can identify patte
Part 2 Technical Analysis VS. Institutional Option Trading1. Time Decay (Theta)
Theta represents how much value option will lose per day even if price doesn’t move.
Sellers LOVE Theta
Buyers FEAR Theta
Near expiry:
A ₹200 premium may fall to ₹20 even with little change in spot.
This is how sellers make money consistently.
2. Volatility (Vega)
Options become expensive when volatility rises.
This usually happens:
Before major news: RBI policy, elections, budgets, Fed meetings.
During event-based uncertainty.
After events → IV crashes → Options
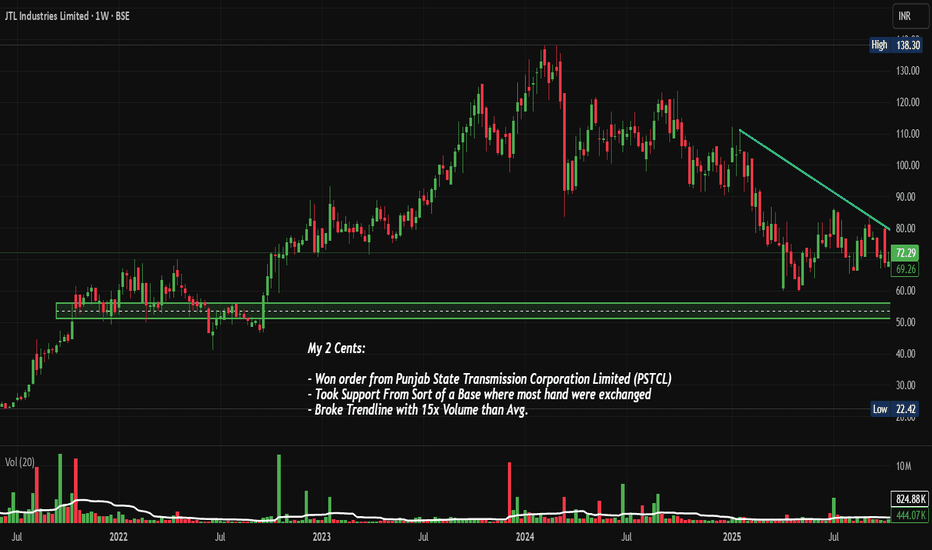
JTLIND: 3 year Downtrend Trendline Breakout, Chart of the WeekFrom ₹138 to ₹50: Why This Old Multi-Bagger Steel Stock Just Hit 20% Upper Circuit, Breaking 3-Year Downtrend and Getting a Big Order. Let's Understand in "Chart of The Week"
As per the Latest SEBI Mandate, this isn't a Trading/Investment RECOMMENDATION nor for Educational Purposes; it is just for Informational purposes only. The chart data used is 3 Months old, as Showing Live Chart Data is not allowed according to the New SEBI Mandate.
Disclaimer: "I am not a SEBI REGISTERED RESEARCH ANALYS
Part 7 Trading Master Class With Experts Advantages of Options
Small capital can control large exposure
Multiple strategies for any market condition
Limited risk for buyers
Hedging capabilities
Income generation for sellers
Disadvantages of Options
Time decay kills buyers
Volatility can cause unpredictable movements
Unlimited loss for unhedged sellers
Complex to understand initially
Liquidity issues in some stocks
Part 6 Learn Institutional Trading Key Participants in Option Trading
There are two primary participants:
Option Buyer
Pays a premium to buy the option
Has limited risk (maximum loss is the premium paid)
Has potentially unlimited profit (in certain cases)
Option Seller (Writer)
Receives the premium
Has limited profit (only the premium received)
Bears higher or unlimited risk
Understanding the mindset of buyers and sellers is crucial because option prices are driven by their interaction.
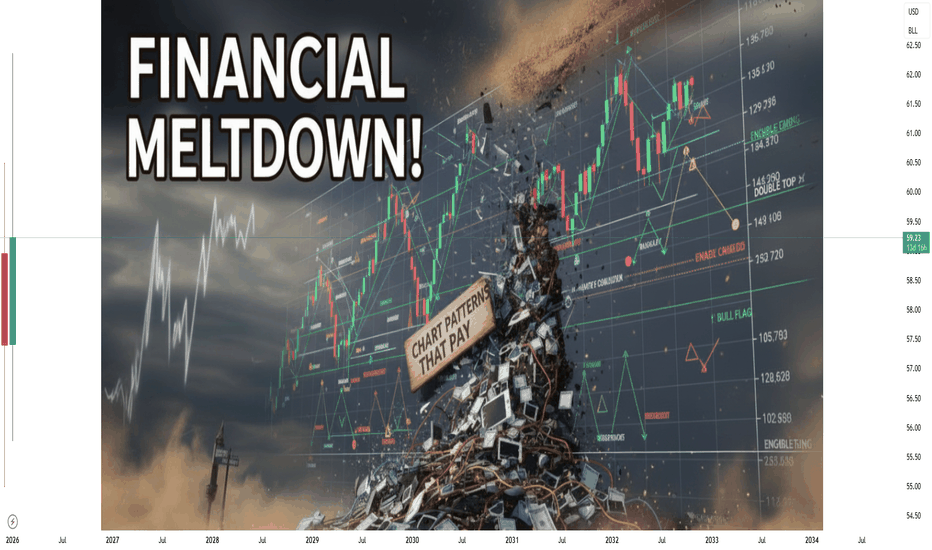
Chart Patterns What Are Chart Patterns?
Chart patterns are formations created by price movements on candlestick charts. When price repeatedly reacts at certain levels—like bouncing from support or rejecting resistance—it creates geometric structures. These structures reflect a battle between buyers (bulls) and sellers (bears).
Patterns help answer key questions:
Is the trend continuing or reversing?
Where is the next breakout?
Who is in control—buyers or sellers?
Where can a trader enter with optimal ris
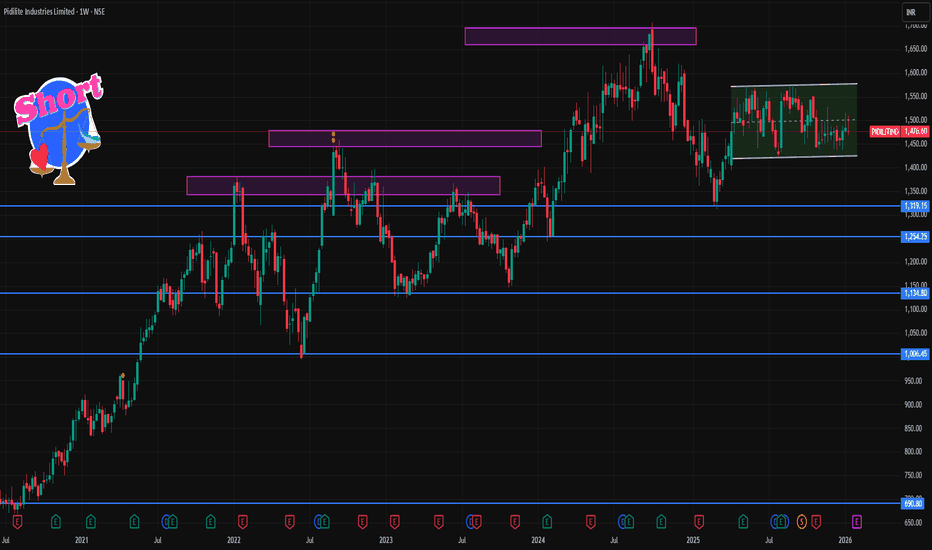
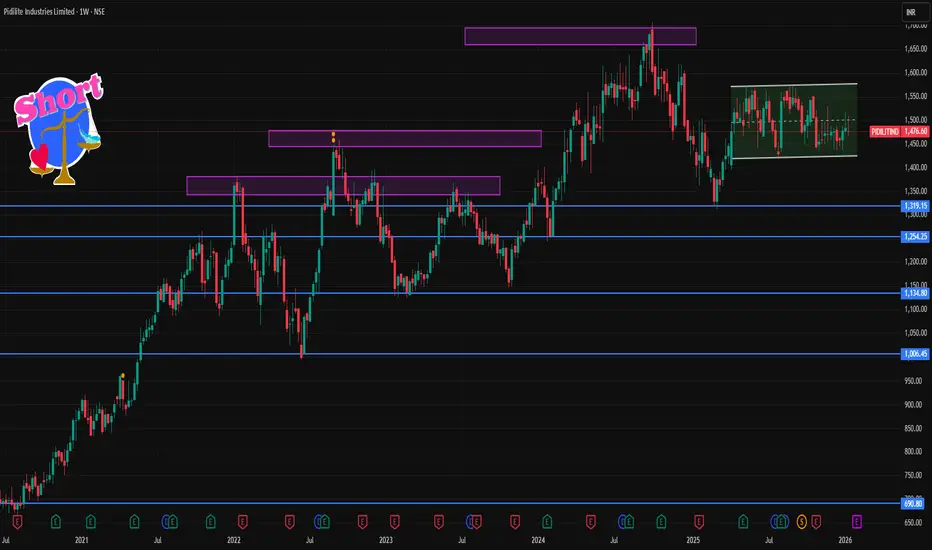
PIDILITIND 1 Week Time Frame 📌 Current Weekly Price Context (as of 16‑17 Jan 2026)
Last seen price: ~₹1,475 on NSE (latest technical snapshot)
Weekly momentum on short/medium averages is neutral (no strong trend bullish or bearish on EMA/SMA clusters)
RSI and other oscillators are also neutral to modestly positive — not extreme.
📈 Weekly Pivot & Key Levels (classic weekly pivot analysis)
Resistance Zones
1. R1: ~₹1,498–₹1,500
2. R2: ~₹1,507–₹1,520
3. R3: ~₹1,520+ (next cluster)
(Weekly pivot resistances based on recent p
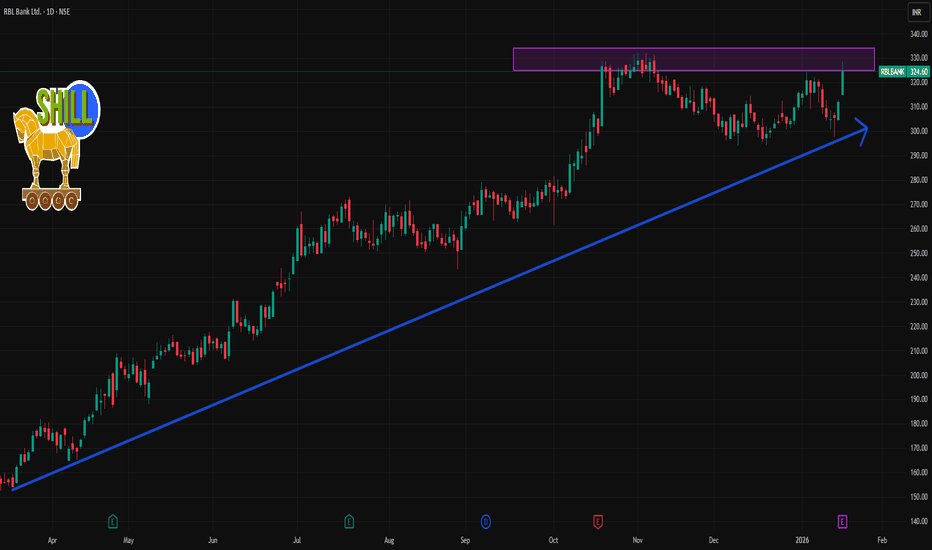
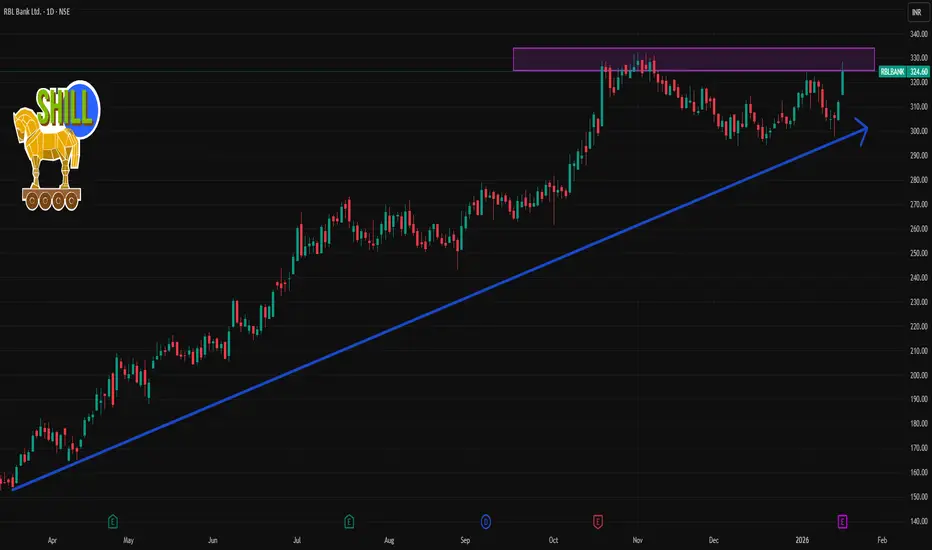
RBLBANK 1 Day Time Frame 📊 Daily Support & Resistance Levels
Immediate resistances:
~₹315–₹318 area — observed short-term resistance zone and recent highs.
~₹325–₹330 — upper resistance band near recent 52-week highs.
Immediate supports:
~₹300–₹295 — important short-term support zone on daily charts.
~₹285–₹280 — next support cluster if breakdown below ₹295 occurs.
📉 Pivot & Intraday Levels (Indicative)
(These are based on typical pivot calculations from recent sessions — actual values will vary daily)
Pivot: ar
Trading Plan for SuccessUnderstanding the Purpose of a Trading Plan
The primary purpose of a trading plan is to bring structure and clarity to your trading activities. Markets are unpredictable, and no strategy works all the time. A trading plan does not eliminate losses, but it ensures that losses are controlled and gains are maximized when the market moves in your favor. It defines what you trade, when you trade, how much you trade, and why you trade. By following predefined rules, traders avoid emotional decisions
Indian Trading Market Reports: Trends and PerformanceStructure of the Indian Trading Market
India’s trading market is primarily driven by its two major stock exchanges: the National Stock Exchange (NSE) and the Bombay Stock Exchange (BSE). These exchanges facilitate trading in equities, derivatives, currencies, and commodities. Equity markets form the backbone of trading activity, while derivatives such as futures and options contribute significantly to daily volumes, particularly in indices like NIFTY 50 and BANK NIFTY.
Market reports usually b
Cryptocurrency as a Digital Asset1. Introduction to Cryptocurrency
Cryptocurrency is a form of digital or virtual asset that uses cryptography for security.
Unlike traditional money, it exists only in digital form and is not issued by any central authority like a government or central bank.
Bitcoin, launched in 2009, was the first cryptocurrency, followed by thousands of others such as Ethereum, Solana, and Ripple.
Cryptocurrencies operate on blockchain technology, which ensures transparency and security.
2. Meaning of Dig
Smart Money SecretsHow Institutional Investors Really Win in Financial Markets
In financial markets, the term “smart money” refers to capital controlled by institutions, professional traders, hedge funds, banks, and experienced investors who possess deep knowledge, superior resources, and disciplined strategies. Unlike retail traders, smart money does not chase headlines or react emotionally to short-term price fluctuations. Instead, it moves markets quietly, strategically, and with a long-term perspective. Under
XEducation
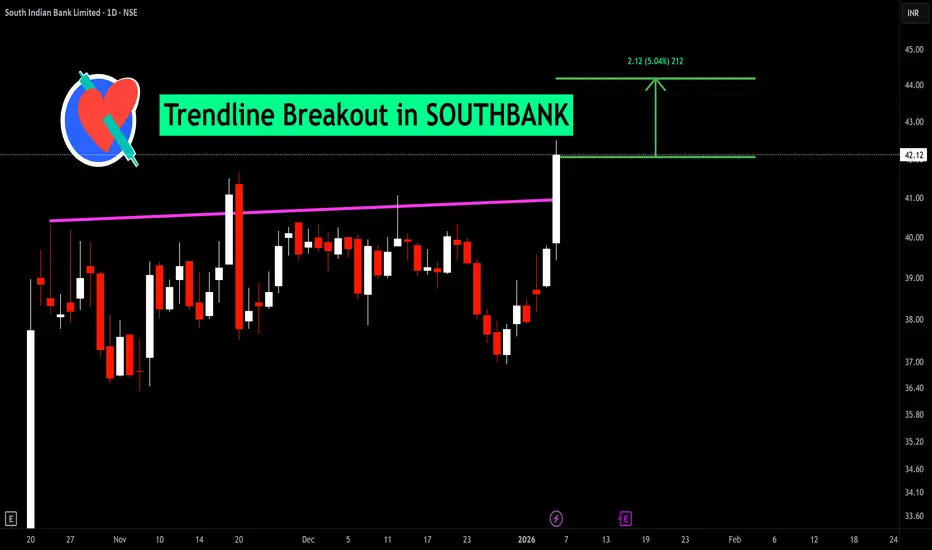
BUY TODAY SELL TOMORROW for 5%DON’T HAVE TIME TO MANAGE YOUR TRADES?
- Take BTST trades at 3:25 pm every day
- Try to exit by taking 4-7% profit of each trade
- SL can also be maintained as closing below the low of the breakout candle
Now, why do I prefer BTST over swing trades? The primary reason is that I have observed that 90% of the stocks give most of the movement in just 1-2 days and the rest of the time they either consolidate or fall
Trendline Breakout in SOUTHBANK
BUY TODAY SELL TOMORROW for 5%
Part 1 Ride The Big Moves Key Participants in Option Trading
There are two primary participants:
Option Buyer
Pays a premium to buy the option
Has limited risk (maximum loss is the premium paid)
Has potentially unlimited profit (in certain cases)
Option Seller (Writer)
Receives the premium
Has limited profit (only the premium received)
Bears higher or unlimited risk
Understanding the mindset of buyers and sellers is crucial because option prices are driven by their interaction.